Abstract
Tissue ablation with mid-infrared irradiation tuned to collagen vibrational modes results in minimal collateral damage. The hypothesis for this effect includes selective scission of protein molecules and excitation of surrounding water molecules, with the scission process currently favored. In this article, we describe the postablation infrared spectral decay kinetics in a model collagen-like peptide (Pro-Pro-Gly)10. We find that the decay is exponential with different decay times for other, simpler dipeptides. Furthermore, we find that collagen-like polypeptides, such as (Pro-Pro-Gly)10, show multiple decay times, indicating multiple scission locations and cross-linking to form longer chain molecules. In combination with data from high-resolution mass spectrometry, we interpret these products to result from the generation of reactive intermediates, such as free radicals, cyanate ions, and isocyanic acid, which can form cross-links and protein adducts. Our results lead to a more complete explanation of the reduced collateral damage resulting from infrared laser irradiation through a mechanism involving cross-linking in which collagen-like molecules form a network of cross-linked fibers.
INTRODUCTION
Significant efforts have been devoted to explaining the low level of collateral damage accompanying mid-infrared (IR), wavelength-selective, free-electron laser (FEL) irradiation of biological tissues as first reported by Edwards et al. (1). A recent observation of new stable IR absorption peaks in the 2300–2000 cm−1 band in FEL-ablated cornea (2) and lysozyme powder (3) suggested the possibility of new chemical species generated during and after ablation. To discover the mechanisms and pathways of possible reactions, we have examined the kinetics of wavelength-selective bond breaking and associated processes at multiple time scales. These experimental methods are germane to laser surgery and patterning and to the alteration of biomaterials (4). For example, others have explored laser-based methods for wound repair with the aim of faster, more durable tissue bonding with fewer complications from suture-related inflammation and infection (5). In addition, cross-linking in collagen has been studied extensively (6–8) for purposes of tissue welding, wound healing, and collagen stability during radiation treatment. These investigations have involved the use of a photosensitizer acting as a cross-linking agent. Incorporation of such laser-absorbing chromophores enables localized surface heating to limit the area of wound repair, which reduces the extent of collateral thermal damage of the underlying tissue (9). In this article, we demonstrate that it becomes possible to take advantage of native chromophores in a tissue to generate the cross-linking intermediates by tuning the FEL radiation to strongly absorbing vibrational frequencies in a collagen-like molecule.
MATERIALS AND METHODS
Materials
Model collagen-like compounds were used for more precise interpretation of the ablation results. Polypeptide compounds (Pro-Pro-Gly)10 and (Pro-Hyp-Gly)10 are well-accepted models of such collagen-like molecules (10–14). For more focused studies on the irradiation of peptide bonds, shorter molecules containing one or two amino acids (ie, Gly, Pro) were also used. The following lyophilized powders were acquired from Peptides International (Louisville, KY): (Pro-Pro-Gly)10·9 H2O (molecular mass of 2530.8 Da, purity > 95% by high-performance liquid chromatography (HPLC)), Gly-Pro (glycyl-L-proline, molecular mass of 172.18 Da, grade AA), Gly-Gly (glycyl-glycine, molecular mass of 132.12 Da, grade AA), glycine (molecular mass of 75.07 Da, grade AA), L-proline (molecular mass of 115.13 Da, grade AA); these lyophilized powders were purchased from Sigma-Aldrich (St. Louis, MO): HEW lysozyme derived from chicken egg white (molecular mass of 14.7 kDa, purity 95%), poly-L-proline (molecular mass of 1–10 kDa, purity 98%), and Pro-Gly (molecular mass of 172.18 Da, purity 98%). The compounds were used without additional purification.
Sample preparation
The powders were placed in a sealed optical cell comprising two parallel CaF2 or Si windows to collect products of the laser ablation. Sealing the cells kept the powder dry from atmospheric humidity for several days, as determined by Fourier transform infrared (FTIR) spectroscopy. The level of hydration of the powders was changed by drying at room temperature in 10−3 Torr vacuum overnight or by adding deionized water to the powder. All ablation experiments were performed at room temperature and normal humidity. Peptides, 0.2–5 mg like the powder, were used to obtain a thickness of the protein target material in a range of 5–60 μm. This was done to achieve an initial optical density <1.0 in the wavelength range under study or to have sufficient amounts of the material to detect low levels of volatile spectral peaks. The ablation and spectral studies were accomplished without opening the sealed optical cell; after ablation, all reaction products were retained inside the cell. This was done to detect unstable, volatile, or “difficult to detect” products in the reaction mixture and in the residual target material by avoiding contact with air. The sealed cell presented a drawback in that it was not possible to differentiate location of the intermediates and final products in the ablation debris or in the residual target material. Repeated ablation of the same sample spot was performed to produce enough material to permit spectroscopic detection of low intensity signals.
FTIR spectroscopy
After ablation, the optical cell was immediately placed in the sample chamber of the FTIR vacuum spectrometer with spectral resolutions 4–8 cm−1, averaging 32–128 scans (Bruker IFS-66v; Bruker Optics, Billerica, MA). The delay in transporting the optical cell to the spectrometer was 40–60 s. For single measurements and short spectral kinetic series, spectra were recorded in ambient atmosphere to eliminate the additional 15 min delay required to evacuate the chamber. Extended kinetic measurements, which required a series of 10–100 spectra at intervals of 2–30 min, were recorded in vacuo. The spectral series were processed using Opus 5.0 software obtained from Bruker Optics. The spectra were baseline corrected using the “rubberband” automatic correction method with 3000 baseline points. Then the peak positions and amplitudes were determined using either the standard method or a second derivative method. For multiple experimental trials, the kinetic curves were averaged using Origin 7.5 Pro software from OriginLab (Northampton, MA). To determine the decay times, the averaged curves were fit using the embedded Origin 7.5 curve-fitting module.
Laser ablation parameters
Parameters of the Vanderbilt University Mark-III FEL radiation were similar to those described previously (1,4). The Vanderbilt FEL source has a composite pulse structure consisting of 3–5 μs long macropulses at a repetition rate of 1–30 Hz. Each macropulse comprises 104 micropulses of 1–3 ps duration at a repetition rate of 2.85 GHz. Typical FEL exposure parameters were 1–100 macropulses per spot with energy of 3–40 mJ per macropulse, which was controlled by an attenuator. The wavelength range was 2.7–8.5 μm (3700–1170 cm−1). (Note: All references to fluence in this article correspond to the macropulse fluence.) To deliver FEL fluence significantly higher than the ablation threshold, focusing the laser beam to a spot <1 mm in diameter is required. This limitation, combined with ablation spot–probe beam overlapping criterion, typically leads to the necessity of using microspectroscopic techniques, such as micro-FTIR, micro-Raman, etc., utilizing a probe spot substantially smaller than the ablated area. In the case of highly inhomogeneous powder samples, these techniques are problematic in terms of repeatability across the sample. To bypass this limitation, arrays of overlapping ablated spots were produced by a focused laser beam scanned across the sample plane using a computer-controlled mirror deflector, the Vanderbilt University CAST III system (15). The scanning beam method has the advantage of producing a large ablated area on the sample plane at the level of a relatively uniform high FEL fluence, even for a single macropulse in each spot. This procedure permits the use of the FTIR in a regular transmission mode with a high repeatability and an excellent signal/noise ratio compared to the micro-FTIR mode. Depending on the operational parameters of the spectrometer, ablated sample areas from 2 mm × 2 mm to 9 mm × 9 mm were created. The FEL radiation was focused by a 0.5-m focal length lens to an 800-μm diameter spot at the sample surface inside the optical cell, which was determined by the knife-edge optical method. With these conditions, single macropulse fluences of Φ = 1–100 J/cm2 have been achieved.
Mass spectrometry
We used a proteomics approach based on liquid chromatography/mass spectrometry (LC/MS) (16–18). In brief, irradiated peptide powders were washed from the sample target (both internal window surfaces of the optical cell) and diluted with deionized water. The products were separated by ultra-high pressure LC on a high-speed chromatography system (Thermo Electron Accela UPLC; Thermo Scientific, San Jose, CA) using a 1.0 × 100 mm, 1.8 μm Acquity BEH C18 UPLC column (Waters, Milford, MA) and elution with an acetonitrile-water gradient containing 0.2% formic acid. A low mass resolution peptide survey was done by positive electrospray ionization (ESI) using a linear ion trap mass spectrometer (LTQ; Thermo Scientific) operating in data dependent scan (DDS) mode. The ESI ion source was operated at 4.5 kV using nitrogen for the desolvation (sheath) gas. The ion transfer capillary was maintained at 325°C. When operating in the DDS mode, the instrument first acquired a full scan precursor ion spectrum (scan event 1 (SE-1)), from which it extracted a list of the most abundant ions. In the next sequential scan, the LC/MS was placed in tandem MS mode, and the most abundant ion identified in SE-1 was fragmented to produce a series of characteristic product ions—scan event 2 (SE-2). This alternating scan sequence was repeated throughout the chromatographic analysis. Data were acquired using a data acquisition system (Xcalibur 2.0; Thermo Scientific) at a rate of ∼5 scan cycles per second.
High mass resolution (60,000 full width at half maximum (FWHM)) identification of products from the laser irradiation studies was carried out using a Fourier transform/mass spectrometer (FT/MS) instrument (Orbitrap; Thermo Scientific) equipped with a nanoflow ESI ion source. The Orbitrap instrument is a hybrid mass spectrometer in which the initial mass analyzer is an LTQ linear ion trap, followed by an orbital ion trap FT/MS mass analyzer (19,20). Nanoflow HPLC separations were performed on 100-μm inner diameter × 10-cm reversed-phase HPLC columns (Jupiter C18; Phenomenex, Torrance, CA) that were packed in the laboratory using nitrogen pressure. The ESI voltage (1.6–2.0 kV) was applied directly to the LC column by means of a metal-liquid junction. No desolvation gas was used. The ion transfer tube was maintained at 160°C. Peptides were eluted using an acetonitrile-water gradient containing 0.1% formic acid at a flow rate of 700 nL/min. The HPLC gradient consisted of a 20-min loading phase followed by a 60-min elution gradient. In these studies, the Orbitrap also was operated in the DDS mode; SE-1 was a high mass resolution scan (60,000 FWHM) of the precursor ions acquired in the Orbitrap, and the subsequent scan events SE-2 to SE-6 were low resolution product ion (MS/MS) mass spectra acquired in the LTQ analyzer from the five most abundant precursor ions identified in SE-1. Data were acquired using the Xcalibur 2.0 data acquisition system at a total cycle time of ∼2 s. High resolution isotopic spectra were computed using algorithms supplied by Thermo Scientific as part of the Xcalibur software (21).
RESULTS
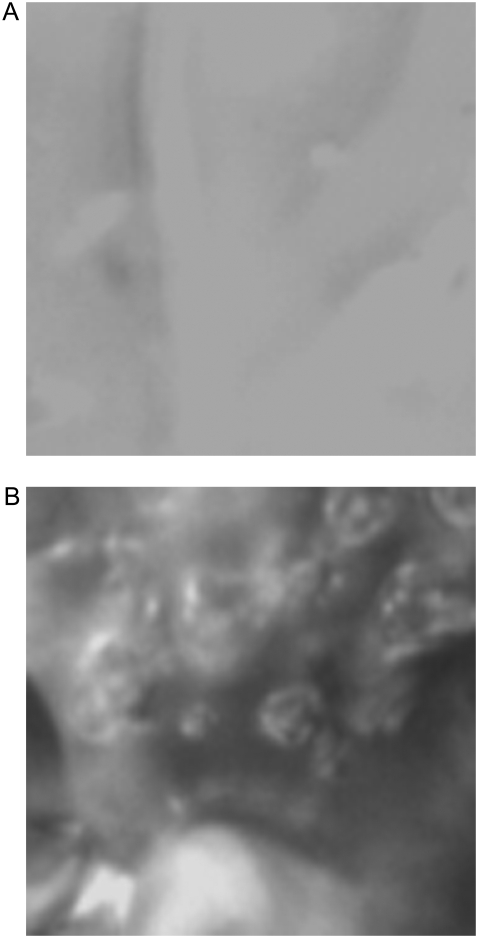
Fig. 1 shows a microscope image of fresh and ablated surfaces of the (Pro-Pro-Gly)10 single polycrystalline flake, demonstrating the significant damage of the ablated surface and changes of the flake shape. In the powder samples, which contained mechanically pressed flakes, the ablation had produced significant changes of the sample parameters, even after using relatively low energy FEL pulses (1–2 mJ or fluence Φ = 0.2–0.4 J/cm2). A decrease of the thickness and improvement of the sample uniformity after 4 × 4 mm or 9 × 9 mm raster ablations were observable visually. After ablation at higher energies (10–40 mJ or Φ = 2–20 J/cm2), the sample powder was converted into a compound having a gel-like appearance with yellow-brown color changes.
FIGURE 1.
Optical microscope images of (Pro-Pro-Gly)10 target surface (area size is 50 × 50 μm). (A) Nonablated and (B) ablated at amide II (6.45 μm). Sample color changed from white transparent to yellow/brown. At higher FEL fluencies, the crystals are converted to liquid/gel.
FTIR spectroscopy
Visual observations demonstrated that ablation was performed under severely unstable conditions during the FEL macropulse. By varying the FEL ablation energy, making repeated ablations on the same sample spots, and by following the FTIR spectrum, it was possible to divide the sample modification into two broad stages as follows:
Stage 1, achieved at low FEL fluence. After ablation at Φ = 0.2–0.4 J/cm2, the optical properties of the target samples were significantly changed. For example, the scattering in the powder samples was reduced, and the overall contrast of the FTIR absorption spectra was significantly improved. There were considerable changes in the broad spectra, including the amide I–III bands. These changes in the FTIR spectra remained stable over time. An increase of the FEL single macropulse fluence Φ or an integrated multiple macropulse fluence ΦΣ by at least a factor of 10 (multiple ablation raster passes on the same sample spots) produced an overall deterioration of the spectra, but without significant changes in the relative peak amplitudes. Such deterioration is typically observed after mechanical sample damage.
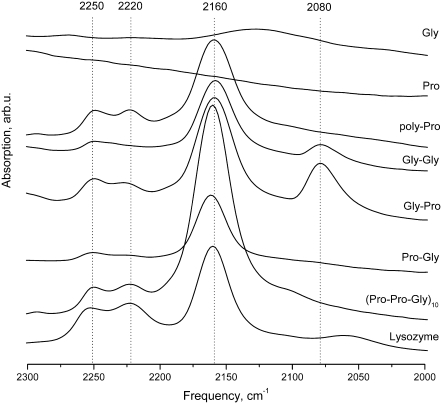
Stage 2, achieved at high FEL fluence. If the ablation of materials with the properties altered as described in stage 1 is continued, if the FEL energy is substantially increased, and if the amount of material is sufficient, then it is possible to observe additional spectral features. Several new IR peaks, located in the 2150–2250 cm−1 spectral band, were observed for these materials. The peaks were consistently detected in the ablated proteins, polypeptides, and dipeptides at the various FEL ablation wavelengths. The peaks were not detected for Gly or Pro single amino acid compounds.
The dynamic range of the spectrometer limited the ability to take comparable spectra before and after ablation, and to observe any new low intensity features in the ablation spectra. Therefore, different approaches were used to compare the IR spectra before and after ablation at stage 1 or 2. For the spectral comparison at stage 1, a reduced amount of material in the target was chosen to provide an optical density < 1.0 (typical thicknesses < 15 μm). Unfortunately, under such conditions, it was not possible to observe the new weak and/or transient peaks, mentioned below, that appear in stage 2. Preliminary kinetic spectral studies at stage 1 did not show decay processes over several days. Thus, we focused on the features observed in the stage 2 ablation studies.
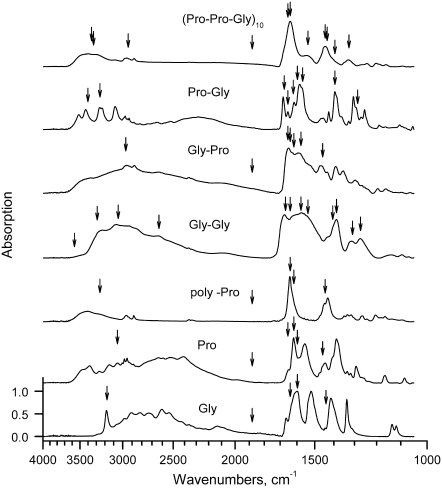
Because the sample parameters were stable and the modified sample material was sufficiently uniform to take IR spectra, a single-pass raster ablation at 0.2–0.4 J/cm2 was performed to reach stage 1. IR absorption spectra taken for the lyophilized powder samples after that stage are shown in Fig. 2, which shows a comparison of (Pro-Pro-Gly)10 model compounds to simpler powder compounds containing 1 or 2 Pro and Gly amino acids. Vertical arrows illustrate positions of the FEL ablation frequencies, which are predominantly tuned to the modes of molecular vibrations in the target compound.
FIGURE 2.
IR absorption spectra of the collagen-like polypeptides (Pro-Pro-Gly)10, (Pro-Hyp-Gly)10, and their components (dipeptides and single amino acids) after low energy ablation. Vertical arrows indicate FEL wavelengths, which were used for the ablation.
Assuming that the FEL-induced ablation is linearly proportional to the IR absorption, one can expect a significant difference in both the ablation process itself and any spectral changes associated with ablation by varying the FEL incident wavelength. For example, there is a greater absorption by a factor of ∼10 in the 1500–1600 cm−1 band relative to 1700–1800 band, which is off resonance, suggesting a comparable factor in FEL wavelength selectivity in ablation.
Our experiments, however, do not support that expectation, showing only a wavelength selective ratio of 2–3. It also follows that the single-pass ablation at Φ = 0.2–0.4 J/cm2 is sufficient to reach stage 1 within the studied wavelength range.
To achieve a transition from stage 1 to stage 2, the ablation was performed at 10–40 mJ or Φ = 2–20 J/cm2 per macropulse. Using multiple ablation passes over the same sample spots, accumulated fluencies of ΦΣ= 50–1000 J/cm2 were achieved. The IR absorption spectra, taken ∼40 s after ablation at stage 2, are shown in Fig. 3. The appearance of peaks at the 2250 and 2220 cm−1 was most consistent in different experiments and with different materials. Another peak at 2155–2161 cm−1 exhibited a strong decay and was only detected after short time delays between the ablation and the measurements. Unfortunately, our attempts to determine the ablation wavelength selectivity of the yield for the generation of peaks did not produce reliable results because of high variations in optical parameters among targets and across the target plane. The normalization of the spectra to the amide I peak was not reliable due to strong scattering in the samples. The estimated yields at the 3000 cm−1 or 1500–1600 cm−1 ablation bands is a factor of 2–3 higher than at 1700–1800 cm−1 bands. Attempts to study the yield dependence on water were not conclusive.
FIGURE 3.
Area of interest in the IR absorption spectra of studied compounds and lysozyme (for comparison), taken at 40 s after ablation.
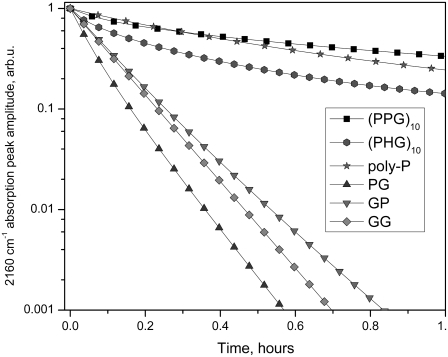
Spectral kinetic studies performed after ablation at the stage 2 showed that the amplitude of the 2220 cm−1 peak was stable for several days, whereas the amplitude of 2155–2161 cm−1 peak was significantly reduced over the same period. For the various compounds studied, a 1/e decay of the 2155–2161 cm−1 peak occurred over the time scale of minutes to hours. Kinetic curves in a semilogarithmic scale are displayed in Fig. 4. For each curve, the values of absorption were normalized against the absorption at zero time. The exponential decay for each compound was independent of the ablation wavelength. In contrast, significant differences were observed among the different compound compositions. For this comparison, experimental curves obtained from multiple trials and various FEL ablation wavelengths were averaged. The decay times were determined from a computer fit of the averaged curves for each compound. Table 1 shows the decay times t1, t2, and t3 derived from a 3-exponential fit of the averaged experimental curves as shown in the formula as follows:
 |
(1) |
where A is optical density, A0–A3 are optical densities produced by corresponding processes.
FIGURE 4.
Kinetic series of IR absorption spectra after ablation, showing decay of the 2160 cm−1 peak in (Pro-Pro-Gly)10, (Pro-Hyp-Gly)10, and their component dipeptides.
TABLE 1.
Average decay times of the 2160 cm−1 IR absorption peak in peptide fragments
| Compound | Decay time 1 (s) | Decay time 2 (s) | Decay time 3 (s) |
|---|---|---|---|
| (Pro-Pro-Gly)10 | 6.6 ± 1.3 | 52.8 ± 10.6 | 324.0 ± 64.8 |
| (Pro-Hyp-Gly)10 | 1.2 ± 0.2 | 5.4 ± 1.1 | 24.0 ± 4.8 |
| poly-L-[Pro] | 12.6 ± 2.5 | 39.0 ± 7.8 | |
| Pro-Gly | 4.2 ± 0.8 | ||
| Gly-Pro | 6.6 ± 1.3 | ||
| Gly-Gly | 6.0 ± 1.2 |
Analysis of peptide degradation products by tandem LC/MS
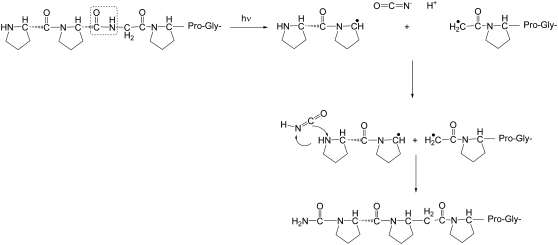
Identification of the intermediates and adducts is important for interpretation of the spectra and overall reaction scheme. Although the LC/MS methods are not generally suitable to show kinetics at the demonstrated timescales, they are applicable for the determination of the final reaction products and revealing the structures of intermediates to distinguish possible pathways. Finally, these methods allowed us to obtain necessary information about the generation of the intermediates, for example, shown in Fig. 5 and described below.
FIGURE 5.
Proposed model for formation of cyanate ions O=C=N(-) and isocyanic acid (O=C=N-H) in the FEL ablation by homolytic cleavage of a collagen-like polypeptide (Pro-Pro-Gly)10 at an internal glycine residue. The resultant peptidyl radicals can initiate further free radical reactions. The O=C=N(-) and O=C=N-H intermediates exhibit volatile and nonvolatile IR peaks, correspondingly.
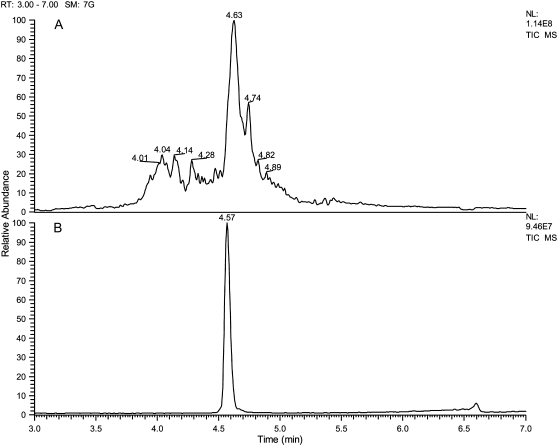
The degradation products from three samples of (Pro-Pro-Gly)10 were studied by LC/MS: 1), a sample irradiated at 2941 cm−1 (3.4 μm); 2), a sample irradiated at 1395 cm−1 (7.17 μm)—both FEL frequencies corresponded to C-H vibrational modes; and 3), the unirradiated (Pro-Pro-Gly)10 peptide. The top panel of Fig. 6 shows the total ion chromatogram of a low resolution survey scan, which was performed with the LTQ mass spectrometer, and illustrates the damage profile resulting from irradiation at 3.4 μm. Analysis of the precursor spectra in SE-1 shows an array of lower MW fragments at 3.5 to 4.4 min eluting before (Pro-Pro-Gly)10, followed by a cluster of higher MW adducts eluting near (Pro-Pro-Gly)10, and finally a broad cluster of ill-defined degradation products under the main peak. A separate sample of nonablated (Pro-Pro-Gly)10 was analyzed and is shown (bottom panel B) for reference.
FIGURE 6.
Total ion chromatograms: (A) (Pro-Pro-Gly)10 degradation products resulting from FEL irradiation at 3.4 μm; (B) original (Pro-Pro-Gly)10 peptide. These data were acquired in low mass resolution mode on an LTQ ion trap MS as described in Materials and Methods.
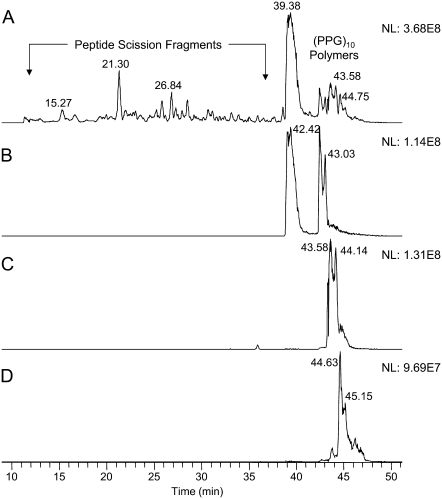
The complexity of the mix of irradiation-damaged products necessitated further studies using a slower chromatographic gradient to better separate the products in combination with high resolution mass spectrometry to provide accurate molecular weights for putative structures. Fig. 7 shows the profile of damage caused by laser irradiation at 7.17 μm (panel A) and the formation of cross-linked peptides consisting of three (Pro-Pro-Gly)10 chains and having up to two carbamyl adducts (panels B–D). Two adducts at mass/charge ratio (m/z) 1273.5 eluted at 43.58 min and 44.14 min (panel C). All of the peaks eluting earlier than (Pro-Pro-Gly)10 (39.38 min) resulted from scission of the peptide chain and were not further characterized for this article.
FIGURE 7.
(A) Base peak ion chromatogram of (Pro-Pro-Gly)10 degradation products resulting from irradiation at 7.17 μm. (B) Extracted ion profile of m/z 1266.15 for the cross-linked trimer (Pro-Pro-Gly)10 peptide with no carbamyl adducts. (C) Extracted ion profile of m/z 1273.30 for the molecule with one carbamyl adduct. (D) Extracted ion profile of m/z 1280.65 for the molecule with two carbamyl adducts. These data represent the multiply charged precursor ions (z = 6) acquired in high resolution mode (60,000 FWHM) using the Orbitrap MS. The presence of multiple chromatographic peaks for each cross-linked species indicates multiple sites of cross-link attachment.
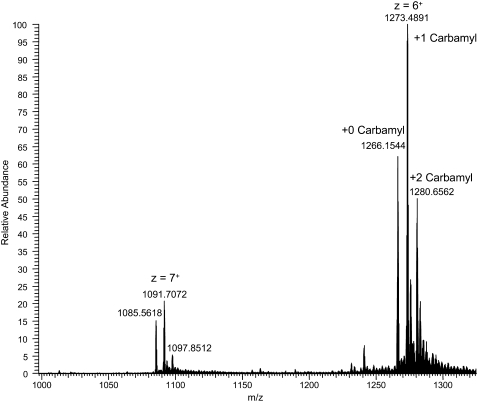
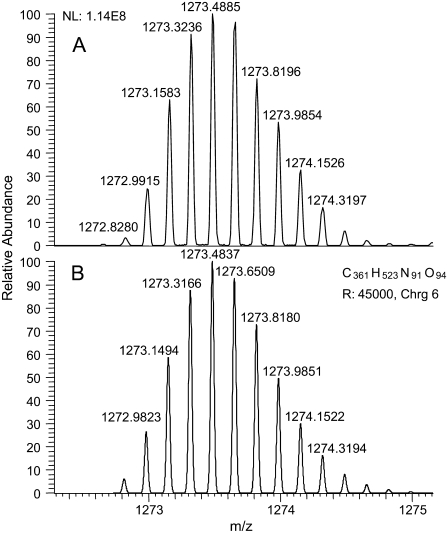
The high resolution MS (Figs. 8 and 9 A) showed this to be a high molecular mass (monoisotopic mass = 7,631.8514), highly charged (z = 6), cross-linked product formed from three (Pro-Pro-Gly)10 monomer units and a carbamyl adduct (+43). The theoretical isotopic composition corresponding to this structure (C361 H523 N91 O94) provides an exact match for the isotopic pattern (Fig. 9 B). The mass difference between the three cross-linked products was 43 and 86, corresponding to addition of one or two carbamyl adducts. Trimeric cross-linked products with 0, 1, and 2 carbamyl adducts were observed and characterized further by high resolution MS (Table 2). Tandem mass spectra were determined for the highly charged, high molecular weight peptides. However, they provided incomplete spectral coverage due to the mass range limitations of the LTQ instrument and were generally uninformative, showing mainly b- and y-series ions for sequential loss of Pro-Pro-Gly tripeptides. The nature of the chemical cross-link and the site of the carbamyl adduct could not be precisely determined. However, the presence of multiple chromatographic peaks suggests that scission and cross-linking occurs at several locations. The high molecular weight N-carbamyl-(Pro-Pro-Gly)10 cross-linked adducts were present in all irradiated (Pro-Pro-Gly)10 samples that we have examined thus far. We are working to identify other degradation products resulting from scission of the peptide chain, and we plan to report our results in a separate article.
FIGURE 8.
Signal averaged precursor spectrum (t = 42.2–45.3 min) for the various carbamyl adducts. These data were acquired in high resolution mode with the Orbitrap MS and show both the more dominant +6 charge state and the weaker +7 charge state. The mass range of the instrument was not set to identify lower charge state ions (z < 6) at higher m/z values.
FIGURE 9.
(A) High resolution mass spectrum of the z = +6 ion corresponding to the N-carbamyl-(Pro-Pro-Gly)10 cross-linked product [3(Pro-Pro-Gly)10 + 1 carbamyl + 6H+]6+. (B) Theoretical isotopic distribution corresponding to the carbamyl adduct with the molecular formula (C361 H523 N91 O94) for the cross-linked adduct. The monoisotopic mass of the most abundant isotopic peak (m/z 1273.4885) was nearly identical to that calculated (m/z 1273.4837) for the predicted isotopomer spectrum to within 3.77 ppm. The observed isotopic distribution pattern is essentially identical to the theoretical spectrum. The monoisotopic mass (z = 1) of this adduct is 7631.8545.
TABLE 2.
Accurate monoisotopic mass determination of carbamyl adducts (n = 0 to 2) of the (Pro-Pro-Gly)10 cross-linked trimer
| n | Formula | Calculated monoisotopic m/z (z = 6) | Observed m/z* | Calculated m/z | Error (ppm) |
|---|---|---|---|---|---|
| 0 | C360 H522 N90 O93 | 1265.6475 | 1266.1540 | 1266.1490 | +3.95 |
| 1 | C361 H523 N91 O94 | 1272.8152 | 1273.4885 | 1273.4837 | +3.77 |
| 2 | C362 H524 N92 O95 | 1279.9828 | 1280.6560 | 1280.6514 | +3.59 |
The accuracy of the observed m/z values was determined on the major isotopic peak of the +6 charge state in the spectrum rather than the low abundance monoisotopic mass to obtain a better estimate of the measurement error.
DISCUSSION
To achieve a wavelength selective laser scission of an original undamaged protein molecule, a laser photon energy equal to the energy of dissociation of the molecular backbone must be provided. The lowest energy of dissociation for that purpose is for the C-N peptide bonds (3 eV) and for the C-C backbone bonds (3.6 eV) (22). Therefore, only nonlinear, multiphoton absorption processes are possible for bond scission at mid-IR FEL wavelengths (0.15–0.45 eV). The ultrashort (1–3 ps) duration of the FEL micropulses suggests that such nonlinear regimes could possibly be reached. In our experiments, however, the average power densities are only 200–600 MW/cm2 for each micropulse (30 mJ per macropulse comprising 104 micropulses in the focal spot area 5 × 10⁻³ cm2). Such power densities are close but not sufficient to provide conditions for direct multiphoton absorption (also called “vibrational ladder climbing”) (23). Depending on the lifetime of the excited states of the vibrational modes, a multistage process, called a “vibrational ladder switching”, that includes several transitional states must be considered (24). The values of lifetimes of the excited states in proteins are typically ∼1 ps, close to the micropulse duration. Relaxation of this state can result in “energy leaks”, whereby the vibrational energy is transferred to the other vibrational modes, generating heat of 4–5 kcal/mol per absorbed photon. The heat is dissipated at a slower rate in the surrounding sample volume and optical cell walls, based on a thermal confinement time of ∼10–20 ns (25).
Considering the time structure of the FEL macropulse, which has a micropulse repetition period of 0.3 ns, the heat is accumulated in the ablation zone. With sufficient irradiation, this amount of heat can reach the threshold of molecular damage and pyrolysis. As a result, optical parameters of the protein-rich medium are significantly altered after the first several FEL micropulses (26). This means that, during the remainder of the macropulse, ablation is performed under significantly altered conditions, including absorption and reflection of the FEL wavelength, vibrational excitation of the protein molecules, and modified thermal properties of the sample. Recognition of this sequence provides a path for a more complete model of the experimental data. For these experiments, we introduced a two-stage process model based on the IR absorption data obtained from samples ablated at various FEL fluencies. The fluence per macropulse required to achieve stage 1 was ∼10-fold smaller than the fluence necessary to reach stage 2. In our experiments, stage 1 was potentially reached after the first 10% of the macropulse duration. Accordingly, the residual 90% of the macropulse fluence was absorbed in material having significantly altered optical and thermal properties and, consequently, exhibited a different FEL fluence dependence. In this two-stage model, however, we did not consider dynamic optical properties of the ablated material.
From the analysis of the 2000–2300 cm−1 spectral band, the peak positions and relative amplitudes are in approximate agreement with previously published data, which were obtained for a cornea (2). The position of the 2220 cm−1 peak is in agreement with the position of the 2218 cm−1 peak in the article by Xiao et al. (2). The 2250 cm−1 peak, which has a position that is stable and repeatable for all compounds, is in agreement with a Raman band shown in the cornea at 2248 cm−1 (2) but not with the IR band reported at 2273 cm−1. The 23 cm−1 shift may be due to a different composition of the cornea compared with the model compounds used in our experiments. The 2250 and 2220 cm−1 peaks are typically assigned to the C≡N bond stretch mode as characteristic peaks for cyano components and to the C=O bond stretch mode in O=C=N group in isocyanates (isonitriles) (27). For example, isocyanic acid O=C=N-H shows a strong peak at 2248 cm−1.
The 2155–2161 cm−1 peak is typically assigned to the stretch of a triple C≡C bond in alkynes (28) or cumulative double bonds in ketenes. The peak exhibits a very strong and characteristic IR band in the region of 2100 cm−1, arising from the antisymmetric stretch of the C=C=O moiety (29).
In contrast, isocyanides (R-N=C) are better candidates because they generally show absorptions ∼100 cm−1 lower in frequency compared to their cyanide isomers mentioned earlier (30), which are present in our data. Interestingly, similar peaks have been observed in astrophysics, where the suspected molecules have been suggestively labeled “XCN”. After more than a decade of model laboratory experiments, it was finally confirmed that the peak corresponds to the cyanate ion O=C=N(−) (31,32), showing extremely strong absorption in the 2200–2100 cm−1 region.
The relative intensity of the 2160 cm−1 peak reported by Xiao et al. (2) is significantly lower than that of the 2218 and 2273 cm−1 peaks. This can be explained by the fact that the intensity of the 2160 cm−1 peak is a strong function of the time delay from ablation to observation, thus creating uncertainty in comparisons made where this parameter is not specified. The time delay is 40 s in our experiments; unfortunately, however, it is not disclosed in the article by Xiao et al. (2), which creates uncertainty in their conclusions about the ablation wavelength selectivity.
The exponential character of 2155–-2161 cm−1 peak decay kinetics is a demonstration of first-order chemical reactivity. This is a signature of a simple dissociation and an unlimited available reagent amount in the surrounding media.
As shown in Table 1, the decay of the 2160 cm−1 peak in the Gly-Gly is 2 orders of magnitude faster than in (Pro-Pro-Gly)10 compound. In addition, the (Pro-Pro-Gly)10, (Pro-Hyp-Gly)10, and poly-L-(Pro) exhibit several decay constants. A partial explanation for this is the length of the ablated molecule, which allows multiple fragments. Large and heavier fragments have lower mobility for reaction. Also the N-terminus of the longer molecule is located at a longer distance from the place where radicals or intermediates are generated (Fig. 5), which is also a factor influencing the reaction.
Based on the generation of the peaks and their decay, one could consider two-step chemical processes during laser ablation in stage 2. The first step is a generation of intermediates, which is followed by a second step—subsequent reaction of the intermediates with the residual material. The existence of the new IR peaks for peptides, having only two or more amino acids, indicates that the peptide bond is an initial prerequisite to produce the intermediates, having the detected spectral fragments. The C-N peptide bonds in peptide molecules have the lowest energy of dissociation (3 eV) compared to the C-C backbone bonds (3.6 eV) and, therefore, are the first candidates for the wavelength selective laser scission (22). In fact, the cleavage is achieved at the proline carbonyl and glycyl amine bonds almost simultaneously, as indicated by our data.
We have used the MS data to identify the final products of the reaction and to recognize possible pathways leading from stage 1 to the stage 2. The volatile IR peaks show two main candidates: ketenes and isocyanates.
Ketenes are extremely important reactive species, which occur as transients in numerous thermal and photochemical reactions (29). Generation of ketenes in vacuum during peptide cleavage has been detected in several studies using MS (33). This reactive intermediate is readily attacked by nucleophiles to form a new amide linkage (5), therefore producing a decay of an amplitude of the IR band at 2155–2160 cm−1. A result of ketene reaction as an acetylating agent is the formation of an N-terminal acetylated form. For (Pro-Pro-Gly)10 the MS data, taken initially at low resolution, showed potentially the signatures of such an acetylated form. Unfortunately, the difference in molecular mass between an acetyl group and a carbamyl group is only 1 Da, which is indistinguishable using a low resolution mass spectrometer to analyze a multiply charged ion. The high resolution MS data clearly resolves this ambiguity in favor of a carbamyl adduct rather than an acetyl adduct as originally proposed. The high resolution MS data showed evidence of several N-carbamyl-(Pro-Pro-Gly)10 products in all ablated (Pro-Pro-Gly)10 powders, which is a signature of existence of cyanic short-chain reactive intermediates, such as isocyanic acid (tautomeric form: H-N=C=O) or cyanate ions O=C=N(-). These reagents (Fig. 5) are most likely derived from glycyl residues that are cleaved during the scission of the full-length peptide. To be consistent with the IR spectroscopy kinetic data, we have to allow that the cyanate ions are the primary species generated. In this case, if the ions are converted to the isocyanic acid, the kinetics will show the growth of the 2248 cm−1 IR peaks, which has not been observed. This leads to the conclusion that ions react with the residual peptide directly or using isocyanic acid as a short-lived intermediate.
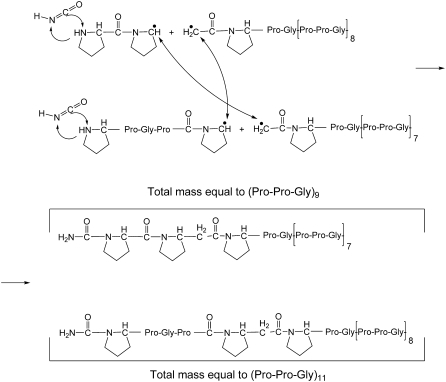
In the proposed mechanism, scission of the proline carbonyl and glycyl amine produces cyanate ions, thus acting as a very reactive reagent toward amino groups and two free radicals on adjacent proline residues. These radicals can participate in a range of free radical-initiated chemical reactions at peptide bonds (34). A schematic for the generation of molecules with masses equal to (Pro-Pro-Gly)11 and (Pro-Pro-Gly)9 from two initially cleaved and then cross-linked molecules (Pro-Pro-Gly)10 is shown in Fig. 10. The triple helical structure of (Pro-Pro-Gly)10 is consistent with our observation of cross-linked trimers of (Pro-Pro-Gly)10; only traces of cross-linked dimers were seen, and the levels were too low to permit further characterization. (Pro-Pro-Gly)10 (and collagen) are known to be susceptible to free radical-initiated cross-linking, but the chemical structures are poorly understood (35).
FIGURE 10.
Proposed model for formation of cross-links between collagen-like polypeptide (Pro-Pro-Gly)10 molecules by free radical reactions among FEL-generated resultant peptidyl radicals.
In addition to formation of cross-links, the peptide backbone is susceptible to cleavage to form shorter products. Several classes of short chain products were seen, including simple peptide hydrolytic products and N-carbamyl adducts. We are working to identify these products, and we plan to report our results in a separate article.
In our experiments, the minimal time delay between spectral analysis and ablation was 40 s. The corresponding peaks for the intermediates were not observed in hydrated samples, possibly because of their very short decay times.
The spectral kinetic studies presented in this article are a starting point for more sophisticated models of laser ablation, especially through extended application of biological tissue ablation modeling. The intermediate species potentially may react with nucleophilic sites in collagen molecules and create cross-links, thus preserving the tissue from a significant collateral damage. With the results of this kinetic study, the combined action of multiple pathways can be tested, including generation of different intermediates and multistep reaction processes. Furthermore, a detailed understanding of the production of cross-linking intermediates will play an important role in the development of laser tissue welding or laser surgery protocols.
Acknowledgments
We are grateful to the personnel at the Vanderbilt University FEL Center for assistance with FEL operation and to Ms. Kristin Cheek in the Mass Spectrometry Research Center for high resolution MS analysis. We are grateful to G. Edwards and S. Hutson for discussions and to N. Porter for proposing ideas for several reaction schemes.
This work was supported by the Department of Defense Medical Free-Electron Laser Program (FA9550-04-1-0045 and F49620-00-1-0370) and by National Science Foundation/Human Resource Development (grant No. 0420516, the Center of Research Excellence in Science and Technology).
Editor: Janos K. Lanyi.
References
- 1.Edwards, G., R. Logan, M. Copeland, L. Reinischt, J. Davidson, B. Johnson, R. Maciunass, M. Mendenhall, R. Ossoff, J. Tribble, J. Werkhaven, and D. O'Day. 1994. Tissue ablation by a free-electron laser tuned to the amide II band. Nature. 29:416–419. [DOI] [PubMed] [Google Scholar]
- 2.Xiao, Y., M. Guo, K. Parker, and M. S. Hutson. 2006. Wavelength-dependent collagen fragmentation during mid-IR laser ablation. Biophys. J. 91:1424–1432. [DOI] [PMC free article] [PubMed] [Google Scholar]
- 3.Zavalin, A., D. L. Hachey, M. Sundaramoorthy, S. Banerjee, S. Morgan, L. Feldman, N. Tolk, and D. W. Piston. 2006. “Self-healing” and other dynamic processes in FEL-ablated proteins. Vanderbilt University Mid-IR Ablation and Condensed Matter and Optics Seminars. Available at: http://www.vanderbilt.edu/physics/ocm/.
- 4.Edwards, G. S., S. J. Allen, R. F. Haglund, R. J. Nemanich, B. Redlich, J. D. Simon, and W.-C. Yang. 2005. Applications of free-electron lasers in the biological and material sciences. Photochem. Photobiol. 81:711–735. [DOI] [PubMed] [Google Scholar]
- 5.Givens, R. S., G. T. Timberlake, P. G. Conrad, A. L. Yousef, J. F. Weber, and S. Amslinger. 2003. A photoactivated diazopyruvoyl cross-linking agent for bonding tissue containing type-I collagen. Photochem. Photobiol. 78:23–29. [DOI] [PubMed] [Google Scholar]
- 6.Jastrzebska, M., R. Wrzalik, A. Kocot, J. Zalewska-Rejdak, and B. Cwalina. 2003. Raman spectroscopic study of glutaraldehyde-stabilized collagen and pericardium tissue. J. Biomater. Sci. Polym. Ed. 14:185–197. [DOI] [PubMed] [Google Scholar]
- 7.Hara, M. 2006. Various cross-linking methods for collagens: merit and demerit of methods by radiation. J. Oral Tissue Eng. 3:118–124. [Google Scholar]
- 8.Chan, B. P., and K.-F. So. 2005. Photochemical crosslinking improves the physicochemical properties of collagen scaffolds. J. Biomed. Mater. Res. 75A:689–701. [DOI] [PubMed] [Google Scholar]
- 9.Small, W., N. J. Heredia, D. J. Maitland, D. C. Eder, P. M. Celliers, L. B. D. Silva, R. A. London, and D. L. Matthews. 1998. Experimental and computational laser tissue welding using a protein patch. J. Biomed. Opt. 3:96–101. [DOI] [PubMed] [Google Scholar]
- 10.Diem, M., R. S. Bhatnagar, M. E. Druyan, and V. Renugopalakrishnan. 1984. Solution-phase Raman-spectroscopic studies on synthetic collagen analogs: prolyl-prolyl-glycine and (prolyl-prolyl-glycine)10. Biopolymers. 23:2955–2961. [DOI] [PubMed] [Google Scholar]
- 11.Renugopalakrishnan, V., T. W. Collette, L. A. Carreira, and R. S. Bhatnagar. 1985. Low-frequency Raman spectra as a conformational probe for polypeptides and proteins. Macromolecules. 18:1786–1788. [Google Scholar]
- 12.Kramer, R. Z., L. Vitagliano, J. Bella, R. Berisio, L. Mazzarella, B. Brodsky, A. Zagari, and H. M. Berman. 1998. X-ray crystallographic determination of a collagen-like peptide with the repeating sequence (Pro-Pro-Gly). J. Mol. Biol. 280:623–638. [DOI] [PubMed] [Google Scholar]
- 13.Okuyama, K., C. Hongo, R. Fukushima, G. Wu, H. Narita, K. Noguchi, Y. Tanaka, and N. Nishino. 2004. Crystal structures of collagen model peptides with Pro-Hyp-Gly repeating sequence at 1.26 Å resolution: implications for proline ring puckering. Biopolymers. 76:367–377 (Peptide Science). [DOI] [PubMed] [Google Scholar]
- 14.Nishi, Y., S. Uchiyama, M. Doi, Y. Nishiuchi, T. Nakazawa, T. Ohkubo, and Y. Kobayashi. 2005. Different effects of 4-hydroxyproline and 4-fluoroproline on the stability of collagen triple helix. Biochemistry. 44:6034–6042. [DOI] [PubMed] [Google Scholar]
- 15.Reinisch, L., M. H. Mendenhall, S. Charous, and R. H. Ossoff. 1994. Computer-assisted surgical techniques using the Vanderbilt Free-Electron Laser. Laryngoscope. 104:1323–1329. [DOI] [PubMed] [Google Scholar]
- 16.Yates, J. R. 2004. Mass spectral analysis in proteomics. Annu. Rev. Biophys. Biomol. Struct. 33:297–316. [DOI] [PubMed] [Google Scholar]
- 17.Mann, M., R. C. Hendrickson, and A. Pandey. 2001. Analysis of proteins and proteomes by mass spectrometry. Annu. Rev. Biochem. 70:437–473. [DOI] [PubMed] [Google Scholar]
- 18.Hansen, B. T., S. W. Davey, A. J. Ham, and D. C. Liebler. 2005. P-Mod: an algorithm and software to map modifications to peptide sequences using tandem MS data. J. Proteome Res. 4:358–368. [DOI] [PubMed] [Google Scholar]
- 19.Hu, Q., R. J. Noll, H. Li, A. Makarov, M. Hardman, and R. G. Cooks. 2005. The Orbitrap: a new mass spectrometer. J. Mass Spectrom. 40:430–443. [DOI] [PubMed] [Google Scholar]
- 20.Yates, J. R., D. Cociorva, L. Liao, and V. Zabrouskov. 2006. Performance of a linear ion trap-Orbitrap hybrid for peptide analysis. Anal. Chem. 78:493–500. [DOI] [PubMed] [Google Scholar]
- 21.Senko, M. W., S. C. Beu, and F. W. McLafferty. 1995. Determination of monoisotopic masses and ion populations for large biomolecules from resolved isotopic distributions. J. Am. Soc. Mass Spectrom. 6:229–233. [DOI] [PubMed] [Google Scholar]
- 22.Levchik, S. V., E. D. Weil, and M. Lewin. 1999. Thermal decomposition of aliphatic nylons. Polym. Int. 48:532–557. [Google Scholar]
- 23.Schwendner, P., C. Beck, and R. Schinke. 1998. Ladder climbing and multiphoton dissociation of polyatomic molecules excited with short pulses: basic theory and applications to HCO. Phys. Rev. A. 58:2203–2213. [Google Scholar]
- 24.Vorsa, V., T. Kono, K. F. Willey, and N. Winograd. 1999. Femtosecond photoionization of ion beam desorbed aliphatic and aromatic amino acids: fragmentation via α-cleavage reactions. J. Phys. Chem. B. 103:7889–7895. [Google Scholar]
- 25.Hutson, M. S., S. A. Hauger, and G. Edwards. 2002. Thermal diffusion and chemical kinetics in laminar biomaterial due to heating by a free-electron laser. Phys. Rev. E Stat. Nonlin. Soft Matter Phys. 65:061906–061912. [DOI] [PubMed] [Google Scholar]
- 26.Tribble, J., D. C. Lamb, L. Reinisch, and G. Edwards. 1997. Dynamics of gelatin ablation due to free-electron-laser irradiation. Phys. Rev. E Stat. Phys. Plasmas Fluids Relat. Interdiscip. Topics. 55:7385–7389. [Google Scholar]
- 27.Bernstein, M. P., S. A. Sandford, and L. J. Allamandola. 1997. The infrared spectra of nitriles and related compounds frozen in Ar and H2O. Astrophys. J. 476:932–942. [DOI] [PubMed] [Google Scholar]
- 28.Nyquist, R. A. 2001. Interpreting Infrared, Raman, and Nuclear Magnetic Resonance Spectra. Academic Press, London.
- 29.Tidwell, T. T. 2006. Ketenes, 2nd ed. Wiley, Hoboken, NJ.
- 30.Nyquist, R. A. 1988. IR and/or NMR spectra-structure correlations for organonitrogen-containing compounds. Appl. Spectrosc. 42:624–634. [Google Scholar]
- 31.Grim, R. J. A., and J. M. Greenberg. 1987. Ions in grain mantles—the 4.62 micron absorption by OCN(−) in W33A. Astrophys. J. 321:L91–L96. [Google Scholar]
- 32.Novozamsky, J. H., W. A. Schutte, and J. V. Keane. 2001. Further evidence for the assignment of the XCN band in astrophysical ice analogs to OCN(−): spectroscopy and deuterium shift. Astron. Astrophys. 379:588–591. [Google Scholar]
- 33.Harrison, A. G., and A. B. Young. 2005. Fragmentation reactions of deprotonated peptides containing proline. The proline effect. J. Mass Spectrom. 40:1173–1186. [DOI] [PubMed] [Google Scholar]
- 34.Masterson, D. S., H. Yin, A. Chacon, D. L. Hachey, J. L. Norris, and N. A. Porter. 2004. Lysine peroxycarbamates: free radical-promoted peptide cleavage. J. Am. Chem. Soc. 126:720–721. [DOI] [PubMed] [Google Scholar]
- 35.Miles, C. A., A. Sionkowska, S. L. Hulin, T. J. Sims, N. C. Avery, and A. J. Bailey. 2000. Identification of an intermediate state in the helix-coil degradation of collagen by ultraviolet light. J. Biol. Chem. 275:33014–33020. [DOI] [PubMed] [Google Scholar]


