Abstract
Molecular dynamics simulations of aquaporin-1 embedded in a solvated lipid bilayer were carried out to investigate the mechanism of water permeation. The 2.2 Å resolution crystal structure of the bovine protein was used for five independent trajectories. During the equilibration and preparatory steps in which the protein was held fixed, water molecules inside the water channel adopted the same positions as observed in the crystal structure but they did not pass through the channel, suggesting that the dynamic motion of the protein is critical for water permeation. When the protein atoms were allowed to move, the side chains of the two asparagines in the two conserved Asn-Pro-Ala motifs near the center of the channel formed hydrogen bonds with water and helped water molecules move through the channel by actively aligning them for transport. The main-chain oxygen atoms, which were exposed to the pore surface in the crystal structure, also contributed to water transfer. Besides the constriction region observed in the crystal structure (Arg197, Phe58, His182, and Cys191), we found that His76 and Val155 act as a valve by dynamically blocking water permeation and helping control flow.
INTRODUCTION
The aquaporins are a family of integral membrane proteins that control the movement of water molecules across lipid membranes (1–5). They are widely distributed in various organs in the human body, such as kidney, eye, and the brain. Disruption of the function of aquaporins can cause diseases such as diabetes insipidus, congenital cataracts, and hearing impairment (6). At least 10 different aquaporins have been identified and sequenced from humans. In addition to water transport, some of these aquaporins also transport glycerol and urea (5,7,8). All aquaporins select against the transport of ions, particularly hydronium ion, and in this way they maintain membrane potentials and intracellular pH. The disease linkages, rapid permeation rate of ∼1–2 waters per nanosecond per aquaporin molecule, and the strict selectivity for water make this family of proteins very interesting (9–11).
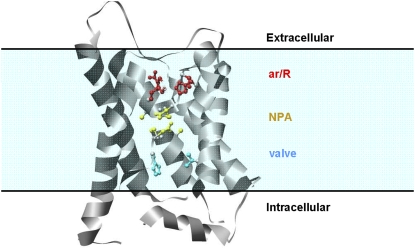
Sequence analysis of the aquaporin family shows high homology among its members (11). The aquaporins possess an NPA (Asn-Pro-Ala) motif that appears twice in the sequence (11). The sequence can be divided in half with one motif per half. The sequence identity (28–49%) (12) suggests some structural similarity. The structures of several aquaporins, at a range of resolutions, have been solved using membrane crystals purified from red blood cells (13–18). The four available aquaporin-1 structures have six transmembrane helices in addition to two shorter helices (13,14,19,20). The NPA motifs, critical for transport, are located near the N-termini of the short helices, which lie roughly perpendicular to the plane of the membrane and approximately in the middle of the membrane-spanning region (Fig. 1). The crystal structures provide insight into the structural details of the water pore, and, in concert, with the high water permeation rate (9,10) they provide a solid basis for using molecular dynamics (MD) simulations to study the permeation processes in “real time”.
FIGURE 1.
Schematic view of aquaporin-1 monomer in the lipid bilayer. Residues lining the pore are shown in the ball and stick representation: the arginine motif ar/R (red), the NPA motifs (yellow), and valve H76 and V155 (blue).
The Schulten group has carried out several simulation studies of both human aquaporin-1 and the related Escherichia coli aquaglyceroporin GlpF (21–25) (with 3.80 and 2.20 Å resolution, respectively). Their studies suggest that the two conserved asparagines in the NPA motif force a central water molecule to serve as a hydrogen bond donor to its neighboring water molecules. In addition, waters inside the channel form hydrogen bonding networks of opposite orientations inside the two halves of the channel. They suggested that this water network arrangement prevents the formation of a “proton wire” (26) and consequently permeation of protons, while still allowing rapid diffusion of water through the channel (24).
On the other hand, de Groot and Grubmuller observed discontinuous water networks in the channel during simulations of the same proteins (27). They proposed a two-stage filtering mechanism whereby the NPA motif forms a selectivity-determining region and another region composed of aromatics and an arginine motif (ar/R) functions as a proton filter (Fig. 1) (27). The different observations and implications of these two studies, as well as the subtle differences in the channel structures of the aquaporin family members, provide the impetus for further study.
The MD studies discussed above began with low-resolution electron microscopy (EM) structures. However, more recently there have been several simulation studies (up to 5 ns long) beginning with the 2.2 Å resolution x-ray crystal structure of bovine aquaporin-1 (19,28–31). De Groot et al. (28) compared the EM and crystal structures of aquaporin-1 and found them to be very similar. The dynamics and energetics of water permeation through the bovine aquaporin-1 monomer embedded in a water/n-octane/water bilayer were studied in 3 ns MD simulation run by Vidossich et al. (29) These authors calculated the free energy profile associated with water permeation and the electrostatic field along the channel axis. Schulten et al. (30) studied the pressure-induced water permeation in the bovine aquaporin-1 tetramer embedded in a palmitoyl-oleoyl-phosphatidyl-ethanolamine (POPE) lipid bilayer. Recently, Han et al. (31), using 3 ns MD simulation run, compared free energies and rates of water permeation in the bovine aquaporin-1 tetramer embedded in a POPE lipid bilayer.
Here we carry out multiple, longer MD simulations starting from the 2.2 Å resolution crystal structure of bovine aquaporin-1 (19) in a solvated palmitoyl-oleoyl-phosphatidyl-choline (POPC) lipid bilayer. The constriction region, believed to be responsible for selectivity, in this structure is much narrower than that of glycerol facilitator GlpF (21). Sui et al. (19) suggest that the narrow hydrophobic pore prevents the formation of significant hydrogen bonding networks of water molecules inside the channel. This high-resolution structure provides the ability to analyze the transport mechanism of water and to investigate whether a hydrogen bond network forms. In addition, it also enables a more detailed characterization of side-chain conformations of residues that line the pore. Such characterization is essential if we are to understand the relationship between pore function and structure and whether dynamics play a role.
METHODS
System preparation
Aquaporin-1 forms a homotetrameric assembly in lipid membranes, but previous experimental and simulation studies indicate that each monomer is a functional channel whereas the pore central to the tetramer is not (12,17,18,21–24,27,29,32–35). Therefore, we used one monomer of aquaporin-1 rather than its tetrameric form for our MD simulations. The crystal structure of monomeric bovine aquaporin-1 (19) (1j4n) was obtained from the Protein Data Bank (PDB) (36) with PDB code 1J4N (19). Hydrogen atoms were added to the monomer with the ENCAD software program (37).
The protein was then placed into a POPC lipid bilayer consisting of 200 lipids, built in the Schulten group (38). The locations of tyrosine residues (24), in conjunction with the position of solvent molecules in the crystal structure (19), were used to adjust the position of the membrane relative to the protein. The membrane thickness, measured as the average phosphorus-phosphorus distance, was set to 33.2 Å. Lipids overlapping with the protein were identified via visual inspection in MIDAS (39) and they were removed. This yielded a system with 165 POPC molecules (83 in the upper layer and 82 in the lower layer).
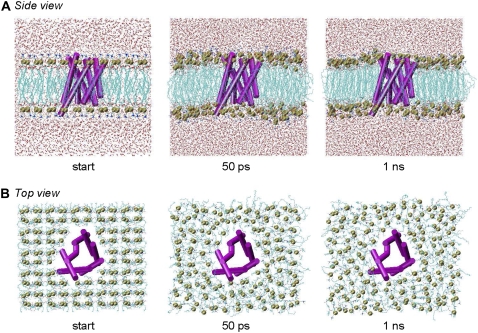
The resulting protein/bilayer system was solvated using the in lucem Molecular Mechanics (ilmm) (40) software program. Flexible F3C waters (41) were added to a distance of 15 Å extending in all directions from the protein. No waters were placed closer than 1.8 Å to any protein or lipid atom. Water molecules were placed both within and outside of the membrane if there was adequate space, and the system density was set to 0.997 g/ml, the experimental value for water at 298 K (42). In several previous simulations, water molecules inside the hydrophobic portion of the membrane were removed (21–24). In test systems, the water molecules inside this hydrophobic portion quickly (sub 50 ps timescale) moved out and joined bulk water (Fig. 2). The total system size was 70,008 atoms, with 3,764 protein atoms, 165 POPC molecules, and 15,378 water molecules. The dimensions of the system were 94.3 × 95.0 × 79.7 Å.
FIGURE 2.
Side and top view of aquaporin-1 MD systems during equilibration period. During the preparation/equilibration runs, the protein atoms were held fixed. The protein is shown from the (A) side and (B) top in cartoon representation, colored in magenta. The POPC lipid phosphorus atoms are depicted with van der Waals spheres in yellow. Water oxygens are similarly displayed in red. Hydrogens included in the simulations are omitted for clarity.
The MD simulations were prepared and carried out with ilmm (40). The Levitt et al. (37) force field and parameter set were used. For all bonds, angles, and dihedral angles in POPC molecules the parameters of the Levitt et al. (37) force field were used with the additional parameters in Table 1. The histidine residues were protonated in the δ position. To complete preparation of the system for simulation, the water potential energy was minimized with steepest descent energy minimization for 200 steps, the protein alone was minimized for 200 steps, and then the protein and water were minimized for another 200 steps. A second trajectory was generated using a similar protocol differing only in that 500 steps of each minimization set were carried out rather than 200. These two simulations are referred to as MD1 and MD2. Post minimization, these two systems were treated identically and 4 ns simulation were carried out. Three additional simulations were carried out for 10 ns each, postequilibration: MD3, MD4, and MD5. In these cases nonbonded interactions between atoms in charge groups separated by three bonds were included and scaled by 0.4; these interactions were not included for MD1 and MD2. The results were independent of whether these interactions were included or not. When we began this study we did not include this term. We modified our force field and now we use this scaling factor for all simulations. We have checked hundreds of proteins and less than 12 of them were affected by change but showed improved behavior. Our new protocol for all simulations is to use the scaling factor 0.4.
TABLE 1.
Additions to our force field for POPC lipids: bond, angle, and torsion angle parameters for carbon-to-carbon double bond in the hydrocarbon chain; angle parameters for cases when N or O is the middle atom; atomic partial charges for charge groups
| Code/group | Kb (kcal/mol · Å2) | Kθ (kcal/mol · rad2) | b0 (Å) | θ0 (°) |
|---|---|---|---|---|
| Bond code | ||||
| A′-A′ | 250 | – | 1.340 | – |
| Angle code | ||||
| C-A′-H | – | 60 | – | 121.00 |
| C-A′-A′ | – | 60 | – | 121.00 |
| C-N-C | – | 60 | – | 119.50 |
| C-O2-C | – | 60 | – | 120.00 |
| Kφ (kcal/mol · rad2) | N | ϕ0 (°) | ||
| Torsion code | ||||
| C-A′-A′-C | 40 | 1 | 0 | |
| H-A′-A′-H | 40 | 1 | 0 | |
| H-A′-A′-C | 40 | 1 | 180 | |
| Charge group | Charge (in electron units, e) | |||
| q1 | q2 | q3 | q4 | |
| CHHH | −0.257 | 0.119 | 0.119 | 0.119 |
| POO | 0.550 | −0.775 | −0.775 | – |
| N | 0.7 | – | – | – |
| O | 0.0 | – | – | – |
We used the same atom codes as in our original force field paper (37).
After the preparatory minimization steps, the systems were heated to 298 K as described elsewhere (43). The average temperature during production runs was 298 ± 6 K. The microcanonical ensemble was used with a 2 fs time step. The list of nonbonded interaction partners was updated every three steps and a 10 Å nonbonded cutoff range was used. Periodic boundary conditions and a force-shifted spherical cutoff treatment were used (40). Previous studies have shown that our nonbonded treatment is efficient, conserves energy and provides better agreement with experiment than Ewald methods (44). The starting structure from MD1 run was used as the starting configuration for the equilibration run of MD5. During the first nanosecond of simulation time, which was used to equilibrate the membrane and water, the protein atoms were held fixed. After this time, 4 or 10 ns of production all-atom molecular dynamics were conducted in which all atoms were allowed to move. Structures were saved at 0.2 ps granularity for analyses, yielding 5,000 and 20,000 structures for the equilibration and production runs, respectively for both MD1 and MD2. The equilibrated structures from MD1 and MD2 runs were used as starting configurations for the production runs of MD3 and MD4, respectively. Structures were saved every ps for the MD3–MD5 production runs, yielding 10,000 configurations for each.
RESULTS AND DISCUSSION
Lipid-water equilibration runs
In the equilibration runs, we first constructed a protein/lipid complex then solvated it by adding water (Fig. 2). There were a small number of waters falling within the bilayer and they were left there. This protocol is different from previous studies conducted in other groups where waters in the hydrophobic region of the membrane were removed. Also different is our choice of ensemble. Previous studies have used the NPT ensemble, in which the microscopic box dimensions are adjusted in an attempt to mimic the macroscopic pressure (23,24,45). In our work, using the microcanonical ensemble, the solution density is an essential feature of the system and we therefore left the water molecules inside the membrane. We found that water molecules placed inside the membrane by the solvation routines were quick (within 50 ps) to leave the hydrophobic bilayer and join bulk water “above” and “below” the membrane (Fig. 2). At the end of the equilibration runs, few water molecules remained in the hydrophobic region. Any gaps between the protein side chains and lipid molecules were largely filled and the bilayer appeared to have equilibrated (Fig. 2).
Overall properties of the production simulations
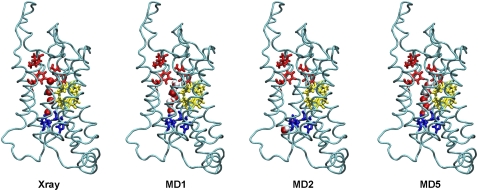
After the 1 ns equilibration runs, we carried out 4 and 10 ns production runs by letting all the atoms in the system move. Fig. 3 shows waters in the crystal structure and waters inside the pore after 1 ns equilibration runs. In MD1 and MD5, the solvation routine placed five water molecules in the pore. Three of the five positions are populated in the crystal structure (Fig. 3, Xray). In addition, the hydrogen bonding pattern of these three waters (top three red spheres in Fig. 3, Xray) matches that of the crystal structure (inferred from logical placement of the water hydrogens). These waters remained in the same position and kept the same hydrogen bonding network for the duration of the equilibration. Two more water molecules were found to enter and occupy the bottom of the pore near His76.
FIGURE 3.
Water positions in crystal structure and in three starting configurations for production runs. Well resolved water oxygen coordinates for the x-ray crystal structure are shown with the water oxygens in red and the protein backbone in blue. Snapshots of configurations for production runs: MD1, MD2, and MD5. The waters inside the pore are depicted in van der Waals, oxygen in red and hydrogen in white.
In MD2 no waters were placed inside the pore by the solvation routine. With the protein atoms held fixed for the equilibration run, waters did not penetrate the NPA motif region of the pore from the top. As such, none of the crystal hydration sites populated in MD1 and MD5 were populated in MD2. However, as in MD1 and MD5, two waters were found to occupy the region just below His76 and Val155 during the equilibration run (Fig. 3). MD3 behaved similarly to MD1, and MD4 was like MD2.
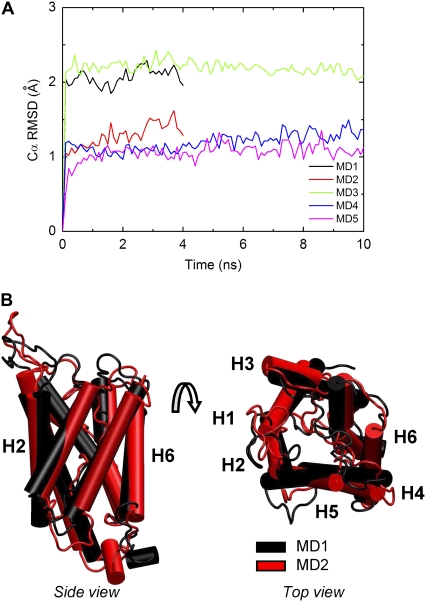
The structure of bovine aquaporin-1, particularly the transmembrane α-helices, and the lipid bilayer remained stable throughout the simulations. The average Cα root mean-square deviations (RMSD) for structured regions (residues 6–33, 51–68, 79–88, 93–117, 139–158, 170–184, 195–202, and 216–230) was 2.1 Å, 1.4 Å, 2.1 Å, 1.3 Å, and 1.1 Å for MD1, MD2, MD3, MD4, and MD5, respectively (Fig. 4 A). These values are similar to a recent simulation study comparing several aquaporins (28) and MD simulations carried out on the bovine aquaporin-1 monomeric subunit immersed in a water-n-octane-water environment (29) and the tetramer embedded within a model POPE lipid bilayer (31). The difference between the Cα RMSD values of MD1 and MD2 is mostly due to slight shifting, twisting and rotation of the H3, H4, and H5 transmembrane α-helices (Fig. 4 B). The five production runs were very similar: the C-terminal end and water-exposed loops on the extracellular end of the molecule exhibited a range of dynamics to bring the total Cα RMSD to ∼3 Å. These more dynamic regions are also the regions with variable sequences, and they are expected to undergo a conformational change based on comparison of cryo EM and crystal structures (28). Another important measure of the stability of the protein during MD is the secondary structure content. The six transmembrane and two short α-helices remained helical in all simulations.
FIGURE 4.
The Cα RMSD as a function of simulation time. (A) The Cα RMSD is relative to the minimized crystal structure after matching the helical residues: 6–33, 51–68, 79–88, 93–117, 139–158, 170–184, 195–202, and 216–230. (B) Side and top views of final structures from MD1 (black) and MD2 (red). The six transmembrane α-helices are labeled H1, H2, H3, H4, H5, and H6.
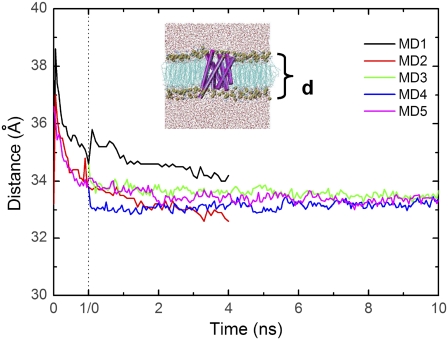
The POPC lipid bilayer exhibited a small increase in its top-to-bottom distance at the beginning of the equilibration runs, but by the beginning of the production runs it had stabilized at ∼33–34 Å in all simulations (Fig. 5). These results are consistent with the 2 Å fluctuations observed in a previous simulation of human aquaporin-1 (22).
FIGURE 5.
Lipid bilayer thickness as a function of equilibration and production run time. The equilibration run (0 to 1 ns) is delineated from the production run time (0 to 10 ns) by the vertical dash line. Bilayer thickness is calculated as the difference between the mean coordinates of the planes formed by the lipid layers.
POPC lipid molecules bent to provide a complementary charge and van der Waals interface at the exposed surfaces of the protein. Several salt bridges formed between positively charged amino acids and the negatively charged lipid phosphate groups. Similarly, hydrogen bond networks similar to those seen in a previous aquaporin simulation (28) formed between lipid headgroups and protein residues in exposed loop regions.
Mechanism of water transport
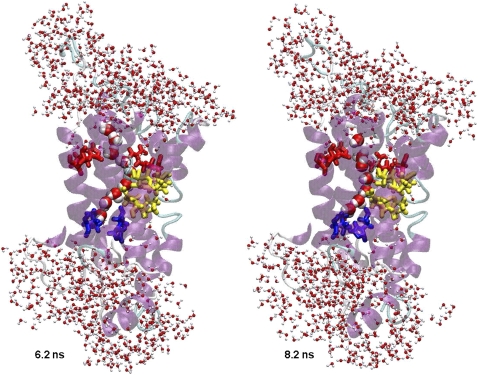
During production runs, water began to enter the channel shortly after the protein atoms were permitted to move. Both continuous and discontinuous chains of water were observed in the pore over time. These waters occupied some of the hydration sites observed in the crystal structure. Fig. 6 shows two water networks inside the pore from MD3. The NPA motifs flip waters as they move through the channel: above the NPA motifs the dipole of water is oriented up and below it points down. These observations are in agreement with previous MD simulations (21,27).
FIGURE 6.
Train of waters through the pore. Snapshots from the MD3 simulation. Coloring as in Fig. 1.
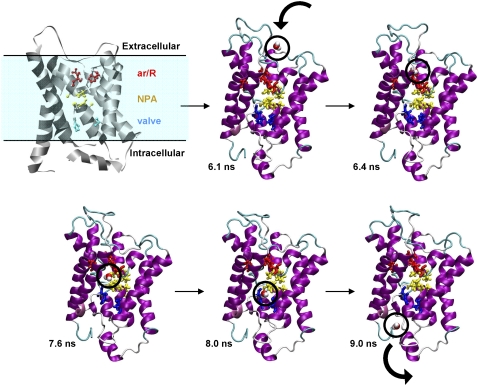
To highlight the process by which water molecules diffuse from the extracellular side of the protein to the cytoplasmic matrix, Fig. 7 presents a selected example of permeation from MD3. At 6.1 ns, a water molecule was at the edge of the extracellular vestibule of the protein. It reached the outside of the ar/R constriction region quite rapidly, traveling ∼15 Å in 300 ps. The water then spent 1.2 ns oscillating around the outside of the ar/R constriction region near R197, F58, H182, and C191. At ∼7.6 ns, the water entered the channel. Once in the channel, the water moved quickly to the center, forming hydrogen bonds to the δ2 nitrogens of both asparagines in the two conserved NPA motifs. The water remained in this position for the next 400 ps of the simulation, shuttling among the three hydrophilic nodes distributed along the length of the selectivity filter, with the NPA motifs as one node in the middle and hydration sites above and below the motif as the other two nodes. The water then moved toward the intracellular site of the channel and at ∼8.0 ns interacted with His76. To highlight the significant interactions as a water molecule moves along the pore, we calculated the average residence time of water near residues inside the pore. Table 2 shows the average residence time of water near the backbone and side-chains of the aquaporin residues. The water molecule, moving along the pore, interacts with the backbone atoms of the C191 and G192 and side-chain atoms of the R197 in the ar/R constriction region. In NPA motif water mostly interact with side chain atoms. In the “valve” region the water interacted with backbone and side-chain of the H76 and V155.
FIGURE 7.
Water moving from the extracellular to cytoplasmic side of the membrane through aquaporin-1. Snapshots from MD3 are shown with the movement of a particular water highlighted.
TABLE 2.
Average residence time of water near the residues inside the pore
| Average residence time of water (ps)
|
||
|---|---|---|
| Residue | Backbone | Side-chain |
| Aromatics and an arginine motif (ar/R) | ||
| F58 | 1.1 | 1.7 |
| H182 | 0.0 | 4.2 |
| C191 | 34.8 | 1.4 |
| R197 | 3.3 | 15.0 |
| G192 | 12.1 | 1.3 |
| NPA motif | ||
| R194 | 4.6 | 4.3 |
| R78 | 0.0 | 3.5 |
| “Valve” | ||
| H76 | 10.5 | 3.5 |
| V155 | 8.8 | 1.1 |
Results shown for the backbone and side chains of residues.
His76 moved in such a way that it helped the water to exit the channel. First, water interacted with the main-chain oxygen of His76 and then it moved to the closest side-chain nitrogen. Next, the side chain moved, pulling water out of the pore into the cytoplasmic vestibule. Finally, after exiting the channel's constricted regions, the water diffused to a region external to the cytoplasmic vestibule of the protein. It is interesting to note that His76 was often blocking the pore.
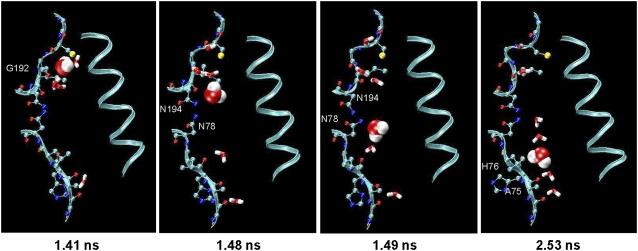
A detailed view of the NPA flipping is provided in Fig. 8. During the water's time in the channel, it was observed to move down the chain of four hydration sites identified in the crystal structure. At the first position (top in Fig. 3, Xray), the water formed a hydrogen bond with the backbone carbonyl oxygen of G192. In the presence of other waters, water-water hydrogen bonds formed (Fig. 8, 1.41 ns). The δ2 nitrogens of the two asparagines in the two conserved NPA motifs were dynamic as the waters rapidly moved to the second water position (Fig. 8, 1.48 ns). At this point, the Asn side chains, rotating at χ1 and χ2, delivered the water from the second hydration site to the third (Fig. 8, 1.49 ns). Of particular note at this point in the water's progress are the opposite orientations of the side-chain nitrogens of the two asparagines and the flipped orientation of the water molecules. As a result of the strength of these protein-water hydrogen bonds, the water spent the majority (1.14 ns) of the 1.2 ns passing these four sites. During the final movement from the third to the fourth position, the backbone carbonyl oxygen of His76 formed a direct hydrogen bond with the water (Fig. 8, 2.53 ns). This sequence of events was observed in subsequent passage of other waters through the channel as the simulation progressed as well as in the other independent simulations.
FIGURE 8.
Water interactions with both the protein main chain and side chain groups orient water to productively traverse the pore. The protein backbone of residues 74–83 and 190–194 of snapshots from MD2 simulation are shown in ribbon with protein side chain atoms as sticks. The same water is shown in all panels in space-filling mode.
The transport water through aquaporin-1 water channel can be described by the osmotic permeability (pf) and the diffusion permeability (pd), which water permeates through aquaporin-1, which both can be calculated from MD simulations. Equilibrium MD simulations yield the pd and the pf can be calculated from simulations with induced hydrostatic pressure differences across the membrane (30). The experimentally observed osmotic permeability coefficient pf is in the range of 5.43–11.7 × 10⁻¹⁴ cm3/s, which corresponds to 1.8 to 3.9 waters per ns per monomer (5,10,18). The diffusion permeability was calculated using Eq. 1 (30):
 |
(1) |
where vw is the volume of the single water molecule, and q0 is the unidirectional permeation rate. The water unidirectional permeation rate was obtained by calculating the number of events in which a water molecule completely passed through the aquaporin channel over the simulation time. Our MD-derived average unidirectional permeation rate value is 0.39 waters per ns per monomer, which is in good agreement with experiment and previous MD simulations of bovine aquaporin-1 (29,31). The rapid permeation appears to be partly due to the polar residues lining the extracellular side that guide the waters into the channel and pass them along to the constriction region. The time spent by waters inside the constriction region is significantly longer than what is needed for the water to pass the ∼20 Å distance from the edge to the extracellular vestibule, highlighting this region's role in regulation.
Importance of protein dynamics to water transport
It was interesting when the protein atoms were held fixed in our lipid-water equilibration step that water transport did not occur. In fact, MD1 and MD5 had a majority of the crystal hydration sites populated throughout the entire equilibration run yet the waters did not move through the pore until the protein was also allowed to move. Thus, there seems to be a requirement for protein movement for water transport. Indeed, the side-chain dynamics of the asparagines in the NPA motifs played a crucial role in the exchange of water between hydration sites, or water holding sites, during water permeation and transport. Calculating the radius of the channel along its axis by the program HOLE (46) shows that the radius of the channel's narrowest region (ar/R) is 0.70 Å for the aquaporin crystal structure. The channel radius of the minimized structures is equal to 0.83, 0.81, and 0.82 for MD1, MD2, and MD5, respectively. It is noticeably smaller than the size of the water molecule (usually considered as a sphere of radius 1.4 or 1.5 Å) (47–49). The average radius of the same channel region during productions runs is 1.3 ± 0.4 Å. When protein atoms were allowed to move the size of the channel's narrowest region increased and water molecules were able to permeate into the aquaporin pore. The residues in the NPA motif also needs to move to shepherd the water through the channel.
To check the dependence of water permeation on pore size, we simulated the system with aquaporin rigid starting from the 1 ns configuration of the MD3 production run. In this structure the pore radius was 1.5 Å. The protein atoms were held fixed and water and lipids atoms were allowed to move; this simulation tests whether the smaller pore size prevented water transport or the lack of protein dynamics. During the 1 ns simulation we observed no transport of water through aquaporin. For comparison, in the MD3 production run three water molecules passed through the pore during this same time period.
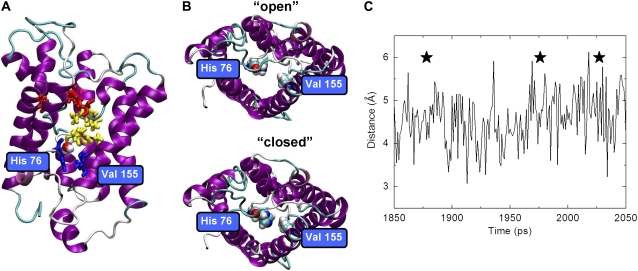
Although the NPA motif is clearly important to water transport, we also found His76 important to the process. Just before the cytoplasmic vestibule, at the final position, the protein-water hydrogen bonding (water to main-chain oxygen of His76) serves to escort the water molecule out of the channel. We hypothesize that this region of the channel, particularly His76 and Val155, act as a valve to control water flow (Fig. 9, A and B). Namely, this valve can be open or closed depending on the orientation of the side chain of His76 (Fig. 9 B). Indeed, we observed that the His76 and Val155 separation distance correlated with water permeation events. As a typical example, Fig. 9 C shows the His76 and Val155 separation distance as a function of simulation time together with water permeation events from MD3 (indicated by a star). When His76 swung out of the pore (separation distance ∼5.5–6.0 Å), water passed through. These observations are consistent with the free energy profile associated with water permeation along the channel axis of bovine aquaporin where the water molecules have to cross a free-energy maximum at the cytoplasmic side of the channel (29,31). The valve identified here may be the source of that barrier. Additionally, we have calculated diffusion coefficient of water inside the pore near the valve and ar/R regions. The diffusion constant was found to be 0.02 and 0.03 Å2/ps in the valve and ar/R regions, respectively. We would predict that mutation of these valve residues would alter water flow. For example, the Val → Ala would be predicted to increase water flow through the valve due to enlargement of the maximal diameter of the proposed constriction region.
FIGURE 9.
Valve on intracellular side of the aquaporin-1 channel. (A) The putative valve, comprised of H76 and V155. (B) Views looking up into the pore, showing movement of the side chain of H76. (C) The separation distance between residues H76 and V155 as a function of production run time: stars indicate time points of water passage through the valve.
This MD-identified valve has not been noted before and appears to be a novel constriction site. In fact, Gonen and Walz (4) state that unlike aquaporin-1, GlpF, and AqPz, AQP0 contain a novel constriction region involving a His in this same region (H66, F76, and Y149 in AQP0). Despite the large number of structures available, the valve was not observed previously in AQP1, and in fact it was said not to exist (4), which shows that this is a dynamic cleft and that dynamics studies are needed and that static structures are not always enough.
CONCLUSIONS
The dynamics and structure of aquaporin-1 from bovine red blood cells in a solvated lipid bilayer have been studied by MD simulations. The overall structure of the protein was stable during the five simulations described here. As predicted from sequence analysis and previous theoretical studies of aquaporin family members, the NPA motifs contribute significantly to the mechanism of water permeation in aquaporin-1. That is, the dynamic motions of the two side chains mediate the exchange of waters between the two halves of the channel by flipping the water into a productive orientation. The extracellular and cytoplasmic vestibules and the solvent-accessible carbonyl oxygens that line them (Gly190, Cys191, Gly192, Ile193, Leu77, His76, Ala75, and Gly74) aid in the formation of a network of water molecules from the mouth of the channel in the extracellular case and out to the cytoplasmic matrix on the intracellular side, thereby keeping the channel primed and the exits clear. A hydrogen bond network with other waters at the cusp of the channel provide the push and pull required to move waters in and out of the channel's constriction/selectivity filter. Finally, our simulations suggest that His76 and Val155 act as a valve and their movement leads to opening and closing of the intracellular region of the pore thereby regulating flow.
Acknowledgments
We thank Dr. Darwin Alonso for running the MD3–MD5 simulations.
This research is financially supported by the Office of Naval Research (grant N00014-02-1-0373), and a grant of HPC resources from the Arctic Region Supercomputing Center at the University of Alaska Fairbanks as part of the Department of Defense High Performance Computing Modernization Program.
Bin Li's present address is Merrimack Pharmaceuticals, Inc., Cambridge, MA 02139.
Editor: Klaus Schulten.
References
- 1.Agre, P., M. Bonhivers, and M. J. Borgnia. 1998. The aquaporins, blueprints for cellular plumbing systems. J. Biol. Chem. 273:14659–14662. [DOI] [PubMed] [Google Scholar]
- 2.Agre, P. 2004. Aquaporin water channels (Nobel lecture). Angew. Chem. Int. Ed. 43:4278–4290. [DOI] [PubMed] [Google Scholar]
- 3.Hedfalk, K., S. Tornroth-Horsefield, M. Nyblom, U. Johanson, P. Kjellbom, and R. Neutze. 2006. Aquaporin gating. Curr. Opin. Struct. Biol. 16:447–456. [DOI] [PubMed] [Google Scholar]
- 4.Gonen, T., and T. Walz. 2006. The structure of aquaporins. Q. Rev. Biophys. 39:361–396. [DOI] [PubMed] [Google Scholar]
- 5.Heymann, J. B., and A. Engel. 1999. Aquaporins: phylogeny, structure, and physiology of water channels. News Physiol. Sci. 14:187–193. [DOI] [PubMed] [Google Scholar]
- 6.Li, J., and A. S. Verkman. 2001. Impaired hearing in mice lacking aquaporin-4 water channels. J. Biol. Chem. 276:31233–31237. [DOI] [PubMed] [Google Scholar]
- 7.Ishibashi, K., S. Sasaki, K. Fushimi, S. Uchida, M. Kuwahara, H. Saito, T. Furukawa, K. Nakajima, Y. Yamaguchi, T. Gojobori, and F. Marumo. 1994. Molecular cloning and expression of a member of the aquaporin family with permeability to glycerol and urea in addition to water expressed at the basolateral membrane of kidney collecting duct cells. Proc. Natl. Acad. Sci. USA. 91:6269–6273. [DOI] [PMC free article] [PubMed] [Google Scholar]
- 8.Zeuthen, T., and D. A. Klaerke. 1999. Transport of water and glycerol in Aquaporin 3 is gated by H+. J. Biol. Chem. 274:21631–21636. [DOI] [PubMed] [Google Scholar]
- 9.Zardoya, R., and S. Villalba. 2001. A phylogenetic framework for the Aquaporin family in eukaryotes. J. Mol. Evol. 52:391–404. [DOI] [PubMed] [Google Scholar]
- 10.Zeidel, M. L., S. V. Ambudkar, B. L. Smith, and P. Agre. 1992. Reconstitution of functional water channels in liposomes containing purified red-cell Chip28 protein. Biochemistry. 31:7436–7440. [DOI] [PubMed] [Google Scholar]
- 11.Borgnia, M., S. Nielsen, A. Engel, and P. Agre. 1999. Cellular and molecular biology of the aquaporin water channels. Annu. Rev. Biochem. 68:425–458. [DOI] [PubMed] [Google Scholar]
- 12.Hashido, M., M. Ikeguchi, and A. Kidera. 2005. Comparative simulations of aquaporin family: AQP1, AQPZ, AQP0 and GlpF. FEBS Lett. 579:5549–5552. [DOI] [PubMed] [Google Scholar]
- 13.Murata, K., K. Mitsuoka, T. Hirai, T. Walz, P. Agre, J. B. Heymann, A. Engel, and Y. Fujiyoshi. 2000. Structural determinants of water permeation through aquaporin-1. Nature. 407:599–605. [DOI] [PubMed] [Google Scholar]
- 14.Ren, G., V. Reddy, A. C. Cheng, P. Melnyk, and A. K. Mitra. 2001. Atomic resolution structure of the human AQP1 water channel determined by electron cryo-crystallography of ice-embedded 2-D crystals. Biophys. J. 80:180A. [DOI] [PubMed] [Google Scholar]
- 15.Cheng, A. C., A. N. Vanhoek, M. Yeager, A. S. Verkman, and A. K. Mitra. 1997. Three-dimensional organization of a human water channel. Nature. 387:627–630. [DOI] [PubMed] [Google Scholar]
- 16.Walz, T., T. Hirai, K. Murata, J. B. Heymann, K. Mitsuoka, Y. Fujiyoshi, B. L. Smith, P. Agre, and A. Engel. 1997. The three-dimensional structure of aquaporin-1. Nature. 387:624–627. [DOI] [PubMed] [Google Scholar]
- 17.Walz, T., B. L. Smith, P. Agre, and A. Engel. 1994. The 3-dimensional structure of human erythrocyte aquaporin chip. EMBO J. 13:2985–2993. [DOI] [PMC free article] [PubMed] [Google Scholar]
- 18.Walz, T., B. L. Smith, M. L. Zeidel, A. Engel, and P. Agre. 1994. Biologically-active 2-dimensional crystals of aquaporin chip. J. Biol. Chem. 269:1583–1586. [PubMed] [Google Scholar]
- 19.Sui, H. X., B. G. Han, J. K. Lee, P. Walian, and B. K. Jap. 2001. Structural basis of water-specific transport through the AQP1 water channel. Nature. 414:872–878. [DOI] [PubMed] [Google Scholar]
- 20.de Groot, B. L., A. Engel, and H. Grubmuller. 2001. A refined structure of human aquaporin-1. FEBS Lett. 504:206–211. [DOI] [PubMed] [Google Scholar]
- 21.Tajkhorshid, E., P. Nollert, M. O. Jensen, L. J. W. Miercke, J. O'Connell, R. M. Stroud, and K. Schulten. 2002. Control of the selectivity of the aquaporin water channel family by global orientational tuning. Science. 296:525–530. [DOI] [PubMed] [Google Scholar]
- 22.Zhu, F. Q., E. Tajkhorshid, and K. Schulten. 2001. Molecular dynamics study of aquaporin-1 water channel in a lipid bilayer. FEBS Lett. 504:212–218. [DOI] [PubMed] [Google Scholar]
- 23.Zhu, F. Q., E. Tajkhorshid, and K. Schulten. 2002. Pressure-induced water transport in membrane channels studied by molecular dynamics. Biophys. J. 83:154–160. [DOI] [PMC free article] [PubMed] [Google Scholar]
- 24.Jensen, M. O., E. Tajkhorshid, and K. Schulten. 2001. The mechanism of glycerol conduction in aquaglyceroporins. Structure. 9:1083–1093. [DOI] [PubMed] [Google Scholar]
- 25.Wang, Y., K. Schulten, and E. Tajkhorshid. 2005. What makes an aquaporin a glycerol channel? A comparative study of AqpZ and GlpF. Structure. 13:1107–1118. [DOI] [PubMed] [Google Scholar]
- 26.Schulten, Z., and K. Schulten. 1986. Proton conduction through proteins—an overview of theoretical principles and applications. Methods Enzymol. 127:419–438. [DOI] [PubMed] [Google Scholar]
- 27.de Groot, B. L., and H. Grubmuller. 2001. Water permeation across biological membranes: mechanism and dynamics of aquaporin-1 and GlpF. Science. 294:2353–2357. [DOI] [PubMed] [Google Scholar]
- 28.de Groot, B. L., A. Engel, and H. Grubmuller. 2003. The structure of the aquaporin-1 water channel: a comparison between cryo-electron microscopy and X-ray crystallography. J. Mol. Biol. 325:485–493. [DOI] [PubMed] [Google Scholar]
- 29.Vidossich, P., M. Cascella, and P. Carloni. 2004. Dynamics and energetics of water permeation through the aquaporin channel. Proteins. 55:924–931. [DOI] [PubMed] [Google Scholar]
- 30.Zhu, F. Q., E. Tajkhorshid, and K. Schulten. 2004. Theory and simulation of water permeation in aquaporin-1. Biophys. J. 86:50–57. [DOI] [PMC free article] [PubMed] [Google Scholar]
- 31.Han, B. G., A. B. Guliaev, P. J. Walian, and B. K. Jap. 2006. Water transport in AQP0 aquaporin: Molecular dynamics studies. J. Mol. Biol. 360:285–296. [DOI] [PubMed] [Google Scholar]
- 32.Verbavatz, J. M., D. Brown, I. Sabolic, G. Valenti, D. A. Ausiello, A. N. Vanhoek, T. Ma, and A. S. Verkman. 1993. Tetrameric assembly of chip28 water channels in liposomes and cell-membranes—a freeze-fracture study. J. Cell Biol. 123:605–618. [DOI] [PMC free article] [PubMed] [Google Scholar]
- 33.Vanhoek, A. N., M. L. Hom, L. H. Luthjens, M. D. Dejong, J. A. Dempster, and C. H. Vanos. 1991. Functional unit of 30-Kda for proximal tubule water channels as revealed by radiation inactivation. J. Biol. Chem. 266:16633–16635. [PubMed] [Google Scholar]
- 34.Zhang, R. B., A. N. Vanhoek, J. Biwersi, and A. S. Verkman. 1993. A point mutation at cysteine-189 blocks the water permeability of rat-kidney water channel chip28K. Biochemistry. 32:2938–2941. [DOI] [PubMed] [Google Scholar]
- 35.Shi, L. B., W. R. Skach, and A. S. Verkman. 1994. Functional independence of monomeric chip28 water channels revealed by expression of wild-type-mutant heterodimers. J. Biol. Chem. 269:10417–10422. [PubMed] [Google Scholar]
- 36.Berman, H. M., J. Westbrook, Z. Feng, G. Gilliland, T. N. Bhat, H. Weissig, I. N. Shindyalov, and P. E. Bourne. 2000. The protein data bank. Nucleic Acids Res. 28:235–242. [DOI] [PMC free article] [PubMed] [Google Scholar]
- 37.Levitt, M., M. Hirshberg, R. Sharon, and V. Daggett. 1995. Potential energy function and parameters for simulations of the molecular dynamics of proteins and nucleic-acids in solution. Comput. Phys. Commun. 91:215–231. [Google Scholar]
- 38.Heller, H., M. Schaefer, and K. Schulten. 1993. Molecular-dynamics simulation of a bilayer of 200 lipids in the gel and in the liquid-crystal phases. J. Phys. Chem. 97:8343–8360. [Google Scholar]
- 39.Ferrin, T. E., C. C. Huang, L. E. Jarvis, and R. Langridge. 1988. The Midas display system. J. Mol. Graph. 6:13–27. [Google Scholar]
- 40.Beck, D. A. C., D. O. V. Alonso, and V. Daggett. 2006. in lucem Molecular Mechanics, ilmm, University of Washington, Seattle, WA.
- 41.Levitt, M., M. Hirshberg, R. Sharon, K. E. Laidig, and V. Daggett. 1997. Calibration and testing of a water model for simulation of the molecular dynamics of proteins and nucleic acids in solution. J. Phys. Chem. B. 101:5051–5061. [Google Scholar]
- 42.Kell, G. S. 1975. Density, thermal expansivity, and compressibility of liquid water from 0 degrees to 150°C: Correlations and tables for atmospheric pressure and saturation reviewed and expressed on 1968 temperature scale. J. Chem. Eng. Data. 20:97–105. [Google Scholar]
- 43.Beck, D. A. C., and V. Daggett. 2004. Methods for molecular dynamics simulations of protein folding/unfolding in solution. Methods. 34:112–120. [DOI] [PubMed] [Google Scholar]
- 44.Beck, D. A. C., R. Armen, and V. Daggett. 2005. Cutoff size need not strongly influence molecular dynamics results on solvated polypeptides. Biochemistry. 44:609–616. [DOI] [PubMed] [Google Scholar]
- 45.Zhang, Z. Y., Y. J. Zhu, and Y. Y. Shi. 2001. Molecular dynamics simulations of urea and thermal-induced denaturation of S-peptide analogue. Biophys. Chem. 89:145–162. [DOI] [PubMed] [Google Scholar]
- 46.Smart, O. S., J. M. Goodfellow, and B. A. Wallace. 1993. The pore dimensions of gramicidin-A. Biophys. J. 65:2455–2460. [DOI] [PMC free article] [PubMed] [Google Scholar]
- 47.Richards, F. M. 1977. Areas, volumes, packing, and protein-structure. Annu. Rev. Biophys. Bioeng. 6:151–176. [DOI] [PubMed] [Google Scholar]
- 48.Chothia, C. 1975. Structural invariants in protein folding. Nature. 254:304–308. [DOI] [PubMed] [Google Scholar]
- 49.Connolly, M. L. 1985. Computation of molecular volume. J. Am. Chem. Soc. 107:1118–1124. [Google Scholar]


