

Abstract
Adenosquamous carcinoma is a rare histologic subtype of extrahepatic bile duct (EBD) carcinoma and limited information is available on its clinicopathologic characteristics. Twelve cases of adenosquamous carcinoma were collected from 3 institutions and their clinicopathologic characteristics were examined and compared with those of 176 EBD adenocarcinomas. The adenocarcinoma component was more often seen at the surface of the tumor (7 of 12 cases, 58%), while the squamous carcinoma component was slightly more frequent at the advanced edge (7 of 12 cases, 58%). Immunohistochemistry, available in 10 cases, revealed that S100A2 was positive in the squamous carcinoma component in all 10 cases (100%), while it was present in the adenocarcinoma component in only 2 of 10 cases (20%, chi-square test, p=0.001). S100A4 expression did not show any difference between the two components. Patients with adenosquamous carcinomas had worse survival (median survival, 11 months) than those with adenocarcinoma (median survival, 32 months; log-rank test, p=0.003). Patients with predominant squamous cell carcinoma component at the leading edge had worse survival than those without it. In conclusion, patients with adenosquamous carcinoma demonstrated worse survival than those with pure adenocarcinoma. S100A2 immunohistochemical staining may be helpful in detecting the squamous component.
Keywords: Adenosquamous carcinoma, extrahepatic bile duct, cholangiocarcinoma, S100A2, prognosis
Introduction
Adenosquamous carcinoma is a rare form of extrahepatic bile duct (EBD) carcinoma which comprises approximately 2–5% of EBD carcinomas [1, 2]. Only several case reports and small series have been published providing limited information about this type of malignancy [3–9].
The S100 family of proteins, characterized by their common calcium binding motifs, is involved in many cellular functions, such as cellular proliferation, differentiation, metabolism, motility, and signal transduction [10, 11]. Two members of the S100 family, S100A2 and S100A4, have been shown to be aberrantly expressed in several carcinomas originating in the gastrointestinal tract, such as esophageal, gastric, and colonic adenocarcinomas [12–14]. S100A2 is normally expressed in squamous epithelium, while S100A4 is commonly found in lymphocytes and the stem cell compartment of hair follicles [15–17]. A study reported that overexpression of S100A4 in cholangiocarcinoma cell lines was correlated with invasive potential [18]. However, the clinical significance of S100A2 and S100A4 protein expression in EBD carcinomas has not been examined.
In the present study, we examined 12 cases of adenosquamous carcinoma of EBD and compared the survival with that in patients with pure adenocarcinoma of the EBD. We also studied the expression of S100A2 and S100A4 proteins in adenosquamous cell carcinoma.
Materials and Methods
Case Selection
The surgical pathology databases of three Korean institutions, Asan Medical Center, University of Ulsan College of Medicine, Seoul; Samsung Medical Center, Sungkyunkwan University School of Medicine, Seoul; and Kyungpook National University Hospital, Daegu, were searched from 1991 to 2004, and 12 surgically resected adenosquamous carcinomas of EBD were identified and included in this study. Five of the 12 cases were reported in part of a previous study [1]. Adenosquamous carcinomas of the ampulla of Vater or pancreas, and those with obvious precancerous epithelial changes in the ampulla of Vater or pancreas were excluded. Carcinomas arising in the gallbladder or intrahepatic bile duct with extension to the extrahepatic bile duct were also excluded. Data obtained from reviewing medical records included patient's age, sex, surgical procedure, survival time, and survival status. Data from pathology reports included tumor location, size, and growth pattern. Information on post-operative radiation and/or chemotherapy, and performance status of patients were not analyzed in this study. In order to evaluate the predominant tumor component around the surface and deepest portion of the tumor, the number of malignant squamous cells and glandular cells in the representative tumor sections were counted and the proportion of each tumor component was calculated. All slides which contained carcinoma and lymph nodes were reviewed and one representative section was selected for immunohistochemical study.
Immunohistochemical Studies
Immunohistochemical staining was carried out on conventional sections using the avidin-biotin method and a commercially available kit (Vectastain Elite ABC kit, Vector Laboratories, Burlingame, CA). Deparaffinized sections were treated with methanol containing 3% H2O2 for 10 minutes after conducting antigen retrieval using a microwave oven at 95°C for 5 minutes. After washing with phosphate-buffered saline, blocking serum was applied for 10 minutes. The mouse monoclonal antibody to S100A2 (DAK-S100A2/1, DAKO Glostrup, Denmark, 1:50 dilution) and rabbit polyclonal antibody to S100A4 (S100A4 Ab-8, New markers, Inc., Fremont, CA, 1:200 dilution) were allowed to react at room temperature for 30 minutes. After washing in phosphate-buffered saline, a biotin-labeled secondary antibody was applied for 10 minutes followed by a peroxidase-labeled streptoavidin for an additional 10 minutes. The reaction was visualized by 3,3′-diaminobenzidine tetrahydrochloride. The nuclei were counterstained with hematoxylin. Normal skin tissues were used as positive controls for S100A2. Lymphocytes in tumor sections were used as an internal positive control for S100A4. Negative controls were composed of identically treated histologic sections, without primary antibodies. More than 5% of tumor cells with cytoplasmic staining for S100A2 or S100A4 were regarded as positive.
Comparison with Cases of Adenocarcinoma
In order to compare clinicopathologic characteristics of adenosquamous carcinoma with those for adenocarcinoma of EBD, 176 cases adenocarcinomas, not otherwise specified, which were included in our previous study, were examined [1].
Statistical Analysis
Statistical analyses were performed using SPSS version 11 (SPSS Inc., Chicago, Illinois) and R (http://www.r-project.org). Associations between categorical variables were examined by the Pearson's chi-square and Fisher's exact tests. Survival rates were calculated by the Kaplan-Meier method, and statistical significance was examined by the log-rank test and the Cox proportional hazards regression model. P-value of less than 0.05 was considered statistically significant.
Results
Clinicopathologic Characteristics of Adenosquamous Carcinoma
The clinicopathologic characteristics are summarized in Table 1. The ages of the patients included ranged from 48 to 78 years (mean, 60 years; SD, 9 years). Eight patients were men and 4 were women. The tumors showed infiltrative growth pattern in 9 cases, papillary in 2, and nodular in 1. The tumor sizes ranged from 1.4 to 7 cm (mean, 3.4 cm). Three cases were T2 (tumor invasion beyond the wall of bile duct), 5 were T3 (tumor invasion of liver, gallbladder, pancreas), and 4 were T4 (tumor invasion of stomach, duodenum, colon, or abdominal wall). Perineural invasion was observed in 7 cases, and vascular invasion in 3. The surgical resection margin was positive in 2 cases. Lymph node metastasis was present in 6 cases. Types of surgery included standard pancreaticoduodenectomy (Whipple's operation, N=7), bile duct resection (N=2), hepatic lobectomy with bile duct resection (N=2), and pancreaticoduodenectomy with extended hepatic lobectomy (N=1).
Table 1.
Clinicopathologic characteristics of adenosquamous carcinoma of EBD
| Case Number | 1 | 2 | 3 | 4 | 5 | 6 | 7 | 8 | 9 | 10 | 11 | 12 |
|---|---|---|---|---|---|---|---|---|---|---|---|---|
| Age | 78 | 51 | 58 | 48 | 54 | 59 | 54 | 49 | 66 | 69 | 68 | 60 |
| Sex | M | F | M | M | M | F | M | F | M | M | M | F |
| Grow pattern | Infiltrative | Infiltrative | Infiltrative | Infiltrative | Infiltrative | Papillary | Infiltrative | Infiltrative | Infiltrative | Nodular | Infiltrative | Papillary |
| Size (cm) | 1.7 | 1.4 | 5.6 | 2 | 7 | 2 | 4 | 2.8 | 6 | 2.5 | 2.5 | 3.5 |
| T classification | T3 | T4 | T3 | T4 | T2 | T3 | T2 | T2 | T4 | T3 | T3 | T4 |
| Invasion depth (cm) | 0.7 | 1.4 | 0.5 | 1.2 | 3.0 | 1.2 | 0.6 | 1.2 | 2.4 | 2.0 | 1.0 | 1.2 |
| Pancreas invasion | + | + | + | − | + | − | − | + | + | + | − | − |
| Liver invasion | − | − | − | − | − | − | − | − | − | − | − | − |
| Duodenal invasion | − | + | − | − | − | + | − | − | + | − | − | − |
| Perineural invasion | + | − | + | + | + | − | + | − | − | − | + | + |
| Vascular invasion | − | − | − | − | − | + | − | − | − | − | + | + |
| Resection marginal involvement | − | + | − | − | − | − | − | − | − | − | + | − |
| Lymph node metastasis | − | − | − | + | + | − | − | + | + | + | − | + |
| Stage | IIA | III | IIA | III | IIB | IIA | IB | IIB | III | IIB | IIA | III |
| Adenocarcinoma component | 85% | 80% | 85% | 40% | 5% | 70% | 75% | 30% | 25% | 80% | 50% | 30% |
| Squamous cell carcinoma component | 15% | 20% | 15% | 60% | 95% | 30% | 25% | 70% | 75% | 20% | 50% | 70% |
| Predominant component on the surface of tumor | A | S | A | A=S | S | A | A | A | A | A | A=S | S |
| Predominant component on the advancing edge of tumor | A | S | A | A | S | A | A | S | S | S | S | S |
| Operation procedures | Lobectomy | Whipple's operation with lobectomy | Whipple's operation | Bile duct resection | Whipple's operation | Whipple's operation | Whipple's operation | Whipple's operation | Whipple's operation | Extended Right lobectomy | Bile duct resection | Whipple's operation |
| Survival status | Death | Death* | Alive | Death | Death | Death | Death | Death | Death | Death | Death | Death |
| Survival month | 12 | 1 | 108 | 38 | 5 | 29 | 13 | 6 | 7 | 11 | 8 | 4 |
Patient number 2 died 1 month post-operatively due to complications;
M: male; F: female; A: adenocarcinoma; S: squamous cell carcinoma.
Histologic Findings of Adenosquamous Carcinoma
The squamous cell carcinoma component consisted of malignant squamous cells with keratin pearls and/or intercellular bridges (Figure 1A–1B). The glandular component was morphologically identical to typical adenocarcinoma (Figure 1C–1D). The adenocarcinoma component was predominant at the surface of the tumor in 7 cases, and the squamous cell component in 3 cases (Table 1). In 2 cases the two components were similarly represented at the surface of the tumor. The squamous cell component was slightly more frequent at the advancing edge of the tumor (7 cases) compared to the adenocarcinoma component (5 cases). The amount of the squamous cell components ranged from 15 to 95% of the tumor mass. Lymph node metastases were present in 6 cases of which 2 were composed of the adenocarcinoma component, 2 of the squamous cell component, and 2 of mixed components.
Figure 1.
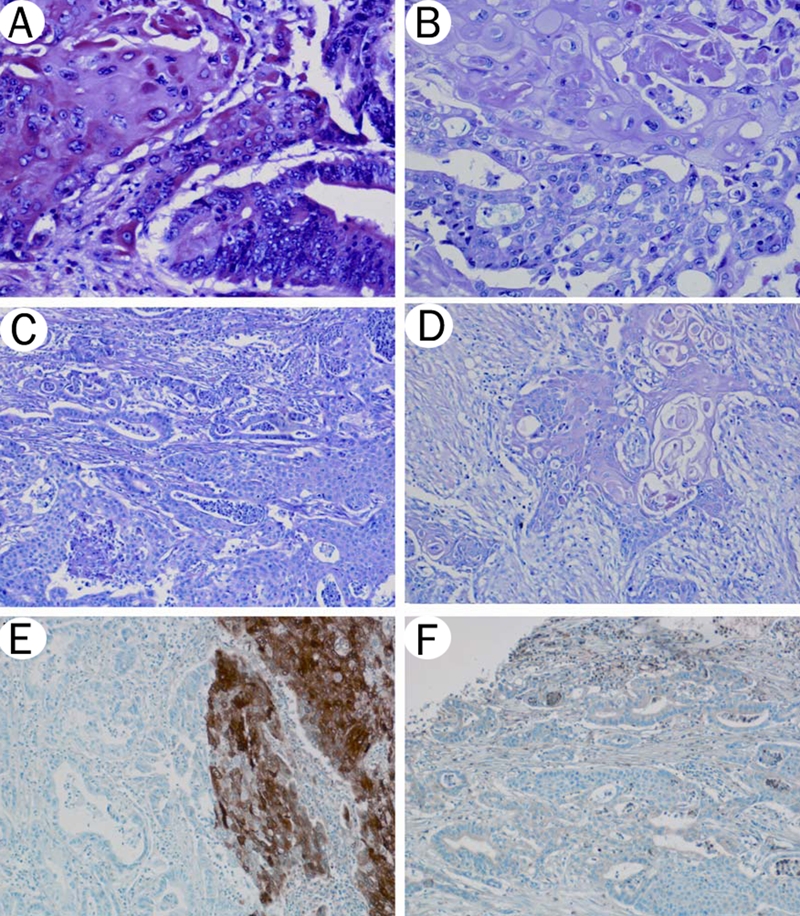
Adenosquamous carcinoma of EBD. A-D. Hematoxylin and eosin staining. Malignant squamous and glandular components are intermixed. A. Squamous cell carcinoma component (left half) and adenocarcinoma component (right half) (20×). B. Squamous cell carcinoma component (upper half) and adenocarcinoma component (lower half) (20×). C. Keratinization is not present in poorly differentiated squamous cell carcinoma component (right half) (10×). D. Squamous cell carcinoma is the predominant component at the advancing tumor edge (10x). E. S100A2 staining. Squamous cell carcinoma component (right half) is strongly positive for S100A2, while adenocarcinoma component (left half) is negative (10×). F. S100A4 staining. Both squamous cell carcinoma and adenocarcinoma are weakly positive for S100A4 (10×).
Immunohistochemical Results
Immunohistochemical results are summarized in Table 2. Staining for S100A2 and S100A4 proteins was available in 10 of the 12 cases. Ten cases with the squamous cell carcinoma component showed positive staining for S100A2 (8 cases were strongly positive, 2 weakly positive), while the adenocarcinoma component was weakly positive in 2 cases (p=0.001, chi-square test, Figure 1E). The S100A4 expression was observed in 7 cases of squamous cell carcinoma component and in 9 cases of adenocarcinoma component (Figure 1F).
Table 2.
Immunohistochemical results of adenosquamous carcinoma of EBD
| Case number | 1 | 2 | 3 | 4 | 5 | 6 | 7 | 8 | 9 | 10 | 11 | 12 |
|---|---|---|---|---|---|---|---|---|---|---|---|---|
| S100A2 in squamous component | NA | ++ | ++ | NA | ++ | ++ | ++ | ++ | ++ | + | ++ | + |
| S100A2 in adenocarcinoma component | NA | + | − | NA | − | − | + | − | − | − | − | − |
| S100A4 in squamous component | NA | + | + | NA | − | − | + | ++ | + | − | + | + |
| S100A4 in adenocarcinoma component | NA | − | − | NA | + | − | ++ | + | + | + | + | + |
NA: not applicable; −: negative; +: weak positive; ++: strong positive.
Comparison between Adenosquamous Carcinoma and Adenocarcinoma
The clinicopathologic variables for the 12 adenosquamous carcinoma and 176 adenocarcinomas are summarized in Table 3. Adenosquamous carcinomas (T2: 3 cases, 25%; T3: 5 cases, 42%; T4: 4 cases, 33%) were more frequently observed at a higher T classification than adenocarcinomas (T1: 29 cases, 16.4%; T2: 59 cases, 33.5%; T3: 80 cases, 45.4%; T4: 8 cases, 4.5%; p=0.001, chi-square test).
Table 3.
Comparison between adenosquamous carcinoma and adenocarcinoma of EBD
| Variables | Adenosquamous | Adenocarcinoma, NOS | P-value |
|---|---|---|---|
| Sex | 0.47 | ||
| Male | 8 | 126 | |
| Female | 4 | 50 | |
| Growth pattern | 0.45 | ||
| Papillary | 2 | 12 | |
| Nodular | 1 | 16 | |
| Infiltrative | 9 | 148 | |
| T classification | 0.001* | ||
| T1 | 0 | 29 | |
| T2 | 3 | 59 | |
| T3 | 5 | 80 | |
| T4 | 4 | 8 | |
| Depth of invasion | 0.03* | ||
| 5< mm | 1 | 73 | |
| 5–12 mm | 7 | 81 | |
| >12 mm | 4 | 22 | |
| Pancreatic invasion | 0.25 | ||
| Absent | 5 | 99 | |
| Present | 7 | 77 | |
| Hepatic invasion | 0.47 | ||
| Absent | 12 | 165 | |
| Present | 0 | 11 | |
| Duodenal invasion | 0.004* | ||
| Absent | 8 | 168 | |
| Present | 4 | 8 | |
| Perineural invasion | 0.25 | ||
| Absent | 5 | 50 | |
| Present | 7 | 126 | |
| Vascular invasion | 0.58 | ||
| Absent | 9 | 134 | |
| Present | 3 | 42 | |
| Marginal status | 0.49 | ||
| Negative | 10 | 137 | |
| Positive | 2 | 39 | |
| Lymph node metastasis | 0.22 | ||
| Absent | 6 | 115 | |
| Present | 6 | 61 | |
| Stage Grouping | 0.002* | ||
| Stage IA | 0 | 23 | |
| Stage IB | 1 | 42 | |
| Stage IIA | 3 | 47 | |
| Stage IIB | 4 | 56 | |
| Stage III | 4 | 8 |
Statistically significant (p<0.05)
We have recently proposed that the measurement of the depth of tumor invasion from the basement of membrane to the portion of deepest tumor is a better indicator of patient survival than the current tumor size/extent classification used in the AJCC tumor staging system [19]. Therefore, the depth of tumor invasion between the cases of adenosquamous carcinoma and those of adenocarcinoma was compared. The adenosquamous carcinomas (<5mm, 1 case, 8%; 5–12 mm, 7 cases, 58%; > 12mm, 4 cases, 34%) were more likely to have deeper tumor invasion than those of the adenocarcinomas (<5mm, 73 cases, 41%; 5–12mm, 81 cases, 46%; >12mm, 22 cases, 13%; p=0.03).
Duodenal invasion was more frequently observed in adenosquamous carcinomas (4 of 12 cases, 33%) than adenocarcinomas (8 of 176 cases, 4.5%; p=0.004). The overall stage of the adenosquamous carcinomas was stage IIB (4 of 12 cases, 33.3%) or III (4 cases, 33.3%), while the adenocarcinomas were stage IIA (47 of 176 cases, 26.7%) or stage IIB (56 cases, 31.8%; p=0.002). There was no significant difference between adenosquamous carcinoma and adenocarcinoma among the other clinicopathologic variables such as pancreatic, hepatic, perineural, or vascular invasion. Similarly, the resection marginal status and lymph node status were not different between the two types of carcinomas.
Patient Survival
The length of patient follow-up ranged from 1 to 108 months (mean: 20 months). One patient died on post-operative day 30 due to post-operative complications. The 1, 3 and 5-year survival rate for patients with adenosquamous carcinoma was 46%, 18%, and 9%, respectively (Figure 2). The median survival time for patients with adenosquamous carcinoma was 8 months.
Figure 2.
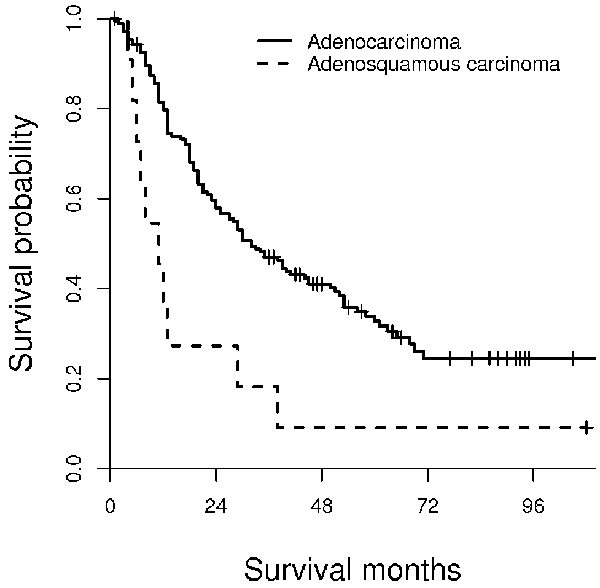
Kaplan-Meier survival analysis of adenosquamous carcinoma and adenocarcinoma of EBD. The median survival time of patients with adenosquamous carcinoma is 11 months, while that for those with adenocarcinoma is 32 months. This survival difference is statistically significant (log-rank test, P=0.003).
The survival time for the 12 patients with adenosquamous carcinoma was compared with that for 176 patients with adenocarcinoma. The 1, 3, and 5-year survival rates for these patients was 80%, 47%, and 33%. The median survival time for patients with adenocarcinoma was 32 months. Patients with adenosquamous carcinoma had significantly shorter survival times than those with adenocarcinoma (log-rank test, p=0.003).
Univariate and Multivariate Analysis of Clinicopathologic Factors
Several clinicopathologic variables were associated with patient survival including tumor size/extent (P<0.001), growth pattern (P=0.04), pancreatic invasion (P=0.03), duodenal invasion (P=0.002), vascular invasion (P=0.005), lymph node metastasis (P<0.001), and resection margin involvement (P=0.04). In contrast, survival was not associated with gender, tumor location, tumor size, hepatic invasion or perineural invasion.
The prognostic significance of histologic type (adenosquamous carcinoma vs. adenocarcinoma) as well as other clinicopathologic parameters was determined using the Cox proportional hazards model. Using this multivariate analysis, adenosquamous carcinoma (P=0.04), lymph node metastasis (P=0.002), and resection margin involvement (P=0.04) remained significant (Table 4).
Table 4.
Multivariate analysis for prognosis
| Variable | P-value | Relative risk | 95% confidence interval |
|---|---|---|---|
| Histologic subtype | |||
| Adenocarcinoma | – | 1 | – |
| Adenosquamous carcinoma | 0.04 | 1.12 | 1.01 – 1.24 |
| Lymph node metastasis | 0.002 | 1.85 | 1.25 – 2.74 |
| Resection marginal involvement | 0.04 | 1.61 | 1.02 – 2.54 |
| Growth pattern | 0.06 | 1.44 | 0.99 – 2.09 |
| Duodenal invasion | 0.57 | 1.24 | 0.59 – 2.60 |
| Pancreatic invasion | 0.59 | 0.86 | 0.51 – 1.46 |
| Vascular invasion | 0.10 | 1.42 | 0.94 – 2.15 |
| T classification | 0.08 | 1.39 | 0.96 – 1.99 |
Significant at level of p<0.05.
Patient's survival time was significantly affected by the predominant tumor component at the advancing edge in adenosquamous carcinoma and is summarized on Figure 3. Patients with squamous cell carcinoma component at the advancing edge (median survival, 6 month) had worse survival times when compared to those with adenocarcinoma component (median survival, 29 month). The result of patients’ survival time comparison based on predominant tumor component at the surface and advancing tumor edge of adenosquamous carcinoma and adenocarcinoma is summarized in Figure 4. Patients with squamous cell carcinoma component at the advancing edge in adenosquamous carcinoma (median survival, 6 month) had worse survival times than those with pure adenocarcinoma (median survival, 32 month; Figure 4). When adenocarcinoma was present at the advancing tumor edge, there was no survival difference between patients with adenosquamous carcinoma and adenocarcinoma.
Figure 3.

Kaplan-Meier survival analysis based on predominant component at the advancing tumor edge in patients with adenosquamous carcinoma. The median survival time for patients with predominant squamous cell carcinoma component at the advancing edge is 6 months, while that for those with an adenocarcinoma component at the deepest tumor portion is 29 months.
Figure 4.
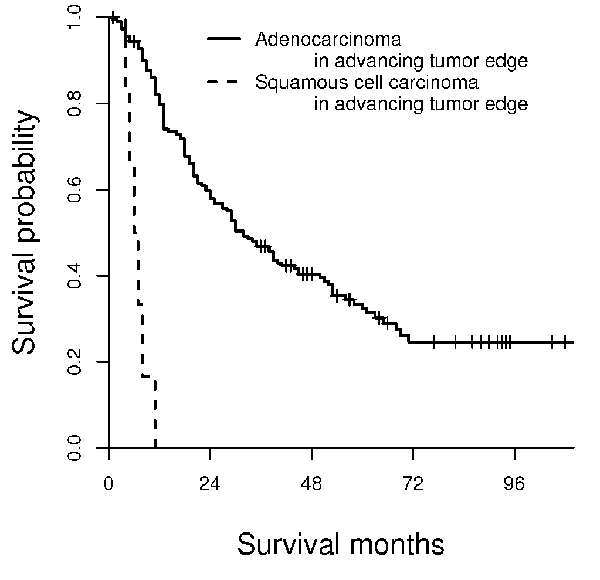
Kaplan-Meier survival analysis based on predominant component at advancing tumor edge in patients with adenosquamous carcinoma and adenocarcinoma. The median survival time for patients with predominant squamous cell carcinoma component at advancing edge is 6 months, while that for patients with adenocarcinoma at the deepest tumor portion is 32 months.
Discussion
Adenosquamous carcinoma is a rare histologic subtype of EBD carcinoma, and its clinicopathologic characteristics have been incompletely elucidated. Okabayashi et al recently reviewed 36 cases of adenosquamous carcinoma in the Japanese patients [5], and reported a median survival of 13 months for those with adenosquamous carcinoma of EBD. Our results also showed a median survival time of 11 months. In addition, our study demonstrated that the survival time for patients with adenosquamous carcinoma was significantly worse when compared with that for patients with pure adenocarcinoma of EBD. The worse survival for patients with adenosquamous carcinoma may be due in part by its tendency for deeper invasion, frequent duodenal invasion, and higher disease stage. Previous studies have suggested that patients with adenosquamous carcinomas originating from other organs such as the cervix, lung, colon, rectum, and anus had worse survival than those with pure adenocarcinoma [20–23]. Several other clinical factors, which were not evaluated in this study, such as post-operative radiation and/or chemotherapy and performance status, may also affect the differences in patient survival and these possibilities cannot be completely ruled out.
The correlation between depth of tumor cell invasion and prognosis in cases with adenosquamous carcinoma has not been previously examined. We compared patient survival to the predominant histologic subtype of the deepest portion of the tumor, and found that survival time for patients was worse when the squamous cell component was more predominant than the adenocarcinoma component at the advancing tumor edge.
As defined in the World Health Organization (WHO) classification, adenosquamous carcinoma of EBD consists of both malignant squamous and glandular components [24], but in contrast to the definition for adenosquamous carcinoma of the pancreas, which requires at least 30% squamous cell carcinoma [25], no minimum amount of squamous cell carcinoma is required for the diagnosis of EBD adenosquamous tumors. The proportion of squamous cell carcinoma in our study ranged from 15% to 95%. As the amount of squamous cell carcinoma component increased, the survival for the patients worsened (log-rank test, p=0.03). We also examined if 30% squamous cell carcinoma proportion could be used as a cut-off point for discriminating patient survival, and found no significant difference (log-rank test, p=0.23). These findings support the current WHO definition of adenosquamous carcinoma of EBD, as 30% proportion of the squamous cell carcinoma component may not be a good indicator for differentiating patient survival.
There are only a few cases of pure squamous cell carcinoma of EBD that have been reported [26–31], and no information is available on the survival time for this subtype. Our study suggests that the survival time is decreased when the proportion of squamous cell carcinoma component is increased. This suggests that identification of the squamous cell component in EBD carcinomas can have important implications in patient prognosis. S100A2 was strongly positive in the squamous carcinoma component and negative in the adenocarcinoma component in this study. It has been shown that S100A2 was more frequently expressed in normal squamous epithelial tissues than glandular tissues [15], and increased in pulmonary squamous cell carcinoma compared with adenocarcinoma [32]. The finding of S100A2 may be helpful in identifying the squamous carcinoma component in an EBD tumor.
The pathogenesis of adenosquamous cell carcinoma of EBD is unknown. Six of 36 reported Japanese cases revealed a pre-existing pancreaticobiliary maljunction [5]. Two cases in our study demonstrated adult worms of C. sinensis present in bile cytology.
In summary, adenosquamous carcinoma of EBD is a rare histologic variant, and imparts a worse patient survival than that for adenocarcinoma. This worse survival time is related to depth of tumor invasion, particularly when the squamous carcinoma component is present at the advancing edge, and the more frequent invasion into surrounding organs. Immunohistochemical study for S100A2 protein may be a useful tool in detecting the squamous carcinoma component in difficult cases.
Acknowledgments
We thank Ms. Sharon Birdsall for assistance with immunohistochemical techniques and Dr. Thomas Lee for comments on the manuscript.
References
- 1.Hong SM, Kim MJ, Pi DY, Jo D, Cho HL, Yu E, Ro JY. Analysis of extrahepatic bile duct carcinomas according to the New American Joint Committee on Cancer staging system focused on tumor classification problems in 222 patients. Cancer. 2005;104:802–810. doi: 10.1002/cncr.21236. [DOI] [PubMed] [Google Scholar]
- 2.Albores-Saavedra J, Henson DE, Klimstra DS, editors. Atlas of Tumor Pathology. Tumors of the Gallbladder, Extrahepatic Bile Ducts, and Ampulla of Vater. Washington DC: Armed Forces Institute of Pathology; 2000. [Google Scholar]
- 3.Hughes JH, Niemann TH. Adenosquamous carcinoma of the bile duct: cytologic features of brush specimens from two cases. Diagn Cytopathol. 1996;15:322–324. doi: 10.1002/(SICI)1097-0339(199611)15:4<322::AID-DC13>3.0.CO;2-Q. [DOI] [PubMed] [Google Scholar]
- 4.Okamura K, Hayakawa H, Kuze M, Takahashi H, Kosaka A, Mizumoto R, Katsuta K. Triple carcinomas of the biliary tract associated with congenital choledochal dilatation and pancreaticobiliary maljunction. J Gastroenterol. 2000;35:465–471. doi: 10.1007/s005350070093. [DOI] [PubMed] [Google Scholar]
- 5.Okabayashi T, Kobayashi M, Nishimori I, Namikawa T, Okamoto K, Onishi S, Araki K. Adenosquamous carcinoma of the extrahepatic biliary tract: clinicopathological analysis of Japanese cases of this uncommon disease. J Gastroenterol. 2005;40:192–199. doi: 10.1007/s00535-004-1520-9. [DOI] [PubMed] [Google Scholar]
- 6.Lantsberg L, Khodadadi J, Goldstein J. Adenosquamous carcinoma of the common bile duct: a case report. J Surg Oncol. 1986;33:140–142. doi: 10.1002/jso.2930330219. [DOI] [PubMed] [Google Scholar]
- 7.Hayashi N, Yamaguchi Y, Ogawa M. Concomitant adenosquamous carcinoma of the common bile duct and early adenocarcinoma of the gall-bladder. J Gastroenterol Hepatol. 1993;8:607–612. doi: 10.1111/j.1440-1746.1993.tb01660.x. [DOI] [PubMed] [Google Scholar]
- 8.Hamamoto Y, Koyama H, Takasu K, Tateishi S. An autopsy case of adenosquamous cell carcinoma of the extrahepatic bile duct with endobronchial mass obstructing the left main bronchus and masquerading as asthma. Nihon Kyobu Shikkan Gakkai Zasshi. 1994;32:161–167. [PubMed] [Google Scholar]
- 9.Yavuz E, Kapran Y, Ozden I, Bulut T, Dizdaroglu F. Pancreatobiliary adenosquamous carcinoma (report of two cases) Pathologica. 2000;92:323–326. [PubMed] [Google Scholar]
- 10.Marenholz I, Heizmann CW, Fritz G. S100 proteins in mouse and man: from evolution to function and pathology (including an update of the nomenclature) Biochem Biophys Res Commun. 2004;322:1111–1122. doi: 10.1016/j.bbrc.2004.07.096. [DOI] [PubMed] [Google Scholar]
- 11.Emberley ED, Murphy LC, Watson PH. S100 proteins and their influence on pro-survival pathways in cancer. Biochem Cell Biol. 2004;82:508–515. doi: 10.1139/o04-052. [DOI] [PubMed] [Google Scholar]
- 12.El-Rifai W, Moskaluk CA, Abdrabbo MK, Harper J, Yoshida C, Roiggins GJ, Frierson HF, Jr, Powell SM. Gastric cancers overexpress S100A calcium-binding proteins. Cancer Res. 2002;62:6823–6826. [PubMed] [Google Scholar]
- 13.Lee OJ, Hong SM, Razvi MH, Peng D, Powell SM, Smoklin M, Moskaluk CA, El-Rifai W. Expression of calcium-binding proteins S100A2 and S100A4 in Barrett's adenocarcinomas. Neoplasia. 2006;8:843–850. doi: 10.1593/neo.06481. [DOI] [PMC free article] [PubMed] [Google Scholar]
- 14.Takenaga K, Nakanishi H, Wada K, et al. Increased expression of S100A4, a metastasis-associated gene, in human colorectal adenocarcinomas. Clin Cancer Res. 1997;3:2309–2316. [PubMed] [Google Scholar]
- 15.Nagy N, Hoyaux D, Gielen I, Schäfer BW, Pochet R, Heizmann CW, Kiss R, Salmon I, Decaestecker C. The Ca2+-binding S100A2 protein is differentially expressed in epithelial tissue of glandular or squamous origin. Histol Histopathol. 2002;17:123–130. doi: 10.14670/HH-17.123. [DOI] [PubMed] [Google Scholar]
- 16.Flatmark K, Maelandsmo GM, Mikalsen SO, Nustad K, Varaas T, Rasmussen H, Meling GI, Fodstad O, Paus E. Immunofluorometric assay for the metastasis-related protein S100A4: release of S100A4 from normal blood cells prohibits the use of S100A4 as a tumor marker in plasma and serum. Tumour Biol. 2004;25:31–40. doi: 10.1159/000077721. [DOI] [PubMed] [Google Scholar]
- 17.Kizawa K, Ito M. Characterization of epithelial cells in the hair follicle with S100 proteins. Methods Mol Biol. 2005;289:209–222. doi: 10.1385/1-59259-830-7:209. [DOI] [PubMed] [Google Scholar]
- 18.Katayama N, Murao S, Ajiki T, Kitazawa S, Onoyama H, Kuroda Y, Maeda S. The role of S100A4 gene encoding an S100-related calcium-binding protein in human bile duct adenocarcinoma cell lines: correlation of S100A4 expression and invasive growth in Matrigel Matrix. Int J Mol Med. 2000;6:539–542. doi: 10.3892/ijmm.6.5.539. [DOI] [PubMed] [Google Scholar]
- 19.Hong SM, Cho H, Moskaluk CA, Yu E. Measurement of the Invasion Depth of Extrahepatic Bile Duct Carcinoma: An Alternative Method Overcoming the Current T Classification Problems of the AJCC Staging System. Am J Surg Pathol. 2007;31:199–206. doi: 10.1097/01.pas.0000213384.25042.86. [DOI] [PubMed] [Google Scholar]
- 20.Lea JS, Coleman RL, Garner EO, Duska LR, Miller DS, Schorge JO. Adenosquamous histology predicts poor outcome in low-risk stage IB1 cervical adenocarcinoma. Gynecol Oncol. 2003;91:558–562. doi: 10.1016/j.ygyno.2003.08.020. [DOI] [PubMed] [Google Scholar]
- 21.Farley JH, Hickey KW, Carlson JW, Rose GS, Kost ER, Harrison TA. Adenosquamous histology predicts a poor outcome for patients with advanced-stage, but not early-stage, cervical carcinoma. Cancer. 2003;97:2196–2202. doi: 10.1002/cncr.11371. [DOI] [PubMed] [Google Scholar]
- 22.Cagir B, Nagy MW, Topham A, Rakinic J, Fry RD. Adenosquamous carcinoma of the colon, rectum, and anus: epidemiology, distribution, and survival characteristics. Dis Colon Rectum. 1999;42:258–263. doi: 10.1007/BF02237138. [DOI] [PubMed] [Google Scholar]
- 23.Naunheim KS, Taylor JR, Skosey C, Hoffman PC, Ferguson MK, Golomb HM, Little AG. Adenosquamous lung carcinoma: clinical characteristics, treatment, and prognosis. Ann Thorac Surg. 1987;44:462–426. doi: 10.1016/s0003-4975(10)62102-9. [DOI] [PubMed] [Google Scholar]
- 24.Albores-Saavedra J, Scoazec JC, Wittekind C, et al. Carcinoma of the gallbladder and extrahepatic bile ducts. In: Hamilton S, Aaltonen L, editors. World Health Organization classification of tumours Pathology and genetics Tumours of the digestive system. Lyon: IARC; 2000. [Google Scholar]
- 25.Solcia E, Capella C, Kloppel G, editors. Atlas of tumor pathology. Tumor of the pancreas. Washington DC: Armed Forces Institute of Pathology; 1997. [Google Scholar]
- 26.Burger RE, Meeker WR, Luckett PM. Squamous cell carcinoma of the common bile duct. South Med J. 1978;71:216–219. doi: 10.1097/00007611-197802000-00036. [DOI] [PubMed] [Google Scholar]
- 27.Aranha GV, Reyes CV, Greenlee HB, Field T, Brosnan J. Squamous cell carcinoma of the proximal bile duct–a case report. J Surg Oncol. 1980;15:29–35. doi: 10.1002/jso.2930150106. [DOI] [PubMed] [Google Scholar]
- 28.Funakawa T, Fujishiro N, Kuno N, Kobayashi S, Kimoto E, Suzuki K. Squamous cell carcinoma of the extrahepatic bile duct. Ryoikibetsu Shokogun Shirizu. 1996;9:61–63. [PubMed] [Google Scholar]
- 29.La Greca G, Conti P, Urrico GS, Catanuto G, Di Carlo I, Russello D, Latteri F. Biliary squamous cell carcinoma. Chir Ital. 2004;56:289–295. [PubMed] [Google Scholar]
- 30.Gatof D, Chen YK, Shah RJ. Primary squamous cell carcinoma of the bile duct diagnosed by transpapillary cholangioscopy: case report and review. Gastrointest Endosc. 2004;60:300–304. doi: 10.1016/s0016-5107(04)01561-5. [DOI] [PubMed] [Google Scholar]
- 31.Sewkani A, Kapoor S, Sharma S, Naik S, Juneja M, Jain A, Varshney S. Squamous cell carcinoma of the distal common bile duct. J Pancreas. 2005;6:162–165. [PubMed] [Google Scholar]
- 32.Smith SL, Gugger M, Hoban P, Ratschiller D, Watson SG, Field JK, Betticher DC, Heighway J. S100A2 is strongly expressed in airway basal cells, preneoplastic bronchial lesions and primary non-small cell lung carcinomas. Br J Cancer. 2004;91:1515–1524. doi: 10.1038/sj.bjc.6602188. [DOI] [PMC free article] [PubMed] [Google Scholar]