

Abstract
Ceramide-1-phosphate (Cer-1-P), one of the simplest of all sphingophospholipids, occurs in minor amounts in biological membranes. Yet recent evidence suggests important roles of this lipid as a novel second messenger with crucial tasks in cell survival and inflammatory responses. We present a detailed description of the physical chemistry of this hitherto little explored membrane lipid. At full hydration Cer-1-P forms a highly organized subgel (crystalline) bilayer phase (Lc) at low temperature, which transforms into a regular gel phase (Lβ) at ∼45°C, with the gel to fluid phase transition (Lβ–Lα) occurring at ∼65°C. When incorporated at 5 mol % in a phosphatidylcholine bilayer, the pKa2 of Cer-1-P, 7.39 ± 0.03, lies within the physiological pH range. Inclusion of phosphatidylethanolamine in the phosphatidylcholine bilayer, at equimolar ratio, dramatically reduces the pKa2 to 6.64 ± 0.03. We explain these results in light of the novel electrostatic/hydrogen bond switch model described recently for phosphatidic acid. In mixtures with dielaidoylphosphatidylethanolamine, small concentrations of Cer-1-P cause a large reduction of the lamellar-to-inverted hexagonal phase transition temperature, suggesting that Cer-1-P induces, like phosphatidic acid, negative membrane curvature in these types of lipid mixtures. These properties place Cer-1-P in a class more akin to certain glycerophospholipids (phosphatidylethanolamine, phosphatidic acid) than to any other sphingolipid. In particular, the similarities and differences between ceramide and Cer-1-P may be relevant in explaining some of their physiological roles.
INTRODUCTION
Ceramide-1-phosphate (Cer-1-P) is one of the simplest sphingophospholipids found in biological membranes and its average concentration is usually very small (1). Cer-1-P may be formed directly from sphingomyelin through a sphingomyelinase D activity. Such an activity has been identified in several bacteria and in spider venom (2,3). However, in mammalian cells such an activity has not been identified to date, and in those cells Cer-1-P is formed primarily from ceramide by ceramide-1-kinase (4,5). Recent evidence suggests an important role of this lipid as a novel second messenger with important roles in (intra)cellular processes as diverse as phagocytosis (6), potassium channel function (7), inflammatory responses (8–10), and cell survival and tumorigenesis (1,11–13). The exact mechanism of Cer-1-P action in these diverse processes is not yet clear, although two alternate, and not mutually exclusive, possibilities are likely. Cer-1-P may function through the activation/recruitment of effector proteins by direct interaction, such as PLA2α (9,14), or by a modulation of membrane properties such as curvature and electrostatics (15,16). It is, therefore, of great importance to understand the physical chemistry, and particularly the phase behavior and electrostatics of this bioactive lipid.
Cer-1-P, like its glycerophospholipid counterpart phosphatidic acid (PA), is an anionic phospholipid with a phosphomonoester headgroup. The latter suggests an important role for electrostatic interactions between Cer-1-P and proteins. However, no data are available on the electrostatic properties of this lipid. Recently magic-angle spinning (MAS) 31P nuclear magnetic resonance (NMR) data on phosphatidic acid and lysophosphatidic acid have shown that the ionization properties of the phosphomonoester moiety are considerably more complex than previously thought (17,18). On the dissociation of the first proton, the second becomes bound more strongly to the phosphomonoester moiety. However, hydrogen bonds formed with this phosphomonoester, e.g., by the primary amine headgroup of phosphatidylethanolamine (PE), affect these stabilizing electrostatic interactions strongly; in fact facilitate the dissociation of the second proton (17). Thus hydrogen bonds formed with the phosphomonoester affect its dissociation constant(s). Using MAS 31P NMR, we present the first pKa2 values, to our knowledge, for Cer-1-P and compare the results with those for PA and LPA. The results are discussed further in terms of the newly reported working model for PA/protein interaction namely the electrostatic/hydrogen bond switch model.
Moreover, we have explored the phase behavior of Cer-1-P as a pure lipid dispersion in buffer, or as a component in a mixture with other phospholipids. Although cell membranes stay usually in a bilayer form, i.e., the real structure corresponding approximately to the “lamellar phase”, transient nonlamellar structures seem to form in frequent and important events, such as membrane fusion (19,20), or membrane protein insertion (21,22). Transient nonlamellar structures might also be involved in lipid signaling (15,23) thus making the phase behavior of Cer-1-P relevant in this context. Using a combination of x-ray scattering, differential scanning calorimetry (DSC), and 31P-NMR, we have found that, in contrast to ceramide, pure Cer-1-P forms bilayers in aqueous media. However, in mixtures with glycerophospholipids, Cer-1-P exhibits, as does ceramide, the property of inducing a negative curvature in the lipid monolayers, i.e., of inducing formation of nonlamellar structures.
MATERIALS AND METHODS
Sample preparation
1,2-dioleoyl-sn-glycero-3-phosphocholine (DOPC), 1,2-dioleoyl-sn-glycero-3-phosphoethanolamine (DOPE), 1,2-dielaidoyl-sn-glycero-3-phosphoethanolamine (DEPE), 1,1′,2,2′-tetraoleoyl cardiolipin (CL), and (2S,3R,4E)-2-acylamino-1,3-octadec-4-enediol (egg ceramide, egg-Cer) were purchased from Avanti Polar Lipids (Birmingham, AL). 1,1′-Dioctadecyl-3,3,3′,3′-tetramethylindocarbocyanine perchlorate (DiIC18) was from Molecular Probes (Eugene, OR). Diacylglycerol kinase of high purity (>24 units/mg protein) was purchased from Calbiochem (La Jolla, CA). Lipid purity was checked by thin layer chromatography and judged to be >99%. Water used in the experiments came from a Milli-Q System (Millipore, Bedford, MA) and had a resistivity of 18.2 MΩ-cm.
NMR samples, for pH titration purposes, were prepared by mixing appropriate amounts of lipid stock (concentration determined by a phosphate determination; (24)) from chloroform/methanol and subsequently dried under a stream of N2 and placed under high vacuum overnight. Lipid films consisting of 95 mol % PC, or PC/PE 1:1 and 5 mol % Cer-1-P (total = 20 μM) were hydrated at room temperature using 2.8 ml of appropriate buffer. Buffers used were: 10 mM HEPES, 20 mM Mes, 30 mM citric acid-NaOH, 100 mM NaCl (pH 4.0–7.5), 50 mM Tris-HCl, 100 mM NaCl (pH 7.5–9.0), or 50 mM glycine-NaOH, 100 mM NaCl (pH 9.0–10.5), and contained 2 mM EDTA to complex any traces of divalent cations. The samples were then subjected to at least one freeze thaw/vortex cycle, after which the pH of the samples was measured at 37.0 ± 0.5°C. The pH probe was calibrated previously at 37.0°C to ensure correct pH measurement. This pH, measured after lipid hydration, was used to construct the pH titration curves. The lipid dispersions were concentrated in a tabletop centrifuge (70,000 rpm, 45 min; RT) and the (wet) lipid pellet was transferred to 4 mm TiO2 MAS-NMR sample tubes.
Samples for lipid phase determination were prepared as described above and hydrated in a 20 mM HEPES-NaOH, 1 mM EDTA, 150 mM NaCl buffer at pH 7.4 (at room temperature) for solid state NMR measurements, and in 25 mM HEPES-NaOH, 1 mM EDTA, 150 mM NaCl buffer at pH 7.4 for DSC measurement, unless stated otherwise. Mixed lipid samples for NMR contained 15 μmol/ml, whereas the Cer-1-P samples contained a total of 10–15 μmol of lipid dissolved in 1.5 ml of buffer. Lipid purity after sample preparation and measurement was checked by thin layer chromatography and was judged to be >99%.
Ceramide-1-phosphate synthesis
Cer-1-phosphate for the DSC experiments was synthesized with a few modifications according to procedures published previously (1). The structure of (C16)-Cer-1-P is shown as an inset of Fig. 1. Briefly, egg ceramide (2 mg) was solubilized in 400 μl of a solution of 5 mM cardiolipin, 7.5% octyl-β-glucopyranoside, 1 mM diethylenetriaminepentaacetic acid (DETAPAC) (Solution A), by sonicating the solution using a Branson tip sonicator while cooling the mixture with an ice bath. Solubilization was judged to be complete when the solution had turned slightly opalescent. Then, 1.4 ml of a solution containing 50 mM imidazole, pH 6.6, 50 mM NaCl, 100 mM MgCl2, 1 mM EDTA (Solution B), and 16 μl of diacylglycerol kinase (7.1 u/mg prot/ml) were added. The mixture was kept at 37°C for at least 10 min before the addition of 2.8 mg of ATP dissolved in 200 μl of a solution of 100 mM imidazole and 1 mM DETAPAC at pH 7.0 (Solution C). The reaction was left overnight at 37°C. More ATP was added and left to react during an additional 6 h. The reaction was stopped by extraction of the lipids according to the method of Bligh and Dyer (25), except that the phases were separated by addition of 2 M KCl in 0.1 M H3PO4 instead of water. The organic phase was dried under N2 and the lipid was applied to thin-layer plates in chloroform/methanol (1:1, v/v). The plates were developed with chloroform/methanol/acetic acid (65/15/5, by volume). Ceramide-1-phosphate was identified as a spot at Rf 0.24, together with cardiolipin (Rf 0.53) and egg ceramide (Rf 0.98).
FIGURE 1.

Structure and phase behavior of pure Cer-1-P at full hydration. (A) Wide angle x-ray scattering spectra as a function of temperature for fully hydrated Cer-1-P in pH 7.4 buffer. (B) Close up of the wide angle scattering region. The chemical structure of C16-Cer-1-P is shown as an inset in the middle of the figure.
This synthesis was scaled up 12.5 times for the preparation of Cer-1-P for the NMR experiments. Briefly, 25 mg of egg-ceramide was dissolved in 5 ml of Solution A, by sonication. Then, 17.5 ml of Solution B (now containing only 20 mM MgCl2) and 65 μl diacylglycerol kinase (>24 u/mg prot/ml) was added. The mixture was warmed to 37°C for at least 10 min before the addition of 200 mg of ATP dissolved in 2.5 ml of Solution C. The resulting mixture was left overnight at 37°C and the reaction was stopped as described above. The organic phase was evaporated and the resulting lipid/detergent mixture was dissolved in 5 ml of chloroform/methanol 2:1, and lipid/detergent was separated by column chromatography using a Sephadex 60 filled column and chloroform/methanol/water/ammonia (25%), 65:35:4:1 as the separating solution. After separation, Cer-1-P was dissolved in chloroform/methanol 2:1 and the resulting stock solution was filtered using 0.45 μm PTFE filter (minigrip SRI Titan) to remove residual silica particles and glass fibers. This procedure yielded a minimum of 30 μmol Cer-1-P with an identical Rf value as the TLC procedure. Lipid purity, after synthesis and purification, was observed as a single spot on thin layer chromatography plates and was judged to be >99%.
Wide angle x-ray scattering
The same samples (after storage at −20°C) prepared for 31P NMR were also investigated by wide angle x-ray scattering. Samples were spun down with a table top centrifuge and the concentrated lipid solution was transferred to 1.5 mm x-ray capillaries and sealed with two component epoxy. Temperature scans for Cer-1-P were recorded using the same temperature protocol used for the 31P NMR experiments. Diffraction patterns recorded using the highest resolution mode of the MAR3450 image plate detector at the Sector 6 of the Midwestern Universities Collaborative Access Team (MuCAT) at the Advanced Photon Source of Argonne National Laboratories. X-ray wavelength was 0.765335 Å. Temperature scans were recorded using identical exposure times and beam intensities. Reverse temperature scans yielded essentially identical spectra, indicating that radiation damage was not an issue. The software package FIT2D, developed by Hammersley et al. (26) of the European Synchrotron Facility, was used to analyze the diffraction patterns.
Differential scanning calorimetry
Both lipid suspensions and buffer were degassed before being loaded into the sample or the reference cell of an MC-2 high-sensitivity scanning calorimeter (MicroCal, Northampton, MA). For samples containing DEPE, the final concentration of phospholipid was 0.4 mM when gel-to-fluid transitions were measured and 7 mM when fluid-to-inverted hexagonal transitions were studied. Three heating scans, at 45°C/h, were recorded for each sample. Samples consisting of pure Cer-1-P dispersions were dispersed in buffer at 0.59 mM final lipid concentration at room temperature. Then the samples were left at 4°C for several hours. Five heating scans, at 45°C/h, were recorded for each sample. Lipid phosphorous assays were carried out on all samples after the DSC scans to obtain accurate ΔH values (in kcal/mol of phospholipid). Thermogram transition temperatures, enthalpies, and widths at half-height were determined using the software ORIGIN (Microcal) provided with the calorimeter.
Preparation of GUVs and fluorescence microscopy
Ceramide-1-phosphate stock solvent solution (chloroform:methanol (2:1)) was evaporated under a nitrogen flow, and the lipid was resuspended at 75°C in 25 mM HEPES, pH 7.4 to a final concentration of ∼2 mM . At this stage DiIC18 was added from a stock solution (1.25 mM in DMSO) to achieve a dye/phospholipid ratio of 0.004. The hydrated sample was homogenized by passing it through a 25 mm, 23-gauge needle five times. A small aliquot (∼3 μl) of aqueous solution was deposited onto the platinum electrodes and allowed to dry in a vacuum chamber for 30 min. Giant vesicles were obtained by using the electroformation method developed by Angelova et al. (27): a low frequency AC field (sinusoidal wave function with a frequency of 10 Hz and an amplitude of 2.5 V) was applied for 120 min at 75°C in the same buffer, preheated. Thin layer chromatography showed no lipid degradation under these conditions. The vesicles were directly observed on an inverted confocal microscope Nikon TE2000 U (Melville, NY). The excitation wavelength for DiIC18 was 488, and the fluorescence signal was collected using a bandpass filter of 593 ± 40 nM. The objective used was a 40× oil immersion, NA 1.0 objective.
NMR spectroscopy
31P NMR spectra were recorded on a Bruker Avance 500 widebore spectrometer (Karlsruhe, Germany) at 202.48 MHz, using a 4 mm cross polarization (CP) MAS-NMR probe. Samples were spun at the magic angle (54.7°) at 5 kHz to average the chemical shift anisotropy, and the chemical shift position of Cer-1-P was recorded relative to 85% H3PO4. Under stable spinning conditions, typically, 500–3000 scans were recorded. Experiments were carried out at a temperature of 37.0 ± 0.5°C. Static spectra were recorded in a high resolution (HR) probe in 10-mm HR sample tubes and again chemical shifts were recorded relative to 85% H3PO4. Temperature scans for DEPE/Cer-1-P were recorded with 3°C temperature increments and a 15-min temperature equilibration. Under these conditions 3000 scans were recorded at each temperature. Temperature scans for pure Cer-1-P samples (7.5 mM) were recorded with 5°C temperature increments and 15-min temperature equilibration.
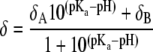
Determination of pKa value
The pKa2 value for Cer-1-P was determined by using an equation derived from the Henderson-Hasselbalch equation
 |
(1) |
(28) and a nonlinear least squares fit. δA and δB are the chemical shifts of the single dissociated and double dissociated state respectively, δ is the measured chemical shift, pH is the log of the measured hydrogen concentration, and pKa is the 2nd dissociation constant in this case. This approach, where only the upper part of the titration curve is measured and analyzed, does not affect significantly the value of pKa2 as was shown previously (17).
RESULTS
Phase behavior of fully hydrated dispersions of Cer-1-P
Our first series of studies was directed at determining the phase behavior of fully hydrated pure Cer-1-P. Note that in our article the lamellar gel and lamellar liquid crystalline phases are referred to as the gel and fluid phase respectively. Wide angle x-ray scattering experiments were carried out to measure the ordering of the hydrocarbon chains of Cer-1-P as a function of temperature. Acyl chain order is a measure of the fluidity of the lipid bilayer and the change from the gel to the biologically more relevant fluid phase is detected easily by the disappearance of a well-defined peak just below 4.5 Å. This spacing corresponds to the closest (hexagonal) packing of fully stretched (cylindrical) hydrocarbon chains. Fig. 1 shows the data recorded for pure Cer-1-P fully hydrated at pH 7.4 (at room T). The corresponding repeat spacings have been summarized in Table 1. Below 65°C a peak is clearly discernible with a spacing of 4.28 Å at 55°C (Table 1). This is characteristic for an acyl chain packing found in the lamellar gel phase (29). A well defined transition occurs near 65°C where the peak corresponding to the ordered acyl chain “disappears”. This “disappearance” of the hydrocarbon peak is the classic signature for the lamellar gel to fluid phase transition, putting the Tm for Cer-1-P estimated from these x-ray data at ∼65°C (29). Interestingly, at lower temperatures a second change occurs in the acyl chain order. Below 45°C the acyl chain peak around 4.28 Å splits into two peaks with spacings of 4.28 and 4.20 Å at 40°C. With increasing temperature the peak at 4.28 Å,which is the minor of the two peaks at 40°C, disappears in favor of the peak at 4.20, except that this latter peak now moves to larger values. The presence of two peaks in this scattering region indicates an orthorhombic unit cell with the splitting arising from a tilting of the hydrocarbon chains in the gel phase (30). Note that in the small angle scattering region an additional peak is present in all our data centered at ∼15.8 Å. This peak does not change position with temperature and is caused in all likelihood by an instrumental artifact. This peak did not affect the data analysis.
TABLE 1.
Bilayer repeat spacings taken from the 1st order Bragg peak, wide angle hydrocarbon spacings, and phase designation for fully hydrated Cer-1-P at pH 7.2
| First order bilayer peak
|
Wide-angle peaks
|
||||
|---|---|---|---|---|---|
| Temperature (°C) | d1, Å | d2, Å | d3, Å | d4, Å | Phase |
| 30 | 55.5 | – | 4.27 | 4.16 | Lc |
| 35 | 55.8 | – | 4.26 | 4.18 | Lc |
| 40 | 56.9 | – | 4.28 | 4.20 | Lc |
| 45 | 58.1 | – | ∼4.29 | 4.23 | Lc |
| 50 | 63.4 | shoulder | – | 4.26 | Lc–Lβ |
| 55 | 62.7 | 45.3 | – | 4.28 | Lβ |
| 60 | 61.8 | 43.7 | – | 4.30 | Lβ |
| 65 | 60.3 | shoulder | – | 4.32 | Lβ |
| 70 | 55.3 | – | – | ∼4.48 | Lα |
| 75 | 55.1 | – | – | ∼4.5 | Lα |
Some of the inferences drawn from the x-ray data are consistent with the DSC measurements, as shown in Fig. 2. For Cer-1-P dispersions that had been incubated at 4°C for several hours, two (broad) peaks are present initially in the thermographs, corresponding respectively to the low and high temperature phase transition observed in the x-ray scattering experiments. However, after several heating and cooling scans the first (at 44°C in the DSC scans) peak disappears, leaving only the high-temperature phase transition. The behavior of the low temperature peak is typical of the so-called subtransition, from crystalline (orthorhombic) to gel phase, that is commonly associated with saturated PCs (31). The endothermic peak centered at 63°C remains, but its midpoint temperature is shifted to 65°C after five heating and cooling cycles. This is in agreement with the x-ray data and is representative of the lamellar gel-fluid transition of phospholipids.
FIGURE 2.

DSC scans for fully hydrated Cer-1-P at pH 7.4. (A) Initial up-scan. (B) Fifth up-scan.
31P NMR was used to confirm the lipid organization in Cer-1-P/buffer dispersions. Representative data are shown in Fig. 3. The spectral shapes are asymmetric, with the low-field shoulder and high-field peak characteristic of the lamellar phases (32). The lineshapes are extremely broad and noisy at 30°C but less broad at 50°C, and relatively narrow at 70°C, as one would expect for the crystalline, gel, and fluid phases, respectively, in agreement with the x-ray and DSC data. A narrow isotropic component is also found in all the spectra, which is most likely caused by the formation of smaller vesicles.
FIGURE 3.

Phase behavior of pure Cer-1-P at full hydration. 31P NMR spectra of a dispersion of Cer-1-P at pH 7.4 (at room temperature) for 30, 50, and 70°C. The y-scale for the spectra at 30 and 50°C were adjusted to show the spectral features of these low temperature phases, thereby reducing the isotropic component.
GUVs formed by pure Cer-1-P
When the GUV electroformation method developed by Angelova et al. (27) was applied to pure Cer-1-P, vesicles with ∼10 μm diameter were readily formed (Fig. 4 A). Vesicles stained with the fluorescence dye DiIC18 were examined by confocal microscopy. Three-dimensional reconstructions of the vesicles (Fig. 4 B) showed a polyhedral, rather than spherical shape. The vesicles were formed at 75°C when the lipid is in the fluid phase (Figs. 1, 2, and 3), but could only be examined at 37°C in the gel or crystalline state. The polyhedral shape of the GUVs is likely a result of the visualization at this lower temperature.
FIGURE 4.

Fluorescence microscopy images of DiIC18-labeled GUVs composed of pure Cer-1-P. (A) General view of the region close to the platinum electrode. (B) 3D picture of a vesicle. The images were obtained at 37°C in 25 mM HEPES, pH 7.4. Scale bars = 10 μm.
Dissociation constant of Cer-1-P in PC and PC/PE bilayers
MAS 31P NMR was used to measure the second dissociation constant of Cer-1-P present at low (5 mol %) concentration in bilayers of PC or PC/PE. The phospholipids used in this part of the study contained unsaturated (oleoyl, 18:1c) chains because these give rise to fluid bilayers representative of biological membranes. All MAS NMR experiments were carried out in 100 mM salt and spectra were recorded at 37°C to mimic physiological conditions. Under these conditions, Cer-1-P mixes well with phospholipids in the fluid phase (see below).
First, we determined the pKa2 of Cer-1-P in extended bilayers of DOPC. MAS 31P NMR spectra for 5 mol % Cer-1-P in DOPC as a function of pH are shown in Fig. 5 A. The individual peaks of Cer-1-P and PC are well resolved as the minor low field peak and large high-field peak, respectively. The pH-dependent deprotonation of the phosphomonoester headgroup of Cer-1-P resulted in a large downfield shift of the peak associated with Cer-1-P. The PC peak remains constant over the pH range investigated (4.4 < pH < 9.4), indicating a constant negative charge, as expected and observed previously for the phosphodiester of PC (17,33). A similar behavior was observed for Cer-1-P in the PC/PE bilayer, shown in Fig. 5 B, except that the PE peak moved slightly to downfield values at high pH, reflecting the onset of deprotonation of the primary amine of the PE headgroup. The 1:1 molar ratio (PC/PE) for the determination of the effect of PE on the dissociation constant of Cer-1-P was chosen to ensure the formation of fluid lipid bilayers and falls well within the physiological range of PC/PE ratios found in biological membranes (34).
FIGURE 5.

Magic angle spinning 31P NMR pH titration curves for Cer-1-P. (A) Five mol % Cer-1-P in DOPC bilayers. (B) Five mol % Cer-1-P in DOPC/DOPE 1:1 bilayers. (C) Cer-1-P peaks plotted as a function of pH. Solid curves are nonlinear least squares fits to the data using a relation derived from the Henderson-Hasselbalch equation.
The chemical shift of Cer-1-P was plotted as a function of pH for both the PC and PC/PE bilayer systems to yield the titration curves shown in Fig. 5 C. The sigmoidal shape of the titration curve reflects the dissociation of the second proton from the phosphomonoester headgroup in a manner analog to the dissociation behavior observed previously for PA and lysoPA (17). The pKa2 for both titration curves was determined as described in Materials and Methods, and yielded the following values: 7.39 ± 0.03 for Cer-1-P in PC, and 6.64 ± 0.03 for Cer-1-P in PC/PE. Interestingly, we find that PE reduces the second dissociation constant of Cer-1-P by 0.75 pH units similar to the effect of PE on the dissociation of PA and lysoPA. These results will be discussed in terms of the electrostatic/hydrogen bond switch model introduced recently for PA.
Cer-1-P induces negative membrane curvature at low concentrations
We showed above that fully hydrated dispersions of Cer-1-P form bilayers at all investigated temperatures. An important related point is how Cer-1-P modifies the phase behavior of phospholipids that otherwise form lamellar structures. To shed light on this question, mixtures of the glycerophospholipid dielaidoylphosphatidyl-ethanolamine (DEPE) and Cer-1-P at various ratios were studied by DSC. Pure DEPE exhibits a lamellar gel-to-fluid endothermic transition at ∼37°C, and a lamellar-to-inverted hexagonal transition at ∼63°C. Cer-1-P was added at percent molar ratios ranging from 0.5 to 50. Representative thermograms are shown in Fig. 6. Cer-1-P has the effect of shifting the gel-fluid transition temperature up, as expected, because the corresponding transition of pure Cer-1-P, 65°C (Fig. 2) is higher than that of pure DEPE. Cer-1-P also has the effect of widening the peak associated with this transition, i.e., making the transition less cooperative (Fig. 6 A). The lamellar-hexagonal transition of DEPE is also widened by Cer-1-P (Fig. 6 B), but in this case the transition temperature is lowered. These trends are expressed numerically by the thermodynamic parameters: midpoint transition temperature (Tm), transition enthalpy (ΔH), and transition width-at-half-height (ΔT1/2), as functions of Cer-1-P concentration (Fig. 7).
FIGURE 6.

DSC thermograms corresponding to (A) the gel-fluid transition, and (B) the lamellar-to-inverted hexagonal transition of pure DEPE and DEPE/Cer-1-P mixtures in aqueous medium (third heating scans). The figures at the right-hand side of the thermograms indicate mol % Cer-1-P.
FIGURE 7.

Thermodynamic parameters of (A–C) the gel-fluid transition and (D–F) the lamellar-to-inverted hexagonal transition of pure DEPE and DEPE/Cer-1-P mixtures in aqueous medium. (A and D) Midpoint transition temperature. (B and E) Transition enthalpy change, ΔH. (C and F) Transition width at mid-height, ΔT1/2. Average values ± SD (n = 3).
The onset and completion temperatures of the phase transitions in the experiments shown in Fig. 6 can be used to draw a partial phase diagram for the DEPE/Cer-1-P system in excess water (Fig. 8). The phase diagram shows that the upper boundary of the Lβ phase (∼35°C) is virtually unaltered by the presence of Cer-1-P even at high concentrations. This is an indication that, at these temperatures, Cer-1-P does not mix with DEPE. This is an expected result considering that, in this temperature range, Cer-1-P is probably in the crystalline phase (Fig. 2). The phase diagram also shows that the lower boundary of the fluid Lα phase increases from ∼38°C to ∼48°C as more Cer-1-P is added, suggesting that the sphingolipid does mix with DEPE in the fluid state. Even low Cer-1-P concentrations (0.5 mol %) have the effect of lowering the upper boundary of the Lα phase, so that an increasing area of the phase diagram is occupied by the inverted hexagonal HII phase, either pure or mixed with Lα. The lamellar-hexagonal transition cannot be detected easily by DSC beyond 5 mol % Cer-1-P (Fig. 6). Because of this detection problem a boundary, that would be theoretically required according to Gibbs phase rule, between the Lα and HII phases at high Cer-1-P concentrations, could not be drawn in Fig. 8.
FIGURE 8.

Temperature-composition diagram (phase diagram) for the DEPE/Cer-1-P system in aqueous medium (excess water). Lβ, gel phase; Lα, liquid-crystalline or fluid phase; HII, inverted hexagonal phase. Average values ± SD (n = 3). In some cases the standard deviation is approximately the size of the symbols.
The presence of the lamellar gel (Lβ), lamellar fluid (Lα), and the inverted hexagonal (HII) phases, Fig. 8, can be ascertained by 31P NMR, in which the spectral lineshape is diagnostic for these phases (32) although the phase boundaries do not always exactly overlap with those derived from DSC experiments (35). Representative 31P NMR spectra of pure DEPE and two DEPE/Cer-1-P mixtures are plotted in Fig. 9. Pure DEPE gives rise to spectra typical of the gel phase at 30°C, fluid phase at 45 and 48°C, and hexagonal phase at 63°C (Fig. 9 A). Essentially the same lineshapes are observed with 5 mol % Cer-1-P (Fig. 9 B), but, in the presence of 10 mol % Cer-1-P (Fig. 9 B) a significant component of the hexagonal phase is already observed at 48°C. Also note that at 10 mol % (and higher, spectra not shown) Cer-1-P concentrations, a narrow isotropic component dominates the spectrum above 51°C. As mentioned above, this is probably the result of Cer-1-P giving rise to the formation of small vesicles (≤100 nM). These small vesicles may also contribute to the broadening of the DSC peak, particularly for the lamellar-hexagonal transition (Fig. 6).
FIGURE 9.

31P NMR spectra of aqueous dispersions of pure DEPE and DEPE/Cer-1-P mixtures. (A) Pure DEPE. (B) DEPE containing 5 mol % Cer-1-P. (C) DEPE containing 10 mol % Cer-1-P. Spectra were recorded at the temperatures indicated at the left of the figure, after 10 min temperature equilibration.
In general, the effects of Cer-1-P on the DEPE phase diagram are rather similar to those of ceramide, in particular the lack of mixing with DEPE in the gel phase, and the lowering of the lamellar-hexagonal transition temperatures (35). The latter property is an indication that Cer-1-P has a propensity to induce a “negative monolayer curvature” (36).
DISCUSSION
The realization in the last decade that simple sphingolipids (e.g., ceramide, or sphingosine) that had been considered as mere metabolic intermediates, play in fact a major role in cell signaling compels us to rethink their physical behavior, both in the pure state and as biomembrane components. The results reported in this study constitute perhaps the first detailed description of the biophysical properties of Cer-1-P. The main conclusion is that, although pure Cer-1-P in aqueous dispersions adopts a lamellar phase at least in the 10–75°C temperature range, its addition to glycerophospholipid bilayers facilitates the lamellar-hexagonal transition. The similarity of the dissociation behavior of Cer-1-P and phosphatidic acid may also be relevant.
Lamellar structure of Cer-1-P in excess water
A large number of experimental results (Figs. 1, 2, 3, and 4, Table 1) show that when dispersed in excess buffer at pH 7.4 in the presence of physiological salt concentrations, Cer-1-P adopts a lamellar configuration, either crystalline (sub-gel), gel, or fluid depending on temperature. This result might be expected from its clearly amphipathic structure, with the highly polar monoesterified phosphate group and the hydrophobic hydrocarbon chains. The structure is in fact similar to that of phosphatidic acid, which is known to form bilayers (37,38), with some major differences. In particular, Cer-1-P contains a −OH group on the third sphingosine carbon, and the acylchain (on the second sphingosine carbon) is attached to the backbone via an amine rather than an ester bond. These differences likely play an important role in distinguishing Cer-1-P from PA.
We find that the repeat distance of the lamellar phase (55–60 Å) is similar to those found for other glycerophospholipids (29). However, the presence of a crystalline (Lc) phase, separated from the gel (Lβ) phase by a clear subtransition (Figs. 1 and 2), was rather unexpected, because it has been found in only saturated glycerophospholipids (31). This is a distinguishing property of Cer-1-P and may be due to the additional hydrogen bond interactions facilitated by the hydroxyl and importantly the amine group in its backbone, clearly setting Cer-1-P apart from PA. Further proof for the tendency of Cer-1-P to self-organize in bilayers comes from the formation of 10–20 μm GUV (Fig. 4).
Cer-1-P in glycerophospholipid bilayers: phosphate group dissociation
Recently MAS 31P NMR has been shown to be a powerful tool for the investigation of the dissociation behavior of lipid monophosphates in extended lipid bilayers (MLVs) (17,18). We used this technique to determine, for the first time, the pKa2 of Cer-1-P in extended, mixed lipid bilayers of PC and PC/PE (1:1). Interestingly, we find that the pKa2 values are close but distinct from those of PA and LPA reported previously. These similarities and differences can be fully understood in terms of the chemical structure differences between these lipids. Interaction of Cer-1-P with proteins is discussed by using the newly described electrostatic/hydrogen bond switch model introduced previously for PA (18).
Several factors affect the ionization behavior of a lipid in a bilayer membrane. Most notable is the water/headgroup interface: increasing the overall negative charge carried by charged lipids residing at this interface increases the apparent pKa of an ionizable group. This is due to an increase of the interfacial proton concentration that lowers the interfacial pH. Similarly, a decrease in the net negative charge in the interface will lower the apparent pK of an ionizable group (33,39–41). In addition to electrostatic interactions, as described by the well-known Gouy-Chapman theory, hydrogen bonds also affect the pKa of an ionizable group (39,42). Protons from an ionizable group participating in a hydrogen bond dissociate less easily and will have a higher pKa then in the case where they do not form a hydrogen bond.
We find that the pKa2 of 5 mol % Cer-1-P in extended bilayers of DOPC is 7.39, which is slightly lower than the pKa2 of PA found previously, 7.92 (17). In fact the pKa2 of Cer-1-P is closer to that of the monoacyl glycerophospholipid LPA (7.47) than diacyl PA (17). To understand this difference between Cer-1-P and PA, we first have to consider the small differences in experimental conditions between the current study and the previous one on (L)PA. In the (L)PA study, the pKa values were determined for 10 mol % compared to 5 mol % used here. A lower concentration of Cer-1-P in PC (5 vs. 10 mol %) would have the effect of lowering the pKa, as described by the Gouy-Chapman theory. We indeed find that the pKa2 for Cer-1-P in PC is lower than that of PA and LPA. Swairjo et al. (43) found that for PA in SUVs the pKa of PA in the outer leaflet varied linearly with concentration. A small difference of 5 mol % however affected the pKa2 by <0.10 pH unit, which is indeed within the range of the pKa difference found between Cer-1-P and LPA. Why is the pKa2 of Cer-1-P almost identical to that of LPA? Like LPA, Cer-1-P contains a free hydroxyl group in its backbone structure. As in the case of LPA, we postulate that this hydroxyl group strongly affects the pKa2 of Cer-1-P. We propose that in the physiological pH range, i.e., when Cer-1-P carries at least one negative charge, the free hydroxyl group (i.e., is the H-bond donor) in the backbone hydrogen bonds to the negatively charged oxygen in the phosphomonoester (i.e., is the H-bond acceptor) forming an intramolecular H-bond. This competing hydrogen bond destabilizes the second proton of the phosphomonoester group (compared to the case of PA where no H-bond is present) and decreases the pKa2 as in the case of LPA (17). Recently, an identical intramolecular hydrogen bond was suggested in the related compound sphingosine-1-phosphate (S1P). Naor and co-workers (44) showed that conformations of S1P that contained this intramolecular H-bond between the backbone hydroxyl group and phosphomonoester headgroup had a lower energy than those that did not, providing a strong computational basis for the intramolecular H-bond in S1P and subsequently Cer-1-P.
To account for the effect of PE on the dissociation constant of Cer-1-P, we propose an identical mechanism to the case of (L)PA, where PE also lowers the pKa2. The positively charged amine group of PE is ideally suited to form hydrogen bonds with the phosphomonoester headgroup (i.e., to act as an H-bond donor). This hydrogen bonding destabilizes the second proton in the headgroup by weakening the electrostatic interactions and lowering the pKa2 of Cer-1-P in the PC/PE versus the PC bilayer. The effect of PE and the differences in chemical structure of PA, LPA and Cer-1-P follow an identical trend. The difference in pKa2 between the PC bilayer and the one containing PE is: 1.03 pH units for PA, 0.59 pH units for LPA, and 0.75 pH units for Cer-1-P. The influence of the difference in PC/PE ratio between the (L)PA (PC/PE = 1/3) and Cer-1-P (PC/PE = 1) experiments is expected to be small. It was shown (17) that the largest effect of PE on the chemical shift, and thus on the pKa of PA occurs in the PC/PE ratio range of ∼15/1. Addition of more PE changes the chemical shift only moderately. The difference in the effect of PE on the pKa2 of PA, LPA and Cer-1-P may be qualitatively understood by the following observations. The free hydroxyl group in the backbone (sn-2 position) of LPA lowers its pKa2 compared to that of PA, and we propose an identical mechanism for the free hydroxyl group of Cer-1-P (third carbon of the sphingosine backbone). However, the free hydroxyl group of Cer-1-P is one carbon further away from the phosphomonoester than in the case of LPA. This longer distance weakens any potential hydrogen bond, the strength of a hydrogen bond critically depending on its length (45). We indeed find that the effect of PE on Cer-1-P is larger than that on LPA. In LPA, the intramolecular hydrogen bond is expected to be considerable shorter than in the case of Cer-1-P, which effectively lowers the pKa2. In Cer-1-P, the free hydroxyl group is located farther from the phosphomonoester and its effect on pKa2 is less. Consequently, PE is able to lower the pKa2 more strongly than in the case of LPA.
These results point toward an identical dissociation mechanism for PA, LPA, and Cer-1-P, one that is governed by commonalities in their chemical structures. These findings have several important implications for Cer-1-P and lipid phosphomonoesters in general. The phosphomonoester headgroup of Cer-1-P and PA (and LPA), effectively is an electrostatic/hydrogen bond switch (18). In biomembranes its (Cer-1-P) overall charge is expected to be close to one (due to competing effects of a negative surface charge density and PE lipids). In analogy with PA, for Cer-1-P/protein interaction, we propose the electrostatic/hydrogen bond switch model, which is described in more detail below (also see (18)).
Proteins that are able to bind specifically to Cer-1-P will have to search for it in a pool of other anionic lipids such as PS. Lysine and/or Arginine groups in the binding region of these potential Cer-1-P binding proteins will initially have an electrostatic interaction with the membrane, similar to the situation for PA (46). Then, on binding to the membrane, the positively charged side chains are able interact electrostatically with their surroundings and form hydrogen bonds with negatively charged (−1) lipid phosphates. However, as soon as the side chain of lysine or arginine (the H-bond donors) encounters the phosphomonoester headgroup of Cer-1-P and comes into close enough proximity to form a hydrogen bond, the negative charge of Cer-1-P is expected to increase to (−2) due to further deprotonation of the phosphomonoester headgroup on the formation of a H-bond with the protein. This results in an actual docking of these side chains on the phosphomonoester. Conversely, Cer-1-P is expected to bind to proteins in its di-anionic form. We propose that specificity in protein binding between PA and Cer-1-P is achieved by the differences in their chemical structures, e.g., the more saturated nature of the hydrocarbon chains (leading to a different phase behavior), and most importantly the amine group connecting the acyl chain to the sphingosine backbone and the hydroxyl group at the third sphingosine carbon in Cer-1-P.
These results confirm the general validity of our previous findings on the dissociation properties of PA and LPA and will provide a basis for the understanding of the electrostatics/hydrogen bond interactions between lipid monophosphates and proteins.
Cer-1-P in glycerophospholipid bilayers: induction of nonlamellar phases
A remarkable property of Cer-1-P is that, although when dispersed in the pure state it gives rise to lamellar structures (see above), when added to glycerophospholipids Cer-1-P facilitates the lamellar-to-nonlamellar transition, i.e., facilitates the formation of the HII phase in DEPE (Figs. 6, 7, 8, and 9). Very low Cer-1-P concentrations (<1 mol %) clearly lower the lamellar-hexagonal transition temperature of DEPE, and at concentrations above 5 mol % a large portion of the phase diagram (Fig. 8) is occupied by HII phase. Concentrations in the 1–5 mol % range should not be considered too high or nonphysiological. Although the average Cer-1-P concentration in a cell membrane will never be as high as 5 mol %, elevated concentrations may occur transiently in localized domains as a result of specific activation events, as suggested in the case of ceramide (23). The “raft” hypothesis (47) has put forward the relevance of domains in many signaling events taking place at the plasma membrane. Localized changes in membrane structure induced by Cer-1-P may have important consequences, such as favoring the membrane docking of certain proteins or causing ion fluxes. Several lines of evidence indicate that lipids that promote inverted phases also favor protein insertion into membrane bilayers (21,22). But, even the transient formation of nonlamellar intermediates at the plasma membrane level will break down the permeability barrier and cause calcium and sodium influx that may, in turn, modulate protein activities in the nearby cytosolic region.
The somewhat paradoxal effect of Cer-1-P forming bilayers in pure form and, on the other hand, the destabilization of bilayer structures formed by other lipids has a precedent in the behavior of some phosphatidylethanolamines. As an example, egg phosphatidylethanolamine at neutral pH forms bilayers below 25°C (32,48,49) yet it favors nonlamellar phase formation in mixtures with phosphatidylcholine bilayers (50). Also, the high surface charge density in the pure Cer-1-P lipid dispersions likely prohibits the formation of the inverted hexagonal phase, similar to the behavior observed previously for PA (37).
It should also be pointed out that the behavior of Cer-1-P in solution differs from that of the related lipid ceramide. Ceramides, or at least the long-chain ceramides that are most commonly found in cell membranes, are much more hydrophobic than Cer-1-P, and can only exist when inserted in bilayers, or bound to specific proteins (16). The intervesicle exchange rate of ceramide is exceedingly slow, also because of its extreme hydrophobicity (51). The more polar character of Cer-1-P facilitates its exchange between proteins and bilayers, and even the interbilayer transfer. These possibilities deserve consideration when analyzing the mechanisms of Cer-1-P-dependent signaling and metabolic regulation, and the different effects of ceramide and Cer-1-P.
Acknowledgments
The authors thank Koert N.J. Burger and Pennti Somerharju for helpful discussions and practical advice. E.E.K. and S.K. acknowledge the practical support of Shin-Woong Kang (KSU), Leela Joshi (KSU), and Douglas Robinson of Iowa State and APS for their help with the synchrotron x-ray experiments.
This work was supported by the Spanish Ministry of Education and Science (BFU 2004-02955, BFU 2005-0695), the University of the Basque Country (F.M.G.) (9/UPV 00042.310-13552/2001), the U.S. National Science Foundation (DMR-0637221, CHE-0724082), and a Research Challenge award from the Ohio Board of Regents. Use of the Advanced Photon Source (APS) was supported by the U.S. Department of Energy, Basic Energy Sciences, Office of Science (Contract No. W-31-109-Eng-38). The Midwest Universities Collaborative Access Team sector at the APS is supported by the U.S. Department of Energy, Basic Energy Sciences, Office of Science, through the Ames Laboratory (Contract No. W-7405-Eng-82).
Any opinions, findings, and conclusions or recommendations expressed in this publication are those of the author(s) and do not necessarily reflect the views of the National Science Foundation.
Editor: Lukas K. Tamm.
References
- 1.Dressler, K. A., and R. N. Kolesnick. 1990. Ceramide 1-phosphate, a novel phospholipid in human leukemia (HL-60) cells. Synthesis via ceramide from sphingomyelin. J. Biol. Chem. 265:14917–14921. [PubMed] [Google Scholar]
- 2.Truett 3rd, A. P., and L. E. King, Jr. 1993. Sphingomyelinase D: a pathogenic agent produced by bacteria and arthropods. Adv. Lipid Res. 26:275–291. [PubMed] [Google Scholar]
- 3.Binford, G. J., and M. A. Wells. 2003. The phylogenetic distribution of sphingomyelinase D activity in venoms of Haplogyne spiders. Comp. Biochem. Physiol. 135:25–33. [DOI] [PubMed] [Google Scholar]
- 4.Sugiura, M., K. Kono, H. Liu, T. Shimizugawa, H. Minekura, S. Spiegel, and T. Kohama. 2002. Ceramide kinase, a novel lipid kinase. Molecular cloning and functional characterization. J. Biol. Chem. 277:23294–23300. [DOI] [PubMed] [Google Scholar]
- 5.Wijesinghe, D. S., A. Massiello, P. Subramanian, Z. Szulc, A. Bielawska, and C. E. Chalfant. 2005. Substrate specificity of human ceramide kinase. J. Lipid Res. 46:2706–2716. [DOI] [PubMed] [Google Scholar]
- 6.Hinkovska-Galcheva, V., L. A. Boxer, A. Kindzelskii, M. Hiraoka, A. Abe, S. Goparju, S. Spiegel, H. R. Petty, and J. A. Shayman. 2005. Ceramide 1-phosphate, a mediator of phagocytosis. J. Biol. Chem. 280:26612–26621. [DOI] [PubMed] [Google Scholar]
- 7.Swartz, K. J. 2006. Greasing the gears of potassium channels. Nat. Chem. Biol. 2:401–402. [DOI] [PubMed] [Google Scholar]
- 8.Pettus, B. J., A. Bielawska, S. Spiegel, P. Roddy, Y. A. Hannun, and C. E. Chalfant. 2003. Ceramide kinase mediates cytokine- and calcium ionophore-induced arachidonic acid release. J. Biol. Chem. 278:38206–38213. [DOI] [PubMed] [Google Scholar]
- 9.Pettus, B. J., A. Bielawska, P. Subramanian, D. S. Wijesinghe, M. Maceyka, C. C. Leslie, J. H. Evans, J. Freiberg, P. Roddy, Y. A. Hannun, and C. E. Chalfant. 2004. Ceramide 1-phosphate is a direct activator of cytosolic phospholipase A2. J. Biol. Chem. 279:11320–11326. [DOI] [PubMed] [Google Scholar]
- 10.Pettus, B. J., C. E. Chalfant, and Y. A. Hannun. 2004. Sphingolipids in inflammation: roles and implications. Curr. Mol. Med. 4:405–418. [DOI] [PubMed] [Google Scholar]
- 11.Gomez-Munoz, A. 2004. Ceramide-1-phosphate: a novel regulator of cell activation. FEBS Lett. 562:5–10. [DOI] [PubMed] [Google Scholar]
- 12.Gomez-Munoz, A., J. Y. Kong, K. Parhar, S. W. Wang, P. Gangoiti, M. Gonzalez, S. Eivemark, B. Salh, V. Duronio, and U. P. Steinbrecher. 2005. Ceramide-1-phosphate promotes cell survival through activation of the phosphatidylinositol 3-kinase/protein kinase B pathway. FEBS Lett. 579:3744–3750. [DOI] [PubMed] [Google Scholar]
- 13.Gomez-Munoz, A., J. Y. Kong, B. Salh, and U. P. Steinbrecher. 2004. Ceramide-1-phosphate blocks apoptosis through inhibition of acid sphingomyelinase in macrophages. J. Lipid Res. 45:99–105. [DOI] [PubMed] [Google Scholar]
- 14.Subramanian, P., R. V. Stahelin, Z. Szulc, A. Bielawska, W. Cho, and C. E. Chalfant. 2005. Ceramide 1-phosphate acts as a positive allosteric activator of group IVA cytosolic phospholipase A2 alpha and enhances the interaction of the enzyme with phosphatidylcholine. J. Biol. Chem. 280:17601–17607. [DOI] [PubMed] [Google Scholar]
- 15.van Blitterswijk, W. J., A. H. van der Luit, R. J. Veldman, M. Verheij, and J. Borst. 2003. Ceramide: second messenger or modulator of membrane structure and dynamics? Biochem. J. 369:199–211. [DOI] [PMC free article] [PubMed] [Google Scholar]
- 16.Goni, F. M., and A. Alonso. 2006. Biophysics of sphingolipids I. Membrane properties of sphingosine, ceramides and other simple sphingolipids. Biochim. Biophys. Acta. 1758:1902–1921. [DOI] [PubMed] [Google Scholar]
- 17.Kooijman, E. E., K. M. Carter, E. G. van Laar, V. Chupin, K. N. Burger, and B. de Kruijff. 2005. What makes the bioactive lipids phosphatidic acid and lysophosphatidic acid so special? Biochemistry. 44:17007–17015. [DOI] [PubMed] [Google Scholar]
- 18.Kooijman, E. E., D. P. Tieleman, C. Testerink, T. Munnik, D. T. Rijkers, K. N. Burger, and B. de Kruijff. 2007. An electrostatic/hydrogen bond switch as the basis for the specific interaction of phosphatidic acid with proteins. J. Biol. Chem. 282:11356–11364. [DOI] [PubMed] [Google Scholar]
- 19.Goni, F. M., and A. Alonso. 2000. Membrane fusion induced by phospholipase C and sphingomyelinases. Biosci. Rep. 20:443–463. [DOI] [PubMed] [Google Scholar]
- 20.Chernomordik, L. V., J. Zimmerberg, and M. M. Kozlov. 2006. Membranes of the world unite! J. Cell Biol. 175:201–207. [DOI] [PMC free article] [PubMed] [Google Scholar]
- 21.Alonso, A., F. M. Goni, and J. T. Buckley. 2000. Lipids favoring inverted phase enhance the ability of aerolysin to permeabilize liposome bilayers. Biochemistry. 39:14019–14024. [DOI] [PubMed] [Google Scholar]
- 22.Martin, C., M. A. Requero, J. Masin, I. Konopasek, F. M. Goni, P. Sebo, and H. Ostolaza. 2004. Membrane restructuring by Bordetella pertussis adenylate cyclase toxin, a member of the RTX toxin family. J. Bacteriol. 186:3760–3765. [DOI] [PMC free article] [PubMed] [Google Scholar]
- 23.Kolesnick, R. N., F. M. Goni, and A. Alonso. 2000. Compartmentalization of ceramide signaling: physical foundations and biological effects. J. Cell. Physiol. 184:285–300. [DOI] [PubMed] [Google Scholar]
- 24.Rouser, G., S. Fkeischer, and A. Yamamoto. 1970. Two dimensional thin layer chromatographic separation of polar lipids and determination of phospholipids by phosphorus analysis of spots. Lipids. 5:494–496. [DOI] [PubMed] [Google Scholar]
- 25.Bligh, E. G., and W. J. Dyer. 1959. A rapid method of total lipid extraction and purification. Can. J. Biochem. Physiol. 37:911–917. [DOI] [PubMed] [Google Scholar]
- 26.Hammersley, A. P., M. Hanfland, A. N. Fitch, and D. Hausermann. 1996. Two-dimensional detector software from the real detector to idealized image of two-theata scan. High Pressure Res. 14:235–248. [Google Scholar]
- 27.Angelova, M. I., S. Soleau, P. Meleard, J. H. Faucon, and P. Bothorel. 1992. Preparation of giant vesicles by external AC fields. Kinetics and application. Prog. Colloid Polym. Sci. 89:127–131. [Google Scholar]
- 28.Appleton, T. G., J. R. Hall, S. F. Ralph, and C. S. M. Thompson. 1989. NMR study of acid-base equilibria and other reactions of ammineplatinum complexes with aqua and hydroxoligands. Inorg. Chem. 28:1989–1993. [Google Scholar]
- 29.Luzzati, V. 1968. Biological Membranes: Physical Fact and Function. D. Chapman, editor. Academic Press, London. 71–123.
- 30.Nagle, J. F., and S. Tristram-Nagle. 2000. Structure of lipid bilayers. Biochim. Biophys. Acta. 1469:159–195. [DOI] [PMC free article] [PubMed] [Google Scholar]
- 31.Chen, S. C., J. M. Sturtevant, and B. J. Gaffney. 1980. Scanning calorimetric evidence for a third phase transition in phosphatidylcholine bilayers. Proc. Natl. Acad. Sci. USA. 77:5060–5063. [DOI] [PMC free article] [PubMed] [Google Scholar]
- 32.Cullis, P. R., and B. de Kruijff. 1979. Lipid polymorphism and the functional roles of lipids in biological membranes. Biochim. Biophys. Acta. 559:399–420. [DOI] [PubMed] [Google Scholar]
- 33.Tocanne, J. F., and J. Teissie. 1990. Ionization of phospholipids and phospholipid-supported interfacial lateral diffusion of protons in membrane model systems. Biochim. Biophys. Acta. 1031:111–142. [DOI] [PubMed] [Google Scholar]
- 34.van Meer, G., and H. Sprong. 2004. Membrane lipids and vesicular traffic. Curr. Opin. Cell Biol. 16:373–378. [DOI] [PubMed] [Google Scholar]
- 35.Sot, J., F. J. Aranda, M. I. Collado, F. M. Goni, and A. Alonso. 2005. Different effects of long- and short-chain ceramides on the gel-fluid and lamellar-hexagonal transitions of phospholipids: a calorimetric, NMR, and x-ray diffraction study. Biophys. J. 88:3368–3380. [DOI] [PMC free article] [PubMed] [Google Scholar]
- 36.Helfrich, W. 1973. Elastic properties of lipid bilayers: theory and possible experiments. Z. Naturforsch [C]. 28:693–703. [DOI] [PubMed] [Google Scholar]
- 37.Kooijman, E. E., V. Chupin, B. de Kruijff, and K. N. J. Burger. 2003. Modulation of membrane curvature by phosphatidic acid and lysophosphatidic acid. Traffic. 4:162–174. [DOI] [PubMed] [Google Scholar]
- 38.Ziegler, W., and A. Blume. 1995. Acyl chain conformational ordering of individual components in liquid-crystalline bilayers of mixtures of phosphatidylcholines and phosphatidic acids. Spectrochim. Acta [A]. 51:1763–1778. [Google Scholar]
- 39.Cevc, G. 1990. Membrane electrostatics. Biochim. Biophys. Acta. 1031:311–382. [DOI] [PubMed] [Google Scholar]
- 40.Langner, M., and K. Kubica. 1999. The electrostatics of lipid surfaces. Chem. Phys. Lipids. 101:3–35. [DOI] [PubMed] [Google Scholar]
- 41.McLaughlin, S. 1989. The electrostatic properties of membranes. Annu. Rev. Biophys. Biophys. Chem. 18:113–136. [DOI] [PubMed] [Google Scholar]
- 42.Boggs, J. M. 1987. Lipid intermolecular hydrogen bonding: influence on structural organization and membrane function. Biochim. Biophys. Acta. 906:353–404. [DOI] [PubMed] [Google Scholar]
- 43.Swairjo, M. A., B. A. Seaton, and M. F. Roberts. 1994. Effect of vesicle composition and curvature on the dissociation of phosphatidic acid in small unilamellar vesicles–a 31P-NMR study. Biochim. Biophys. Acta. 1191:354–361. [DOI] [PubMed] [Google Scholar]
- 44.Naor, M. M., M. D. Walker, J. R. Van Brocklyn, G. Tigyi, and A. L., Parrill. 2007. Sphingosine 1-phosphate pKa and binding constants: intramolecular and intermolecular influences. J. Mol. Graph. Model. 26:519–528. [DOI] [PMC free article] [PubMed] [Google Scholar]
- 45.Jeffrey, G. A., editor. 1997. An Introduction to Hydrogen Bonding. Oxford University Press, New York. 303 p.
- 46.Testerink, C., and T. Munnik. 2005. Phosphatidic acid: a multifunctional stress signaling lipid in plants. Trends Plant Sci. 10:368–375. [DOI] [PubMed] [Google Scholar]
- 47.Simons, K., and E. Ikonen. 1997. Functional rafts in cell membranes. Nature. 387:569–572. [DOI] [PubMed] [Google Scholar]
- 48.Castresana, J., J. L. Nieva, E. Rivas, and A. Alonso. 1992. Partial dehydration of phosphatidylethanolamine phosphate groups during hexagonal phase formation, as seen by i.r. spectroscopy. Biochem. J. 282:467–470. [DOI] [PMC free article] [PubMed] [Google Scholar]
- 49.Reiss-Husson, F. 1967. J. Mol. Biol. 25:363–382 [Structure of liquid-crystalline phases of different phospholipids, monoglycerides, sphingolipids in the absence or presence of water]. [DOI] [PubMed] [Google Scholar]
- 50.Seddon, J. M. 1990. Structure of the inverted hexagonal (HII) phase, and non-lamellar phase transitions of lipids. Biochim. Biophys. Acta. 1031:1–69. [DOI] [PubMed] [Google Scholar]
- 51.Bai, J., and R. E. Pagano. 1997. Measurement of spontaneous transfer and transbilayer movement of BODIPY-labeled lipids in lipid vesicles. Biochemistry. 36:8840–8848. [DOI] [PubMed] [Google Scholar]