Abstract
Large-scale conformational changes in proteins that happen often on biological time scales may be relatively rare events on the molecular dynamics time scale. We have implemented an approach to targeted molecular dynamics called end-point targeted molecular dynamics that transforms proteins between two specified conformational states through the use of nonharmonic “soft” restraints. A key feature of the method is that the protein is free to discover its own conformational pathway through the plethora of possible intermediate states. The method is applied to the Shaker Kv1.2 potassium channel in implicit solvent. The rate of cycling between the open and closed states was varied to explore how slow the cycling rate needed to be to ensure that microscopic reversibility along the transition pathways was well approximated. Results specific to the K+ channel include: 1), a variation in backbone torsion angles of residues near the Pro-Val-Pro motif in the inner helix during both opening and closing; 2), the identification of possible occlusion sites in the closed channel located among Pro-Val-Pro residues and downstream; 3), a difference in the opening and closing pathways of the channel; and 4), evidence of a transient intermediate structural substate. The results also show that likely intermediate conformations during the opening-closing process can be generated in computationally tractable simulation times.
INTRODUCTION
Voltage-gated potassium ion channels are multimeric integral membrane proteins that form a pore across excitable cell membranes. Their primary role is to regulate the flow of potassium ions, preferentially to sodium ions, across the membrane. Several decades of research have led to the understanding that 1), the choice of permeant ionic species occurs at the selectivity filter, a region composed of a signature sequence of amino acids, Gly-aromatic-Gly, whose carbonyl moieties line the channel pore (1–3); and 2), conformational changes accompany channel function.
Early evidence of the existence of K+ channel conformations associated with channel gating was shown in electrophysiological measurements of the blocking of squid axon K+ channels by alkylammonium ions at the intracellular end of the channel (4–6). Subsequently, site-directed spin-labeling combined with electron paramagnetic resonance spectroscopy has shown that during the opening of the K+ channel KcsA, the inner helix swings away from the channel long axis while undergoing an internal rotation and also that the configuration of the outer vestibule is not greatly altered from the closed state (7). The essence of that study was captured by Mashl et al. (8) to develop a series of open and partially open model structures of KcsA based on the pivoting of the transmembrane helices at a time when there were no known open K+ channel structures. Another open model of KcsA was developed by Biggin and Sansom (9) by placing the closed channel in a hydrated membrane environment and growing a van der Waals sphere centered at the intracellular gate region.
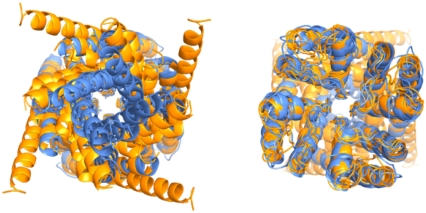
As shown by the increasing number of solved K+ channel structures, it is evident that largest conformational change in the permeation pathway associated with opening and closing the channel is found toward the intracellular end of the channel (3,10–17). This pattern is illustrated in Fig. 1, where ribbon traces of channel protein backbones from the pore domains from various closed and open K+ channel structures are superposed. The superposition of structures shows that the lumenal widening occurs along the intracellular portion of the S6 inner helix and that there is a less substantial reorientation of the S5 outer helix.
FIGURE 1.
Superposition of pore domains of potassium channels of known structure as seen from the intracellular (left) and extracellular (right) ends using a ribbon representation. Open (orange) forms include the MthK, KvAP, and Shaker structures, and closed (blue) forms include the KcsA, KirBac 1.1, and NaK structures. Orientation of each channel was accomplished by least-squares fitting each structure onto KcsA using the Cα atoms ranging from the pore helix to glycine hinge on the S6 inner helix.
These structures suggest that K+ channels undergo large-scale motions on gating. Although the gating events may be frequent on the time scales associated with the channel's biological function, they would occur much less frequently when studied on the molecular dynamics time scale (18). A number of approaches have been devised in an attempt to overcome this disparity, and they are briefly reviewed below:
Normal Mode Analysis (19–21). The degrees of freedom of the motion are calculated at discrete times within a harmonic approximation, and those calculations show directions in multidimensional conformational space in which the sampling of the protein's energy landscape can be improved. Normal mode analysis applied to the KcsA channel has showed inter- and intrasubunit hinge points during the gating process (22). Normal mode analysis has also been used to study the nicotinic acetylcholine receptor (23–26) and the MscL channel (27).
Gaussian elastic network models. A network of springs represents interactions between selected atoms, and the normal modes of the network are analyzed. Gaussian elastic network models applied to KcsA, KirBac, MthK, KvAP, and Shaker channels has shown a shared gating mechanism with two dominant modes: one that represents a global rotation that widens the pore and another that deforms the cylindrical symmetry of the pore (28,29). An anisotropic elastic network model has been used to study the nicotinic acetylcholine receptor transmembrane domain (30).
Principal component analysis (31–35). The degrees of freedom of the motion are calculated using several system configurations within a short time interval and are done so without assuming the modes to be harmonic. By regular re-evaluation of the principal components over several sequential time intervals, the most dominant collective motions are identified for incorporation as an applied force into the molecular dynamics (MD) algorithm.
Monte Carlo based methods. In the kinetic Monte Carlo reaction path following method, the protein is subject to large-scale conformational transitions along a predefined reaction coordinate (36). In cases where either the initial or the target conformation is known, a normal-modes analysis may be combined with a Monte Carlo scheme for predicting directions for candidate conformational changes. This combined technique, called Monte Carlo normal mode following, was developed for studying the gating mechanism of the gramicidin channel (37,38).
Targeted molecular dynamics (TMD) methods. The protein is guided to a conformation of interest by superposing external forces onto the usual deterministic MD forces. In one type of TMD, the applied forces are a function of the distances between the current and target positions of the atoms ((39) and refs. therein); a harmonic potential function is frequently used. TMD has been applied to a variety of systems: e.g., conformational changes in ras proteins (40), the opening of chaperonin GroEL (41), the motions of F1-ATPase (42), the docking of guanine nucleotides with glutamate receptors (43), the opening of the KcsA channel (44), and C-loop closure and gating of the nicotinic receptor ion channel (23). Another type of TMD is steered molecular dynamics in which the simulation is accelerated along a reaction coordinate of interest by applying forces in some specified time-dependent manner (45,46). Steered molecular dynamics has been applied to the KvAP channel (47) and to the mechanosensitive channel of large conductance, MscL (48).
In this study we describe a “soft” restraints method we call end-point targeted molecular dynamics (EPTMD) to permit a protein to find trajectories between two known conformational states. Through the use of the restraints, we induce gating motions in the channel to occur more often than would be expected by using an unrestrained simulation method. Our laboratory initially instituted soft restraints to study membrane proteins in the absence of a membrane because of the lack of sufficient compute power to include explicit membranes (49). The purpose of the restraints was to prevent the protein secondary structure from becoming degraded, but to freely permit the high-frequency dynamics to proceed as naturally as possible. The form of the restraint that captured that property was an exponential relaxation to a reference structure. We also used these restraints to evaluate the role of channel protein flexibility in facilitating transport through the channel (50). When we revisited gramicidin channel simulations with explicit membrane and no artificial restraints, we found that the soft restraints had captured the dynamics realistically (51,52). The restraints were seen to maintain the secondary structure of the protein channel but not interfere with the natural rapid motions. In this study we extend the method of soft restraints that was used previously to successfully maintain the native secondary structure in the studies cited previously, to imposing a soft bias to induce large conformational changes in a protein.
The main topic of this study will be to explore the nature of the induced transitions using molecular dynamics simulations. We consider the opening and closing transitions of the Shaker Kv1.2 channel with the open and closed end states structurally defined as predicted by the Rosetta structure prediction program (53). We postulate that the opening and closing transitions are effected by sinusoidally varying the strengths of the soft restraints connecting the protein to both of the two states. Because the restraints cause only very small changes in the position of every atom at each time step, the ensemble as defined by the velocity distributions is unchanged. The transitions caused by the positional biasing are thus designed to emulate microscopically reversible isothermal transitions, which we postulate characterizes the actual channel gating.
In the sections below we shall present the models simulated, followed by the mathematical details implementing the soft restraints used in EPTMD and by a structural analysis of the conformational cycles, and we conclude with a summary and discussion.
METHODS
Protein models
The x-ray structure of the Shaker Kv1.2 channel from rat (16) shows six well-defined transmembrane helices, which form the voltage sensing and pore domains but have incomplete electron density for the linker sections within the voltage sensing domain. Modeling of the channel using the Rosetta membrane protein method (54) has led to completed structures for the open and closed states (53). Because the structure of the closed Shaker channel has not been determined crystallographically, the Rosetta closed model is the most definitive currently available. The Rosetta open structure was found to have a root mean-square deviation (RMSD) over 260 residues of 2.0 Å (53) from the native x-ray structure with resolution, 2.9 Å (16). For convenience, we shall refer to the Rosetta pair of structures as the “full” model channels. In addition, we have prepared an open model of the permeation pathway from the native x-ray structure, using the S5 through S6 helix section, and a closed model by homology modeling the protein sequence ungapped onto the high-resolution KcsA x-ray structure (PDBid: 1K4C) using MODELLER (55). We shall refer to this latter pair of structures as the “pore domain” model channels. The termini of the structures were capped with neutral, nontitratable moieties (NH2 and methyl groups), and two potassium ions with an intervening water molecule were placed at crystallographic positions in the selectivity filter in their most stable configuration (56).
Residues in the full and pore domain models in both open and closed conformations were assigned their default ionization states at neutral pH and then energy minimized using the simulation package GROMACS (57,58) using the force field and run parameters listed below. Additionally, during the energy minimization, harmonic position restraints toward the appropriate reference structure were applied to the backbone main chain atoms in the transmembrane helices and to the potassium ions with force constants of 5000 and 1000 kJ mol−1 nm−2, respectively. The intervening water molecule was unrestrained.
Ionization states for use in molecular dynamics were calculated for the energy-minimized open and closed pore domain channels with two potassium ions and no intervening water molecule in the selectivity filter. Electrostatic potentials at the titratable sites were computed with version 5.1 of the University of Houston Brownian Dynamics (UHBD) program (59) and were analyzed using a clustering method (60–62) to treat multiple interacting titration sites. A uniform protein dielectric constant (4 or 20) and a solvent dielectric of 80 were used. The ionic strength was set to 150 mM, and the temperature was 310 K. Atomic parameters were those of the PARSE parameters (63). A probe radius of 1.4 Å was used to delineate the dielectric boundary between protein and solvent. Electrostatic potentials were solved on a 50 × 50 × 50 lattice with spacing 2 Å and were refined using a series of three additional focusing grids of sizes 30 × 30 × 30, 36 × 36 × 36, and 50 × 50 × 50 with spacings of 1.0, 0.5, and 0.25 Å, respectively, centered on the titrating site of interest. The apparent pKa values and partial charges of the side chains were computed assuming a solution pH of 7. As a result, all residues were found in their default ionization states according to standard pKa values of isolated residues bulk water at pH 7, with the exception of His-418, which was protonated.
Molecular dynamics results for both the pore domain and the full model will be presented below. In general, the differences between the two models were not significant. Some minor variations will be noted.
Soft restraints in molecular dynamics
Molecular dynamics simulations were carried out using GROMACS that integrates the equations of motion using the leap-frog algorithm (64). The leap-frog algorithm uses the positions r(t) and forces F(t) at time t and the velocities v(t) at time t–Δt/2 to update the positions of the particles:
 |
(1a) |
 |
(1b) |
where Δt is the time step and m is the atomic mass. In the method of soft positional restraints, the protein is gently restrained toward a set of atomic coordinates, {R0}, representing a particular reference secondary structure that is supplied by, e.g., NMR or x-ray crystallographic studies. A review of the structural constraints pertaining to the Shaker channel has been presented elsewhere (65).
The restraints are of the form of a first-order, nonelastic relaxation process:
 |
(2) |
where b(t) is a displacement and τ is a relaxation constant. The resulting modified leap-frog algorithm is written as
 |
(3a) |
 |
(3b) |
It has been pointed out that targeted molecular dynamics schemes may favor the larger conformation changes to happen before the smaller ones (48). However, the value of τ in Eq. 2 is chosen such that the displacements generated within each time step are, on average, very small compared with those due to thermal motion. For typical values of 2-fs time steps and 100-ps relaxation time constant, the distance an atom is moved during a time step is 1/50,000 of the distance between its instantaneous position and its position in the reference structure.
Equation 3 represents a general framework for transforming a protein between specific conformational states using the soft positional restraints approach, and as such it does not inherently imply any structural symmetry constraints in their usage with the homomeric channels studied in this work. To apply this approach to ion channels, we specify an open reference state and a closed reference state and postulate a mathematical description for transforming the channel between those two states. We let τmin be the fastest relaxation time allowed toward either reference state, i.e., maximum constraint, and let T be the transition time for the transformation. If the simulation is started with an equilibrated open channel, then the coupling of the protein to the open state will be at its maximum, and the coupling to the closed state will be absent. To transform the channel to the closed state, the coupling to the closed state increases from zero simultaneously as the coupling to the opened state decreases to zero. Our mathematical description of this process is provided by the expressions
 |
(4a) |
 |
(4b) |
where τopen(t) and τclosed(t) are the time-dependent soft-restraint relaxation constants to the opened and closed states, respectively. It can be seen from Eq. 4 that the system will cyclically vary between being biased toward the open state or the closed state. The nature of the bias is to cause only a very small change in the position of each atom at each time step so that the ensemble defined by the velocity distribution is unchanged.
Molecular dynamics setup
Molecular dynamics simulations were carried out using the GROMACS ffG43a2 force field (66) with an implicit solvent as represented by the distance-dependent dielectric function, ɛ = 1/r, where r is the distance in Angstroms. Electrostatic and Lennard-Jones 6–12 interactions were cut off at 18 Å. Nonbonded pair lists were updated every time step, set at 2 fs. The entire system was coupled to a Berendsen thermostat (67) at a temperature of 310 K with a time constant of 2 ps.
A series of preliminary simulations was carried out to determine an appropriate value of τmin. Open and closed end-point structures of the full and pore domain models were soft-restrained to the appropriate reference structure and equilibrated for several values of τmin. (Throughout this work, the soft restraints were applied to the backbone main chain atoms (C, Cα, N) of only the transmembrane helices and to the two potassium ions in the selectivity filter; the linker and loop regions, as well as the water molecule in the selectivity filter, were unrestrained.) Calculation of the root mean-square fluctuation of the restrained atoms as a function of τmin showed that for τmin values of 150 ps and greater (i.e., a looser restraint), the average temperature of the system was 308 K, which was within one deviation (equal to 6 K) of the temperature set point. For more stringent restraints, the average temperature was found to deviate substantially from the set point. The value of τmin was therefore fixed at 150 ps for all transition times, T.
ANALYSIS
Trajectory data saved every 1 ps was analyzed using a combination of GROMACS tools and locally written code. Cross-sectional profiles of the channel lumens were computed according to the SAXA method (68). SAXA estimates the cross-sectional area by first decomposing the lumenal space into wedges extending from the center of the lumen as defined by HOLE (69) to the inner surface of the protein and then summing the areas of the wedges. The center determined by HOLE is the center of the largest sphere that can fit into the channel at that position along the channel axis. The same atomic radii (70) were used in both the HOLE and SAXA analyses.
Residues near the bottleneck region were identified in the following way. For selected snapshots from the molecular dynamics trajectory, we identify the closest residues as seen by a point particle traversing the bottleneck regions as it follows the 3D path formed by the HOLE centers. A 1-Å wide window was centered on each HOLE center coordinate and the distances from the HOLE center to every protein atom located in the window was computed. From the list of center-to-atom distances, the N (= 1 or 5) smallest values were selected and the corresponding residues identified. The lists from all snapshots were combined, and the N closest residues were selected.
Histograms were fitted to a sum of unnormalized Gaussian distributions (one for each peak) with variable centers and widths using the standard least-squares method. In the case of analyzing the pore domain model, a convergent fit was facilitated by estimating and fixing the value of selected centers as described below.
Hydrogen bonds were determined on the basis of a geometrical criterion. A hydrogen bond was considered present if the hydrogen-donor-acceptor angle did not exceed 30° and if the donor-acceptor distance was not >3.5 Å. Nitrogen atoms as acceptors were included by default in the hydrogen bond determination. The difference in excluding them as acceptors shall be mentioned below.
RESULTS
Equilibration of end-point states
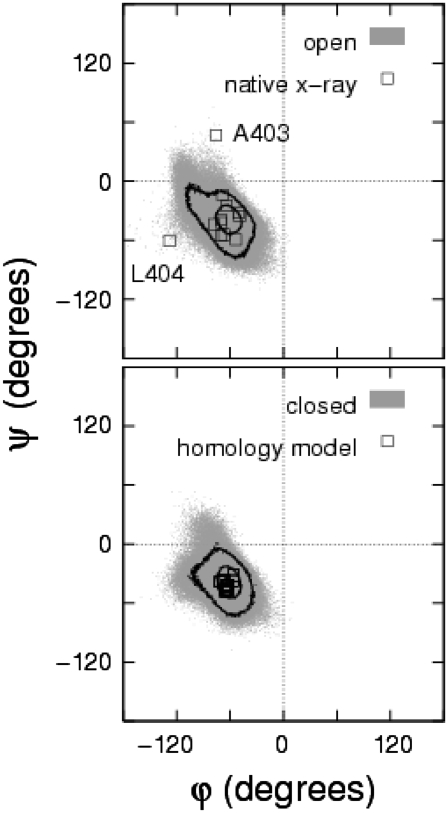
The pore domain model and full model channels in the closed (open) state were soft-restrained to their respective closed (open) end-point reference structures and were equilibrated using molecular dynamics. Fig. 2 shows the resulting backbone torsional angles distributions of S6 inner helix residues A397–V408 of the open and closed state of the pore domain model. The dihedral angles are found generally to correspond to the α-region for both the energy-minimized starting conformation and for the fluctuating equilibrium conformations. The highest contour levels are located in the α-preferred region, indicating that the equilibration process under soft restraints allows the protein to maintain reasonably good protein health. Residues A403 and L404 in the native x-ray open structure and in the Rosetta-based full model open structure were found to be in the “additional allowed” regions as found by PROCHECK (71). Root mean-square fluctuation values of the S5 and S6 transmembrane helices in the pore domain model, relative to the reference states, were calculated to be 1.49 and 1.57 Å, respectively, for the open channel and 1.05 and 1.21 Å, respectively, for the closed state channel, were found to be comparable to the resolution of generic high-resolution x-ray protein structures. Below we shall give further consideration to RMSD values in the context of conformational cycling of the channel.
FIGURE 2.
Ramachandran plots for residues A397–V408 of Shaker for the native open (top) and homology-based, pore domain closed (bottom) model states undergoing ∼10 ns of fluctuations at equilibrium under a single soft restraint (τ = τmin = 150 ps) (gray shading). Data for the end-point reference models are indicated (squares). Contours denote probability levels of 5 × 10⁻³ and 5 × 10⁻⁴; lower levels were not distinct. The results for the full (Rosetta) model set were not significantly different.
Conformational cycling
Backbone dynamics
Sequence analysis of the S6 inner helix shows a highly conserved glycine (the glycine “hinge”) that is common to nearly all K+ channels and a Pro-Val-Pro (PVP) motif that is conserved among Shaker, Shaw, and Shal channel families (72). Because it is believed that these residues are of particular significance for channel opening and closing (73–81), it is important to validate the effects of the cycling on the conformational dynamics. In particular, we would like to find an approximate upper bound on the cycling rate of the channel that preserves the secondary and tertiary structure of the channel.
We carried out a series of simulations of cycle lengths 2, 10, and 20 ns using the pore domain model channel and computed the time course of the RMSD values of the soft-restrained portions of the backbone, namely, the S5 and S6 helices, from the end-point reference structures. The histogram of RMSD values (not shown) provided the most probable RMSD that is associated with the passage of the channel through the conformational neighborhoods of the reference structures. Table 1 shows the results for these cycle lengths as compared with a channel that has been equilibrated under a single soft restraint to the corresponding reference state. The effect of cycle time on the (most probable) RMSD value is fairly small and is on the order of a few tenths of an ångström. The results suggest that any of these cycle times would preserve the channel tertiary structure. In addition, we note that the RMSD tends to decrease slightly as the cycle length increases, and for this reason we have carried out further analyses using the 10- and 20-ns cycles. Also, because the focus of this work is primarily on the permeation pathway of the channel, we have assumed that the cycle rates that apply to the pore domain model also pertain to the full model channel with its six transmembrane helices. Snapshots of the full model channel at different time points during the cycles seemed consistent with this assumption.
TABLE 1.
Most probable RMSDs of the S5 and S6 transmembrane helices (for the Shaker pore domain model channel) relative to the end-point reference states
| S5 RMSD (Å)
|
S6 RMSD (Å)
|
|||
|---|---|---|---|---|
| Cycle time (ns) | (Relatiave closed) | (Relatiave open) | (Relatiave closed) | (Relatiave open) |
| 2 | 1.68 | 1.32 | 2.20 | 1.50 |
| 10 | 1.34 | 1.10 | 2.20 | 1.32 |
| 20 | 1.38 | 1.16 | 2.16 | 1.24 |
| ∞ (equilibrated) | 1.49* | 1.05* | 1.57* | 1.21* |
Values for the equilibrated channel were based directly on the prepared energy-minimized structures with no history of cycling simulations. RMSD, root mean-square deviation.
Averaged value.
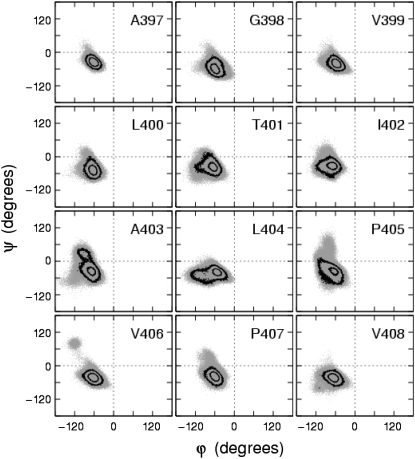
To verify whether the soft restraints provide for reasonable protein structure, Fig. 3 shows a series of Ramachandran plots for a range of residues (A397–V408) located along the permeation pathway that includes the glycine hinge (G398) and PVP region (P405–P407), for the pore domain model channel undergoing 20-ns cycles. The probability contours indicate that the highest probabilities are within the α-preferred region. In comparing these results to those of the same channel undergoing conformational cycles twice as fast with 10-ns cycles, it was observed that residues A397–I402 produced similar results, whereas residues A403–V408 showed minor qualitative differences in that the probability density in the β-preferred region was seen to increase for residues A403 and P405–V406 from the PVP region.
FIGURE 3.
Ramachandran plots of residues near the glycine hinge (G398) and Pro-Val-Pro (P405–P407) regions of the S6 inner helices of native open Shaker over several 20-ns cycles. Backbone angles (gray) from all four monomers are superposed (gray). Contours as in Fig. 2.
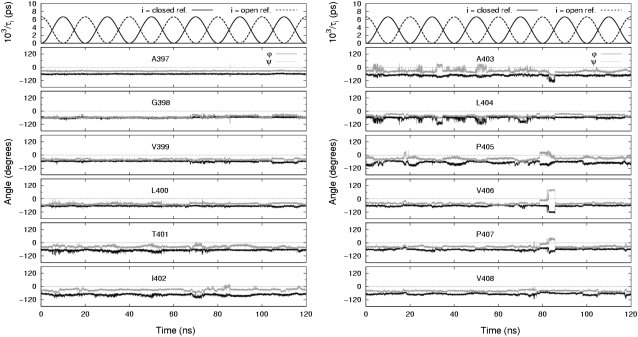
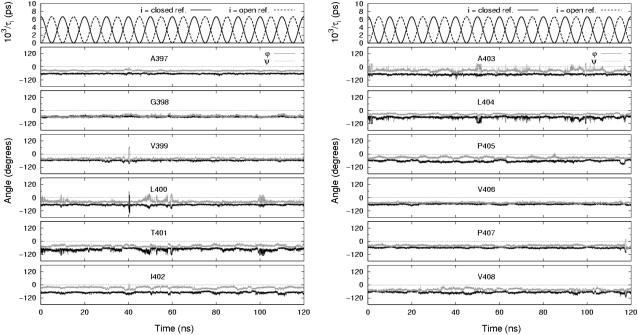
Another way to examine the backbone fluctuations is by time series trajectories. Fig. 4 shows the backbone dihedral trajectories for a single monomer from the pore domain model channel undergoing 20-ns cycles, and Fig. 5 shows those for a different monomer from the full model channel undergoing 10-ns cycles. In both figures the fluctuations at the glycine hinge (G398) and nearby residues are seen to have a small amplitude whereas residues near and including the PVP region (A403–P407) exhibit somewhat larger fluctuations. In particular, the fluctuations in P405 are seen to follow closely the underlying conformational cycling of the channel.
FIGURE 4.
Time series of relaxation constants and backbone torsional angles. Trajectories for residues including the glycine hinge and PVP region (A397–V408) are shown for a single monomer in the pore domain modeled channel undergoing 20-ns cycles.
FIGURE 5.
Same as in Fig. 4, but for the full model channel undergoing 10-ns cycles.
Evidence of coordinated motion among residues near and including the PVP region in the pore domain model is seen in Fig. 4. The excursion of V406 is seen clearly as the isolated cluster of conformations in the β-region of the Ramachandran plot in Fig. 3. On further inspection, Fig. 4 shows that V406 had started in the α-region, had passed to a nearby conformational basin, remaining there for ∼7 ns while passing through the 80 ns time point of the simulation, and then had jumped to the isolated cluster; shortly after, V406 returned to the favorable α-region. In another simulation in which the pore domain model channel was subject to 10-ns-long cycles for 120 ns, this sudden jumping behavior was not observed. Evidence of coordination in the full model channel is seen in Fig. 5 for residues L400–T401 and A403–L404. In none of the simulations did we observe, in terms of backbone dihedral angles, any readily discernible synchronized activity between channel monomers.
Backbone dihedral trajectories for residues downstream from the PVP region were also examined. As with residues A397–V408, the backbone torsional angles of I409–H418 were found to correspond to the Ramachandran α-region, but other regions were found to be sampled as well. Starting at approximately residue F416 and downstream, dihedral angles for residues often extended into the β-allowed and β-preferred regions, and, for larger amplitude motions, into the left-handed α-helix region. The large amplitude motions are likely to be a result of those residues' location near the end of the S6 inner helix.
The trajectories in Figs. 4 and 5 are typical of individual monomer trajectories in the simulations of both models, especially the relatively small amplitude of the fluctuations at the glycine hinge as compared with the PVP region.
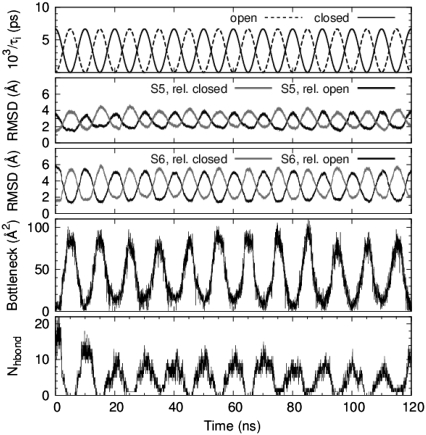
Fig. 6 shows a summary of several structural properties of the pore domain of the full model channel during conformational cycling. In general, the sinusoidal variation of the soft-restraint time constants (see Eq. 4) at the top of Fig. 6 shows good correspondence to the cyclical variations in the computed properties. Backbone RMSD values (relative to the energy-minimized end-point states) reach their individual peak values at or near the open and closed states during each cycle. As a whole, the RMSD values vary only slightly between one cycle and another. Both S5 and S6 helices are calculated to have a closest approach to the reference configurations of ∼2 Å RMSD, and the maximal RMSD for the S6 inner helix (∼6 Å RMSD) is larger than that of the S5 helix (∼4 Å).
FIGURE 6.
Time series of relaxation constants, given by Eq. 4, and various structural properties of the full model channel undergoing 10-ns cycles. (Top to bottom) RMSD of α-carbons of the S5 and S6 transmembrane helices relative to the energy-minimized open and closed end-point structures. Bottleneck size of the channel computed from cross-sectional area profiles of the lumen (sampling rate, 20 ps). Number of hydrogen bonds between S6 inner helices below the glycine hinge for residues G398–T421.
Channel geometry and bottleneck
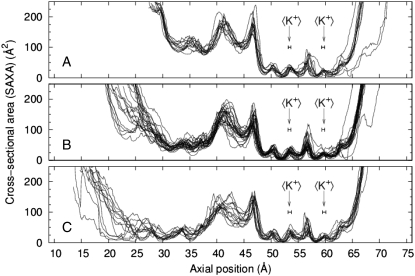
Samples of cross-sectional area profiles as computed by SAXA (see Methods) for the entire length of the full model channel are shown in Fig. 7 for times corresponding to the end-points and mid-points of the 10-ns cycles. Although there is very little variation from cycle to cycle among open channel profiles, there is significantly more variation among mid-point and closed end-point profiles, particularly in the ∼10-Å region at the intracellular mouth of the channel. The profiles show the presence of a “bottleneck” that is found anywhere along an ∼20-Å-wide range located toward the intracellular end of the channel. The time series of the bottleneck size in Fig. 6 shows a periodic variation that corresponds to the variations of the soft-restraint relaxation time constants.
FIGURE 7.
Superposed solvent-accessible cross-sectional area (SAXA) profiles of the full model channel undergoing 10-ns cycles taken from precisely the start, middle, and end of each 5-ns transition. Channels are oriented with the intracellular end at left. Arrows indicate the average positions (error bars, ±σ) of the two potassium ions in the selectivity filter for the profiles shown here.
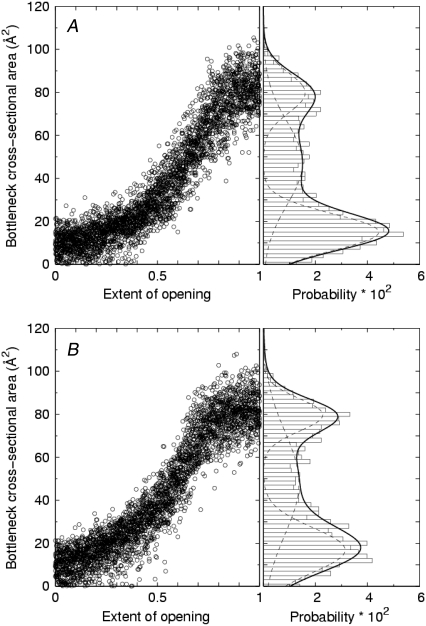
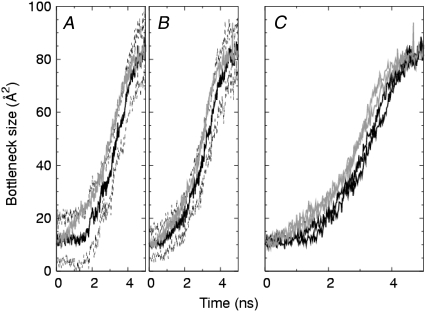
Further analysis of the bottleneck sizes for the full model channel is shown in Fig. 8, where the cycles have been superposed and the corresponding probability distribution of bottlenecks sizes has been formed. In addition, the data is partitioned into a group of transitions that open the channel from a closed state (Fig. 8 A) and a group of transitions that close the channel from an open state (Fig. 8 B). The results of curve fit to the distributions listed in Table 2 indicates two distinct peaks at ∼15–17 Å2 and ∼80 Å2 that could be identified as the most probable fully closed and fully open channels, respectively. The distributions in Fig. 8 show that the smaller bottleneck size is preferred to the larger. A possible explanation for this difference is seen in Fig. 9, where we have superposed multiple cycles and averaged the bottleneck sizes for each time point. The curves in Fig. 9 C show that during mid-transition, the average bottleneck sizes of opening transitions are systematically smaller than those of closing transitions by ∼10 Å2. In contrast, when the channel is very near either the open or closed state (e.g., within 0.5 ns of either state), the average bottleneck size seems to be independent of the direction of the transition. The overall bottleneck histogram curve fit was improved by including a third fitting function for the modest intermediate peak in Fig. 8. That third peak converged at ∼47–48 Å2. The necessity of the third peak of intermediate cross-section area to fit the distribution is suggestive of the existence of a short-lived intermediate conducting substate.
FIGURE 8.
Modified time series and distribution of bottleneck size for the full model channel for (A) opening and (B) closing transitions. In the right-hand panels, the solid line is a least-squares fit to a sum of three Gaussian distributions (dotted lines) whose parameters are given in Table 1. Bin width, 2 Å.
TABLE 2.
Fitting parameters for bottleneck probability distributions in Fig. 8 and bottleneck locations in Fig. 10 for the full model channel undergoing 10-ns cycles
| Transition type | Peak likelihood bottleneck areas (Å2) | Peak likelihood axial positions (Å) |
|---|---|---|
| Opening | 15.0, 47.0, 79.8 | 23.2, 30.3, 34.8, 37.3 |
| Closing | 16.9, 48.0, 79.7 | 23.8, 31.0, 34.8, 37.2 |
FIGURE 9.
Modified time series of bottleneck sizes, averaged across all cycles for each time point, for (A) the pore domain model, (B) the full model, and (C) both models superposed. The extent of opening accounts for points in time associated with the closing transition that have been folded back onto the time points associated with the opening transition. Opening transitions (dark lines), with error estimate (±σ, dashed lines), and closing transitions (gray lines) are shown.
In the corresponding analysis of the pore domain model channel (not shown), there was a significant peak at 0 Å2. We found that it was not until one Gaussian center was fixed at 0 Å2 that the locations of two other distinct peaks converged. One of other peaks converged to ∼24–25 Å2 for simulations of 10-ns cycles and ∼27 Å2 for 20-ns cycles. The difference between opening and closing transitions for both was <1 Å2. It is this peak that corresponds to the intermediate substate suggested by the analysis of the full model (Rosetta-based) channel. The other remaining peak converged to ∼73 Å2 during opening transitions and to ∼67–68 Å2 during the closing transitions of both 10- or 20-ns cycle simulations. This was the only analysis for which there was significant difference in the results between the pore domain and the full (Rosetta) models; i.e., the pore domain model showed significant incidence of total physical closure (zero minimum cross-section) at the closed part of the cycle and also a more prominent peak suggestive of an intermediate conducting state. We attribute these differences to the more accurate modeling of the closed state in the Rosetta structure.
Analysis of both the pore domain model and full model channels showed the presence of an effective time lag in opening a channel from the closed state. In Fig. 9 A for the pore domain model, there is about a 2-ns delay before the closed channel opens appreciably, whereas in Fig. 9 B for the full model, the delay, if any, is substantially less. In either model there does not seem to be a corresponding delay on closing the channel from an open state. Whereas the formulation of the soft restraints in Eq. 4 do not distinguish between open and closed states, the simulations show that, indeed, the channel dynamics near the open and closed states are different from each other. We therefore infer that the forward and reverse conformational pathways of the channel cycles are qualitatively different.
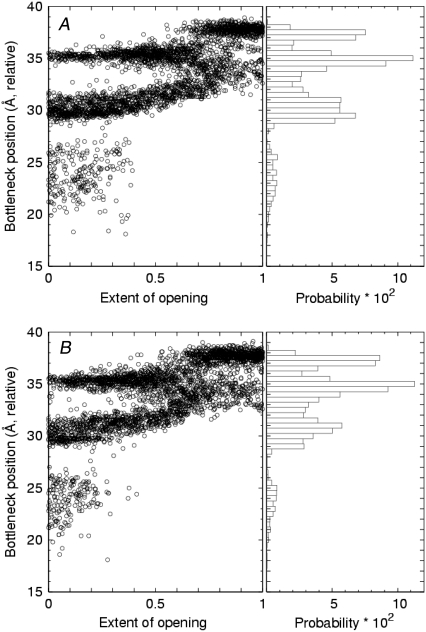
The computed locations of the bottleneck sites were found to be distributed within a 20-Å-long region along the channel axis. Fig. 10 shows the time course and spatial distribution of bottlenecks for opening (Fig. 10 A) and closing transitions (Fig. 10 B) in the full model channel undergoing 10-ns cycles. A listing of the locations of the peaks in the distributions shown in the right-hand panels is provided in Table 2. In the left-hand panels, it is seen that the bottleneck locations in closed and open states is markedly different. During the course of a 5-ns transition (half of the full 10-ns cycle) from the closed state to the open state (as the extent of opening goes from zero to one), at 0 ns there are three possible bottleneck regions, centered at ∼24, 30, and 35 Å. After ∼2 ns, the bottlenecks near 24 Å vanish, and near 3.5 ns the bottleneck sites merge into a single region. From ∼3.5 to 4.5 ns, the bottleneck sites separate into two new regions located at ∼33–35 Å and a preferred region at ∼37 Å. The closing of the channel (Fig. 10 B) essentially reverses this progression.
FIGURE 10.
Modified time series and distribution of bottleneck positions along the channel axis for (A) opening and (B) closing transitions. Extent of opening is as described in Fig. 9. Bin width, 0.5 Å.
The residues and corresponding positions contributing to bottlenecks within 1 ns of either the open or closed state were identified (see Methods) from the V406–R419 portion of the protein sequence and are listed in Table 3. Close to the channel's central cavity, V406 and P407 from the PVP region were identified as bottleneck residues in both closed and open channels. Visual inspection of snapshots of the protein near the open state showed a kinked S6 helix in this region. In addition, closed channels admitted more bottleneck sites toward the intracellular end of the channel, namely S411 and the bulkier N414, Y415, H418, and R419. Analysis of the pore domain model for 10- and 20-ns cycles yielded similar results.
TABLE 3.
Residues identified as among the top five residues closest to the bottleneck region, for the full model channel near open and closed states
| Closed
|
Open
|
||
|---|---|---|---|
| Axial position range (Å) | Residues | Axial position range (Å) | Residues |
| 21–26 | S411, N414, Y415, H418, R419 | 33–35 | V406, P407, I409, V410 |
| 29–32 | P407, V410, S411, F413, N414 | 37–38.5 | V406 |
| 35–36 | V406 | ||
Position ranges are based on the left-hand panels in Fig. 10. Underscoring indicates that the residue was at least once the closest residue (see Methods).
Interresidue hydrogen bonding
The final panel in Fig. 6 for the full model channel is a time series that shows an increasing number of hydrogen bonds (H-bonds) across S6 inner helices below the PVP region as the channel closes. This result was also observed for the pore domain model channel (not shown). After the initial 15 ns of simulation time, when the H-bond cycles seemed to have stabilized with precision, the channel was calculated to attain up to 16 H-bonds in or around closed state. The recalculation of H-bonds excluding nitrogen acceptors systematically reduced the number of H-bonds by ∼15%, implying that the majority of H-bonds involves atoms on side chains rather than along the protein backbone. The analysis further showed that H-bonds between S6 inner helices were almost exclusively between neighboring monomers, with next-nearest neighboring monomers contributing up to two H-bonds near the closed channel states.
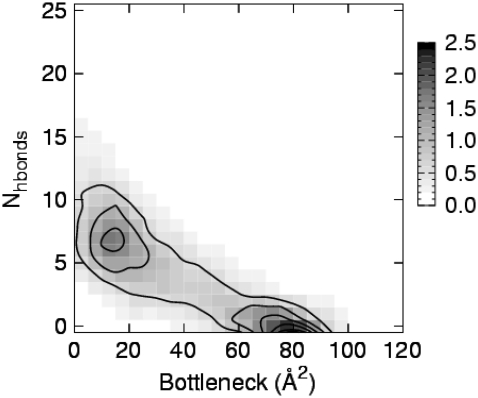
To visualize the relationship between bottleneck size and H-bond count, a histogram of time series data from Fig. 6 was formed, and the result is shown in Fig. 11. The number of H-bonds is seen to be generally anti-correlated with the channel bottleneck size. Two regions of highest probability (indicated by the darker shading) are found; one region corresponds to seven H-bonds for the 15–20 Å2 bottleneck bin, and another region that shows zero H-bonds for the 75–80 Å2 bottleneck bin. Additional calculations of the nonbonded interaction potential energy among the soft-restrained portions of the S6 inner helices (i.e., G398–T421) showed that both the electrostatic and the van der Waals energy components decreased (increased) in the negative (positive) direction as the channel approached the closed (open) state.
FIGURE 11.
Probability distribution of hydrogen bond count versus bottleneck size, using the data from the full model channel undergoing 10-ns cycles in Fig. 6. B-spline contours (order 4) are drawn with an outermost contour level of 0.5 and with increments of 0.5. Bottleneck bin size, 5 Å. Key: probability (×100).
SUMMARY AND DISCUSSION
We have introduced a method called end-point targeted molecular dynamics (EPTMD) that uses “soft” restraints to transform a protein structure from one conformational end-point state to another. We have applied EPTMD to the opening and closing of the Shaker Kv1.2 channel in implicit solvent. The EPTMD approach brings together several elements seen previously in other studies, e.g., a first-order relaxation of a protein about a reference state (50), the notion of targeted molecular dynamics using a single reference state (39), and the motion of allowing intermediate conformational pathways to emerge from the dynamics (9,82,83). EPTMD is an extensible approach that provides a natural way to incorporate additional constraints as provided by experiment.
We considered two sets of end-point reference structures: one set was derived from the native open x-ray structure and a homology-modeled closed structure, and the other set used the Rosetta structural predictions that accounted for the membrane environment (53). Analyses carried out on both systems yielded similar qualitative results, namely:
A sufficiently slow cycling rate (here, 0.1 ns−1 or slower for either system) that allows the cycling channel to get close to end-point reference state. This criterion seemed sufficient to maintain good tertiary protein structure throughout the transitions.
Backbone torsional angle fluctuations for residues near the PVP region of the inner helix may be coordinated.
The narrowest part or bottleneck of the channel lumen, aside from the selectivity filter, can occur at several locations along the PVP region and downstream, particularly for the those residues having bulky side chains. V406 and P407 of the PVP region were found to be potential bottleneck sites in both opening and closing channels.
Hydrogen bonds may form between the inner helices below the PVP motif at any time during the conformational cycling, particularly in the closed channel state. They are likely responsible for the several nanosecond delay in the opening of the channel from the closed state.
The time course of the bottleneck size for channels in the process of opening versus closing are measurably different.
The asymmetries in the opening and closing transition as seen by hydrogen bond formation and bottleneck size suggest that the opening and closing conformational pathways are somewhat different.
The presence of an intermediate structural substate as evidenced by the distribution of bottleneck sizes defining the size of the gap between S6 inner helices.
These simulations support experimental observations concerning the behavior of proline and glycine within α-helices. Prolines are known for their propensity to destabilize the helix due to the discontinuation of intramolecular hydrogen bonds along the helix (84). It has also been found that flexible prolines are required for the gating of Shaker-like channels (73) and that helix flexibility of proline-containing transmembrane helices extends three to four positions upstream from the PVP motif (85,86). Experimental evidence of the importance of a highly conserved glycine serving as a molecular “hinge” (87) in the middle of the inner helix was indicated in a mutational study wherein the site-directed mutation of glycine to alanine resulted in no expression of the channel protein (88). All of these observations are supported in Figs. 4 and 5 where it is seen that fluctuations in backbone torsional angles for several residues just upstream from the PVP region tend not only to occur, but also to occur in registry with the applied soft restraints, whereas the fluctuations of the glycine hinge are much smaller. Our results suggest that the protein's amino acid sequence could predispose it to certain inherent dynamical behavior, even when the solvent is treated implicitly.
Our identification of bottleneck residues is supported by both experimental and theoretical investigations. With regard to experimental support, Hackos et al. (74) have carried out a mutational scan of residues in the S6 gate region of Shaker H4 to find positions that affected the measurement of ionic currents. Those authors concluded that V478 and F481 (correspondingly, V410 and F413 in this work) may be involved in the occlusion of the pore. Our bottleneck analyses indicated in Table 3 that our V410 but not our F413 was closest to the channel lumen. With regard to theoretical support, Treptow et al. (89) have used molecular dynamics techniques to compute the free-energy profile of an ion traversing the activation gate region in a partially opened and in a fully closed Shaker channel having all six transmembrane segments while embedded in a lipid environment. Those authors found that Y485, N482, V478 (corresponding to Y417, N414, V410, respectively, in this study) tended to obstruct the ion-conduction pathway, and that the main energy barrier to ion permeation was associated with V478. Our results in Table 3 support those authors' result.
The substate suggested by the bottleneck distributions in this work may correspond to a kinetic substate. Schoppa and Sigworth (90) have proposed a comprehensive kinetic scheme to describe electrophysiological properties of wild-type and L370V mutant Shaker 29-4 channels. Their scheme consists of several model classes describing the number of transitions that each monomer can undergo before all the monomers together undergo a series of collective motion en route to the open state. The backbone torsional angles of residues near the PVP motif in this work were seen to undergo fluctuations that corresponded to the β-region of Ramachandran space. In particular, V406 in one monomer underwent a brief, one-time transition from the α-region to the β-region, suggesting that the movements of monomers are independent. The sample size of such events in this work, however, is small, preventing us from making meaningful contact with those authors' kinetic scheme at this time.
In closing, we note that in this work simulations of over 0.1 μs in duration were readily achieved using an explicit channel protein embedded in an implicit medium representing a solvent plus lipid environment. It has been suggested previously (91) that to extend simulations to the 10-μs regime that seems to correspond to the fast component associated with the opening and closing of the Shaker channel (92), improved molecular dynamics methods would be required. This work, using a reduced system representation together with the use of soft restraints to modify the channel's tertiary structure, is but one such possible method.
Acknowledgments
We gratefully acknowledge additional computational time provided through the National Computational Science Alliance. We thank Dr. Susan Rempe for helpful discussion.
Supported by Pfizer, Inc., the National Center for Supercomputing Applications, and the National Institutes of Health (NIH) through the NIH Roadmap for Medical Research (grant PN2 EY016570-03).
The contents are solely the responsibility of the authors and do not necessarily represent the official views of the NIH or the National Eye Institute, the administrative institute of the award.
Editor: Peter C. Jordan.
References
- 1.Hille, B. 1971. The permeability of the sodium channel to organic cations in myelinated nerves. J. Gen. Physiol. 58:599–619. [DOI] [PMC free article] [PubMed] [Google Scholar]
- 2.Hille, B. 1975. Ionic selectivity of Na+ and K+ channels of nerve membranes. In Membranes: A Series of Advances, Vol. 3. G. Eisenman, editor. Marcel Dekker, New York. 255–323. [PubMed]
- 3.Doyle, D. A., J. Morais-Cabral, R. A. Pfuetzner, A. Kuo, J. M. Gulbis, S. L. Cohen, B. T. Chait, and R. MacKinnon. 1998. The structure of the potassium channel: molecular basis of K+ conduction and selectivity. Science. 280:69–77. [DOI] [PubMed] [Google Scholar]
- 4.Armstrong, C. M., and L. Binstock. 1965. Anomalous rectification in the squid giant axon injected with tetraethylammonium chloride. J. Gen. Physiol. 48:859–872. [DOI] [PMC free article] [PubMed] [Google Scholar]
- 5.Armstrong, C. M. 1969. Inactivation of the potassium conductance and related phenomena caused by quaternary ammonium ion injection in squid axons. J. Gen. Physiol. 54:553–575. [DOI] [PMC free article] [PubMed] [Google Scholar]
- 6.Armstrong, C. M. 1971. Interaction of tetraethylammonium ion derivatives with the potassium channels of giant axons. J. Gen. Physiol. 58:413–437. [DOI] [PMC free article] [PubMed] [Google Scholar]
- 7.Perozo, E., D. M. Cortes, and L. G. Cuello. 1999. Structural rearrangements underlying K+-channel activation gating. Science. 285:73–78. [DOI] [PubMed] [Google Scholar]
- 8.Mashl, R. J., Y. Tang, J. Schnitzer, and E. Jakobsson. 2001. Hierarchical approach to predicting permeation in ion channels. Biophys. J. 81:2473–2483. [DOI] [PMC free article] [PubMed] [Google Scholar]
- 9.Biggin, P. C., and M. S. P. Sansom. 2002. Open-state models of a potassium channel. Biophys. J. 83:1867–1876. [DOI] [PMC free article] [PubMed] [Google Scholar]
- 10.Zhou, Y., J. H. Morais-Cabral, A. Kaufman, and R. MacKinnon. 2001. Chemistry of ion coordinations and hydration revealed by a K+ channel-Fab complex at 2.0 Å resolution. Nature. 414:43–48. [DOI] [PubMed] [Google Scholar]
- 11.Jiang, Y., A. Lee, J. Chen, M. Cadene, B. T. Chait, and R. MacKinnon. 2002. Crystal structure and mechanism of a calcium-gated potassium channel. Nature. 417:515–522. [DOI] [PubMed] [Google Scholar]
- 12.Jiang, Y., A. Lee, J. Chen, M. Cadene, B. T. Chait, and R. MacKinnon. 2002. The open pore conformation of potassium channels. Nature. 417:523–526. [DOI] [PubMed] [Google Scholar]
- 13.Jiang, Y., A. Lee, J. Chen, V. Ruta, M. Cadene, B. T. Chait, and R. MacKinnon. 2003. X-ray structure of a voltage-dependent K+ channel. Nature. 423:33–41. [DOI] [PubMed] [Google Scholar]
- 14.Jiang, Y., V. Ruta, J. Chen, A. Lee, and R. MacKinnon. 2003. The principle of gating charge movement in a voltage-dependent K+ channel. Nature. 423:42–48. [DOI] [PubMed] [Google Scholar]
- 15.Kuo, A., J. M. Gulbis, J. F. Antcliff, T. Rahman, E. D. Lowe, J. Zimmer, J. Cuthbertson, F. M. Ashcroft, T. Ezaki, and D. A. Doyle. 2003. Crystal structure of the potassium channel KirBac1.1 in the closed state. Science. 300:1922–1926. [DOI] [PubMed] [Google Scholar]
- 16.Long, S. B., E. B. Campbull, and R. MacKinnon. 2005. Crystal structure of a mammalian voltage-dependent Shaker family K+ channel. Science. 309:897–903. [DOI] [PubMed] [Google Scholar]
- 17.Shi, N., S. Ye, A. Alam, L. Chen, and Y. Jiang. 2006. Atomic structure of a Na+- and K+-conducting channel. Nature. 440:570–574. [DOI] [PubMed] [Google Scholar]
- 18.Woolf, T. B., D. M. Zuckerman, N. Lu, and H. Jang. 2004. Tools for channels: moving towards molecular calculations of gating and permeation in ion channel biophysics. J. Mol. Graph. Model. 22:359–368. [DOI] [PubMed] [Google Scholar]
- 19.Brooks, B. R., and M. Karplus. 1983. Harmonic dynamics of proteins: normal modes and fluctuations in bovine pancreatic trypsin inhibitor. Proc. Natl. Acad. Sci. USA. 80:6571–6575. [DOI] [PMC free article] [PubMed] [Google Scholar]
- 20.Go, N., T. Noguti, and T. Nisikawa. 1983. Dynamics of a small globular protein in terms of low-frequency vibrational modes. Proc. Natl. Acad. Sci. USA. 80:3696–3700. [DOI] [PMC free article] [PubMed] [Google Scholar]
- 21.Levitt, M., C. Sander, and P. S. Stern. 1983. Normal-mode dynamics of a protein: bovine pancreatic trypsin inhibitor. Int. J. Quantum Chem. Quantum Biol. Symp. 10:181–199. [Google Scholar]
- 22.Shen, Y., Y. Kong, and J. Ma. 2002. Intrinsic flexibility and gating mechanism of the potassium channel KcsA. Proc. Natl. Acad. Sci. USA. 99:1949–1953. [DOI] [PMC free article] [PubMed] [Google Scholar]
- 23.Cheng, X., H. Wang, B. Grant, S. M. Sine, and J. A. McCammon. 2006. Targeted molecular dynamics study of C-loop closure and channel gating in nicotinic receptors. PLoS Comp. Biol. 2:1173–1184. [DOI] [PMC free article] [PubMed] [Google Scholar]
- 24.Cheng, X. L., B. Z. Lu, B. Grant, R. J. Law, and J. A. McCammon. 2006. Channel opening motion of α 7 nicotinic acetylcholine receptor as suggested by normal mode analysis. J. Mol. Biol. 355:310–324. [DOI] [PubMed] [Google Scholar]
- 25.Taly, A., M. Delarue, T. Grutter, M. Nilges, N. Le Novere, P. J. Corringer, and J. P. Changeux. 2005. Normal mode analysis suggests a quaternary twist model for the nicotinic receptor gating mechanism. Biophys. J. 88:3954–3965. [DOI] [PMC free article] [PubMed] [Google Scholar]
- 26.Xu, Y., X. Luo, J. Shen, W. Zhu, K. Chen, and H. Jiang. 2006. Molecular dynamics of nicotinic acetylcholine receptor correlating biological functions. Curr. Protein Pept. Sci. 7:195–200. [DOI] [PubMed] [Google Scholar]
- 27.Valadie, H., J. J. Lacapcre, Y. H. Sanejouand, and C. Etchebest. 2003. Dynamical properties of the MscL of Escherichia coli: A normal mode analysis. J. Mol. Biol. 332:657–674. [DOI] [PubMed] [Google Scholar]
- 28.Shrivastava, I. H., and I. Bahar. 2006. Common mechanism of pore opening shared by five different potassium channels. Biophys. J. 90:3929–3940. [DOI] [PMC free article] [PubMed] [Google Scholar]
- 29.Shrivastava, I. H., C. E. Capener, L. R. Forrest, and M. S. Sansom. 2000. Structure and dynamics of K+ channel pore-lining helices: a comparative simulation study. Biophys. J. 78:79–92. [DOI] [PMC free article] [PubMed] [Google Scholar]
- 30.Hung, A., K. Tai, and M. S. P. Sansom. 2005. Molecular dynamics simulation of the M2 helices within the nicotinic acetylcholine receptor transmembrane domain: structure and collective motions. Biophys. J. 88:3321–3333. [DOI] [PMC free article] [PubMed] [Google Scholar]
- 31.Amadei, A., A. B. M. Linssen, and H. J. C. Berendsen. 1993. Essential dynamics of proteins. Proteins Struct. Funct. Genet. 17:412–425. [DOI] [PubMed] [Google Scholar]
- 32.Balsera, M. A., W. Wriggers, Y. Oono, and K. Schulten. 1996. Principal component analysis and long time protein dynamics. J. Phys. Chem. 100:2567–2572. [Google Scholar]
- 33.Kitao, A., and N. Go. 1999. Investigating protein dynamics in collective coordinate space. Curr. Opin. Struct. Biol. 9:164–169. [DOI] [PubMed] [Google Scholar]
- 34.Teeter, M. M., and D. A. Case. 1999. Harmonic and quasiharmonic descriptions of crambin. J. Phys. Chem. 94:8091–8097. [Google Scholar]
- 35.Zhang, Z., Y. Shi, and H. Liu. 2003. Molecular dynamics simulations of peptides and proteins with amplified collective motions. Biophys. J. 84:3583–3593. [DOI] [PMC free article] [PubMed] [Google Scholar]
- 36.Miloshevsky, G. V., and P. C. Jordan. 2005. Permeation and gating in proteins: kinetic Monte Carlo reaction path following. J. Chem. Phys. 122:214901. [DOI] [PubMed] [Google Scholar]
- 37.Miloshevsky, G. V., and P. C. Jordan. 2006. The open state gating mechanism of gramicidin A requires relative opposed monomer rotation and simultaneous lateral displacement. Structure. 14:1241–1249. [DOI] [PubMed] [Google Scholar]
- 38.Jordan, P. C. 2007. Monte Carlo normal mode following: a new way to study ion channel gating. Biophysical Society Meeting, March 2007.
- 39.Schlitter, J., and M. Klähn. 2003. The free energy of a reaction coordinate at multiple constraints: a concise formulation. Mol. Phys. 101:3439–3443. [Google Scholar]
- 40.Ma, J., and M. Karplus. 1997. Molecular switch in signal transduction: reaction paths of the conformational changes in ras p21. Proc. Natl. Acad. Sci. USA. 94:11905–11910. [DOI] [PMC free article] [PubMed] [Google Scholar]
- 41.Ma, J., P. B. Sigler, Z. Xu, and M. Karplus. 2000. A dynamic model for the allosteric mechanism of GroEL. J. Mol. Biol. 302:303–313. [DOI] [PubMed] [Google Scholar]
- 42.Ma, J., T. C. Flynn, Q. Cui, A. G. W. Leslie, J. E. Walker, and M. Karplus. 2002. A dynamic analysis of the rotation mechanism for conformational change in F1-ATPase. Structure. 10:921–931. [DOI] [PubMed] [Google Scholar]
- 43.Mendieta, J., F. Gago, and G. Ramirez. 2005. Binding of 5′-GMP to the GluR2 AMPA receptor: insight from targeted molecular dynamics simulations. Biochemistry. 44:14470–14476. [DOI] [PubMed] [Google Scholar]
- 44.Compoint, M., F. Picaud, C. Ramseyer, and C. Girardet. 2005. Targeted molecular dynamics of an open-state KcsA channel. J. Chem. Phys. 122:134707. [DOI] [PubMed] [Google Scholar]
- 45.Grübmuller, H., B. Heymann, and P. Tavan. 1996. Ligand binding: molecular mechanics calculation of the streptavidin-biotin rupture force. Science. 271:997–999. [DOI] [PubMed] [Google Scholar]
- 46.Park, S., and K. Schulten. 2004. Calculating potentials of mean force from steered molecular dynamics simulations. J. Chem. Phys. 120:5946–5961. [DOI] [PubMed] [Google Scholar]
- 47.Monticelli, L., K. M. Robertson, J. L. MacCallum, and D. P. Tieleman. 2004. Computer simulation of the KvAP voltage-gated potassium channel: steered molecular dynamics of the voltage sensor. FEBS Lett. 564:325–332. [DOI] [PubMed] [Google Scholar]
- 48.Gullingsrud, J., and K. Schulten. 2003. Gating of MscL studied by steered molecular dynamics. Biophys. J. 85:2087–2099. [DOI] [PMC free article] [PubMed] [Google Scholar]
- 49.Chiu, S.-W., S. Subramaniam, E. Jakobsson, and J. A. McCammon. 1989. Water and polypeptide conformations in the gramicidin channel: a molecular dynamics study. Biophys. J. 56:253–261. [DOI] [PMC free article] [PubMed] [Google Scholar]
- 50.Chiu, S.-W., E. Jakobsson, S. Subramaniam, and J. A. McCammon. 1991. Time-correlation analysis of simulated water motion in flexible and rigid gramicidin channels. Biophys. J. 60:273–285. [DOI] [PMC free article] [PubMed] [Google Scholar]
- 51.Chiu, S.-W., S. Subramaniam, and E. Jakobsson. 1999. Simulation study of a gramicidin/lipid bilayer system in excess water and lipid: I. Structure of the molecular complex. Biophys. J. 76:1929–1938. [DOI] [PMC free article] [PubMed] [Google Scholar]
- 52.Chiu, S.-W., S. Subramaniam, and E. Jakobsson. 1999. Simulation study of a gramicidin/lipid bilayer system in excess water and lipid. II. Rates and mechanisms of water transport. Biophys. J. 76:1939–1950. [DOI] [PMC free article] [PubMed] [Google Scholar]
- 53.Yarov-Yarovoy, V., D. Baker, and W. A. Catterall. 2006. Voltage sensor conformations in the open and closed states in Rosetta structural models of K+ channels. Proc. Natl. Acad. Sci. USA. 103:7292–7297. [DOI] [PMC free article] [PubMed] [Google Scholar]
- 54.Yarov-Yarovoy, V., J. Schonbrun, and D. Baker. 2006. Multipass membrane protein structure prediction using Rosetta. Proteins. 62:1010–1025. [DOI] [PMC free article] [PubMed] [Google Scholar]
- 55.Marti-Renom, M. A., A. Stuart, A. Fiser, R. Sánchez, F. Melo, and A. Sali. 2000. Comparative protein structure modeling of genes and genomes. Annu. Rev. Biophys. Biomol. Struct. 29:291–325. [DOI] [PubMed] [Google Scholar]
- 56.Åquist, J., and V. Luzhkov. 2000. Ion permeation mechanism of the potassium channel. Nature. 404:881–884. [DOI] [PubMed] [Google Scholar]
- 57.Lindahl, E., B. Hess, and D. van der Spoel. 2001. Gromacs 3.0: A package for molecular simulation and trajectory analysis. J. Mol. Model. 7:306–317. [Google Scholar]
- 58.Berendsen, H., D. van der Spoel, and R. van Drunen. 1995. GROMACS: a message-passing parallel molecular dynamics implementation. Comput. Phys. Commun. 91:43–56. [Google Scholar]
- 59.Madura, J. D., J. M. Briggs, R. C. Wade, M. E. Davis, B. A. Luty, A. Ilin, J. Antosiewicz, M. K. Gilson, B. Bagheri, L. R. Scott, and J. A. McCammon. 1995. Electrostatics and diffusion of molecules in solution: simulations with the University of Houston Brownian Dynamics program. J. Comput. Phys. Commun. 91:57–95. [Google Scholar]
- 60.Gilson, M. K. 1993. Multiple-site titration and molecular modeling: two rapid methods for computing energies and forces of ionizable groups in proteins. Proteins. 15:266–282. [DOI] [PubMed] [Google Scholar]
- 61.Demchuk, E., and R. C. Wade. 1996. Improving the continuum electrostatic approach to calculating pKas of ionizable groups in proteins. J. Phys. Chem. 100:17373–17387. [Google Scholar]
- 62.Raquet, X., V. Lounnas, J. Lamotte-Brasseur, J. M. Frère, and R. C. Wade. 1997. pKa calculations for class A β-lactamases: methodological and mechanistic implications. Biophys. J. 73:2416–2426. [DOI] [PMC free article] [PubMed] [Google Scholar]
- 63.Sitkoff, D., K. Sharp, and B. H. Honig. 1994. Accurate calculation of hydration free energies using macroscopic solvent models. J. Phys. Chem. 98:1978–1988. [Google Scholar]
- 64.Hockney, R. W., S. P. Goel, and J. Eastwood. 1974. Quiet high resolution computer models of a plasma. J. Comput. Phys. 14:148–158. [Google Scholar]
- 65.Lainé, M., D. M. Papazian, and B. Roux. 2004. Critical assessment of a proposed model of Shaker. FEBS Lett. 564:257–263. [DOI] [PubMed] [Google Scholar]
- 66.van Gunsteren, W. F., X. Daura, and A. Mark. 1998. GROMOS force field. In Encyclopedia of Computational Chemistry, Vol. 2. P. von Rague Schleyer, editor. Wiley-VCH, Chichester, UK.
- 67.Berendsen, H. J. C., J. P. M. Postma, A. DiNola, and J. R. Haak. 1984. Molecular dynamics with coupling to an external bath. J. Chem. Phys. 81:3684–3690. [Google Scholar]
- 68.Varma, S., S.-W. Chiu, and E. Jakobsson. 2006. The influence of amino acid protonation states on molecular dynamics simulations of the bacterial porin OmpF. Biophys. J. 90:112–123. [DOI] [PMC free article] [PubMed] [Google Scholar]
- 69.Smart, O. S., J. G. Neduvelila, X. Wanga, B. A. Wallacea, and M. S. Sansom. 1996. HOLE: a program for the analysis of the pore dimensions of ion channel structural models. J. Mol. Graph. 14:354–360. [DOI] [PubMed] [Google Scholar]
- 70.Weiner, S. J., P. A. Kollman, D. A. Case, U. C. Singh, C. Ghio, G. Alagona, S. Profeta, Jr., and P. Weiner. 1984. A new force field for molecular mechanical simulation of nucleic acids and proteins. J. Am. Chem. Soc. 106:765–784. [Google Scholar]
- 71.Laskowski, R. A., M. W. MacArthur, D. S. Moss, and J. M. Thornton. 1993. PROCHECK: a program to check the stereochemical quality of protein structures. J. Appl. Cryst. 26:283–291. [Google Scholar]
- 72.Shealy, R. T., A. D. Murphy, R. Ramarathnam, E. Jakobsson, and S. Subramaniam. 2003. Sequence-function analysis of the K+-selective family of ion channels using a comprehensive alignment and the KcsA channel structure. Biophys. J. 84:2929–2942. [DOI] [PMC free article] [PubMed] [Google Scholar]
- 73.Labro, A. J., A. L. Raes, I. Bellens, N. Ottschytsch, and D. J. Snyders. 2003. Gating of Shaker-type channels requires the flexibility of S6 caused by prolines. J. Biol. Chem. 278:50724–50731. [DOI] [PubMed] [Google Scholar]
- 74.Hackos, D. H., T.-H. Chang, and K. J. Swartz. 2002. Scanning the intracellular S6 activation gate in the Shaker K+ channel. J. Gen. Physiol. 119:521–532. [DOI] [PMC free article] [PubMed] [Google Scholar]
- 75.Tieleman, D. P., I. H. Shrivastava, M. R. Ulmschneider, and M. S. Sansom. 2001. Proline-induced hinges in transmembrane helices: possible roles in ion channel gating. Proteins Struct. Funct. Genet. 44:63–72. [DOI] [PubMed] [Google Scholar]
- 76.Bright, J. N., I. H. Shrivastava, F. S. Cordes, and M. S. Sansom. 2002. Conformational dynamics of helix S6 from Shaker potassium channel: simulation studies. Biopolymers. 64:303–313. [DOI] [PubMed] [Google Scholar]
- 77.Magidovich, E., and O. Yifrach. 2004. Conserved gating hinge in ligand- and voltage-dependent K+ channels. Biochemistry. 43:13242–13247. [DOI] [PubMed] [Google Scholar]
- 78.Harris, T., A. R. Graber, and M. Covarrubias. 2003. Allosteric modulation of a neuronal K+ channel by 1-alkanols is linked to a key residue in the activation gate. Am. J. Physiol. Cell Physiol. 285:C788–C796. [DOI] [PubMed] [Google Scholar]
- 79.Bright, J. N., and M. S. Sansom. 2004. Kv channel S6 helix as a molecular switch: simulation studies. IEE Proc. Nanobiotechnol. 151:17–27. [DOI] [PubMed] [Google Scholar]
- 80.del Camino, D., M. Holmgren, Y. Liu, and G. Yellen. 2000. Blocker protection in the pore of a voltage-gated K+ channels and its structural implications. Nature. 403:321–325. [DOI] [PubMed] [Google Scholar]
- 81.Luzhkov, V. B., J. Nilsson, P. Arhern, and J. Aqvist. 2003. Computational modelling of the open-state Kv1.5 ion channel block by bupivacaine. Biochim. Biophys. Acta. 1652:35–51. [DOI] [PubMed] [Google Scholar]
- 82.Kong, Y., Y. Shen, T. E. Warth, and J. Ma. 2002. Conformational pathways in the gating of Escherichia coli mechanosensitive channel. Proc. Natl. Acad. Sci. USA. 99:5999–6004. [DOI] [PMC free article] [PubMed] [Google Scholar]
- 83.Tikhonov, D. B., and B. S. Zhorov. 2004. In silico activation of KcsA K+ channel by lateral forces applied to the C-termini of inner helices. Biophys. J. 87:1526–1536. [DOI] [PMC free article] [PubMed] [Google Scholar]
- 84.Williams, K. A., and C. M. Deber. 1991. Proline residues in transmembrane helices: structural or dynamic role? Biochemistry. 30:8919–8923. [DOI] [PubMed] [Google Scholar]
- 85.Bruhova, I., and B. S. Zhorov. 2005. KvAP-based model of the pore region of Shaker potassium channel is consistent with cadmium- and ligand-binding experiments. Biophys. J. 89:1020–1029. [DOI] [PMC free article] [PubMed] [Google Scholar]
- 86.Cordes, F. S., J. N. Bright, and M. S. Sansom. 2002. Proline-induced distortions of transmembrane helices. J. Mol. Biol. 323:951–960. [DOI] [PubMed] [Google Scholar]
- 87.Ding, S., L. Ingleby, C. A. Ahern, and R. Horn. 2005. Investigating the putative glycine hinge in Shaker potassium channel. J. Gen. Physiol. 126:213–226. [DOI] [PMC free article] [PubMed] [Google Scholar]
- 88.Yifrach, O., and R. MacKinnon. 2002. Energetics of pore opening in a voltage-gated K+ channel. Cell. 111:231–239. [DOI] [PubMed] [Google Scholar]
- 89.Treptow, W., and M. Tarek. 2006. Molecular restraints in the permeation pathway of ion channels. Biophys. J. 91:L26–L28. [DOI] [PMC free article] [PubMed] [Google Scholar]
- 90.Schoppa, N. E., and F. J. Sigworth. 1998. Activation of Shaker potassium channels. III. An activation gating model for wild-type and V2 mutant channels. J. Gen. Physiol. 111:313–342. [DOI] [PMC free article] [PubMed] [Google Scholar]
- 91.Treptow, W., B. Maigret, C. Chipot, and M. Tarek. 2004. Coupled motions between pore and voltage-sensor domains: a model for Shaker B, a voltage-gated potassium channel. Biophys. J. 87:2365–2379. [DOI] [PMC free article] [PubMed] [Google Scholar]
- 92.Sigg, D., F. Bezanilla, and E. Stefani. 2003. Fast gating in the Shaker K+ channel and the energy landscape of activation. Proc. Natl. Acad. Sci. USA. 100:7611–7615. [DOI] [PMC free article] [PubMed] [Google Scholar]


