

Abstract
Background
Morphogen gradients are thought to create concentration thresholds that differentially position the expression boundaries of multiple target genes. Despite intensive study, it is still unclear how the concentration profiles within gradients are spatially related to the critical patterning thresholds they generate.
Results
Here we use a combination of quantitative measurements and ectopic misexpression experiments to examine the transcriptional repression activities of the Hunchback (Hb) protein gradient in Drosophila embryos. Our results define five expression boundaries that are set primarily by differences in Hb concentration, and two boundaries that are set by combinatorial mechanisms involving Hb and at least one other repressor.
Conclusions
Hb functions as a repressive morphogen, but only within a specific range of concentrations (~40% - ~4.4% of maximum Hb concentration), within which there are at least four distinct concentration thresholds. The lower limit of the range reflects a position where the slope of the gradient becomes too shallow for resolution by specific target genes. Concentrations above the upper limit do not contribute directly to differential repression mechanisms, but they provide a robust source that permits proper functioning of the gradient in heterozygous embryos that contain only one functional hb gene.
Keywords: Morphogen, Embryogenesis, Patterning, Repression, Threshold responses
Introduction
A morphogen is defined as a “form-producing” substance that specifies a number of cell fates in a concentration-dependent manner [1]. Different cell fates are thought to be controlled by target genes that respond to specific threshold concentrations [2–4]. In theory, a single gradient could position multiple boundaries of gene expression, and small differences in target gene sensitivity could position adjacent boundaries very near to each other. However, it is not clear how many different positional values can be specified by a single morphogen gradient, or how the positional information within a gradient is related to its concentration profile.
One of the best characterized morphogens in Drosophila is the maternal transcription factor Bicoid (Bcd), which is distributed in a long-range gradient with highest levels near the anterior pole of the embryo[5, 6]. Bcd is required for the formation of all head and thoracic segments [7], and activates transcription of more than fifteen zygotic target genes, which are expressed in specific spatial patterns along the anterior posterior (AP) axis [8]. Changing bcd gene copy number causes coordinated shifts of the positions of target gene expression patterns without interfering with their order along the AP axis [9, 10], which is consistent with the idea that different target genes can sense different Bcd concentrations.
However, recent studies suggest that Bcd concentration is only one of several factors that control target gene positioning along the AP axis. For example, when the entire set of 21 known Bcd-dependent regulatory elements was examined, little correlation was found between the relative positioning of Bcd target genes and the predicted binding ”strengths” of Bcd site clusters in their cis-regulatory elements [8]. Also, most Bcd target elements contain binding sites for other transcription factors, including those encoded by “gap” genes hunchback (hb), Kruppel (Kr), and giant (gt). In most cases, Hb appears to potentiate Bcd-dependent activation [11, 12], while Kr and Gt function as repressors that refine broad activation domains, creating sharp on/off expression boundaries [13–16].
Since gap proteins are distributed themselves as concentration gradients in the early Drosophila embryo, it is possible that they function as repressive morphogens to set multiple gene expression boundaries. Previous studies suggest that gradients of Hb, Kr, and Knirps (Kni) differentially position the expression boundaries of adjacent gap gene expression patterns or pair-rule stripes [17–22]. These results suggest that repressors can act as morphogens, but it is not clear how much patterning information is contained within a single repressor gradient.
Here we focus on the patterning activities of the Hb protein, which is expressed at high levels throughout the anterior half of the embryo. At the posterior edge of this domain, a gradient of Hb emanates into central and posterior regions [23, 24]. In the anterior half, Hb functions synergistically with Bcd in activating a number of downstream target genes [8, 11, 12, 25]. The gradient at the edge of the anterior domain is thought to activate expression of Kr in a broad central domain [21, 26], and it is possible that this interaction is direct [27]. This gradient is also thought to establish multiple target gene expression boundaries in middle and posterior regions by repressive mechanisms [20, 21].
Previous genetic experiments identified seven target gene expression boundaries that shift anteriorly in hb loss of function mutants [20–22, 28, 29]. These boundaries are located at various positions within the Hb gradient, and in some cases boundaries are positioned very near to each other, as close as 2–3 nuclei apart. These observations raise two key questions about the relationship between the Hb gradient and its repression target genes: 1. Is Hb expression sufficient for repression of each target gene? 2. Do differences in sensitivity to Hb-mediated repression control the relative placement of all seven target genes? To begin to answer these questions, we have carefully quantified the relationship between the Hb protein gradient and the RNA expression patterns of the target genes. We have also tested how target genes respond to various levels of ectopically expressed Hb. Our results suggest that five boundaries are positioned primarily by different Hb concentrations, and the relative sensitivities of these target genes are consistent with their normal positions along the AP axis. Two other boundaries, located in regions where there are very high or very low concentrations of Hb, are established by combinatorial repression mechanisms. These results establish quantitative limits on the functional range of concentrations used by the Hb repression gradient.
Results
Spatial Relationships
The hb gene contains two separate promoters (P1 and P2), which direct a complex temporal and spatial pattern of RNA transcription in the early embryo [23, 30, 31]. hb RNA is initially expressed from P1 during oogenesis, and distributed ubiquitously in the newly fertilized embryo. Translation of this RNA is repressed in posterior regions by the posterior determinant nanos, which creates an anterior gradient of maternal Hb protein with a gradual slope [24, 32–34]. Starting at nuclear cleavage cycle 10, hb transcription is zygotically activated from P2 by the maternal morphogen Bcd (in concert with maternal Hb) [10, 11, 35]. Translation of this RNA leads to an increase in the concentration of Hb throughout the anterior half of the embryo, and the formation of a steeper gradient near the center (Supplemental Figure 1A–D). The Bcd-dependent activation of hb lasts until midway through cycle 14, when a stripe of zygotic expression appears at the position of parasegment 4 [PS4, Supplemental Figure 1E, F4, [31]]. Translation of this stripe further steepens the slope of the Hb gradient.
The anterior boundaries of Kruppel (Kr), posterior knirps (kni), posterior giant (gt), nubbin (nub), POU domain protein 2 (pdm2), and the 3rd and 4th stripes of the pair-rule gene even-skipped (eve) shift anteriorly in mutants lacking zygotic hb, which indicates that hb is required for their proper positioning [20–22, 28, 29]. To examine the spatial relationships between the Hb gradient and the position of each expression boundary, we simultaneously assayed Hb protein expression and the mRNA expression patterns of individual target genes (Figure 1). We then measured the relative Hb protein concentration that coincides with the position where each target expression pattern is repressed to a level of 50% of maximum (Table 1).
Figure 1.
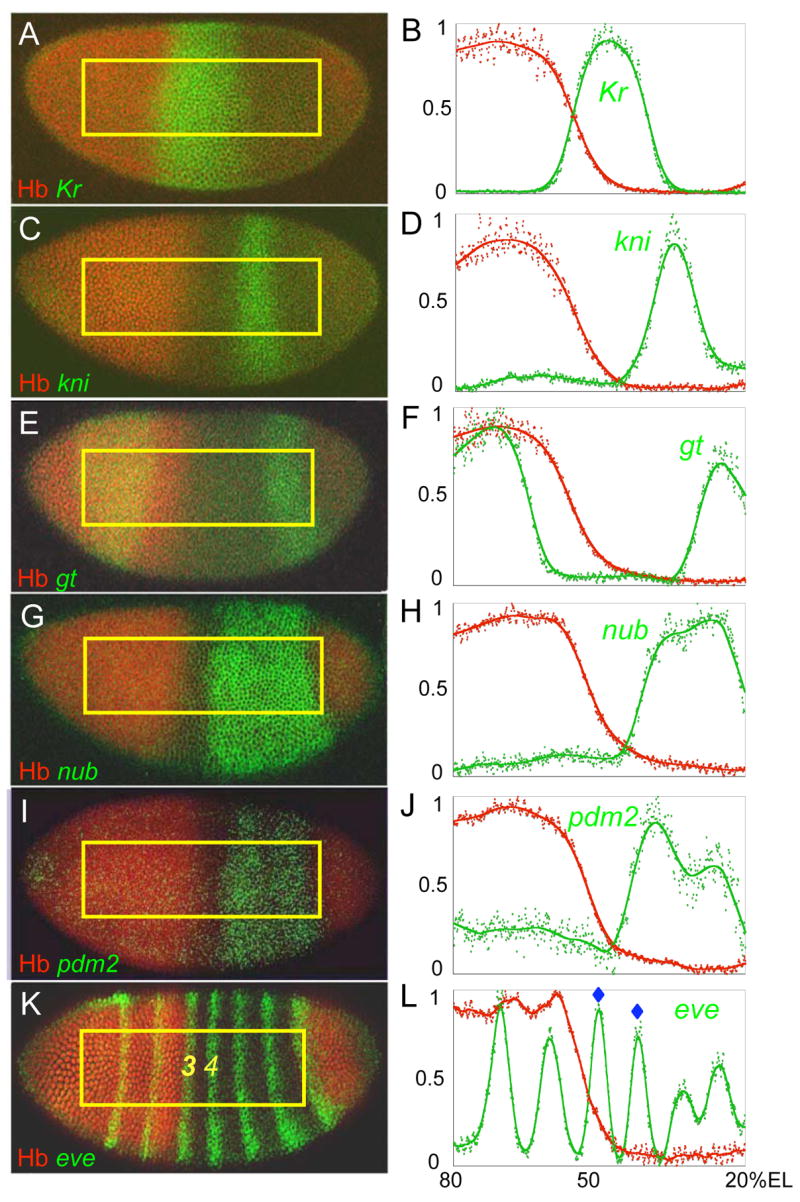
Spatial relationships between the Hb gradient and its repression targets. Wild type embryos (left panels) were stained to simultaneously detect the Hb protein gradient (red) and the mRNA expression patterns of target genes (green). Quantitative analyses of the ROI (yellow box) for each embryo are shown on the right. Peaks representing the eve stripes repressed by the anterior Hb gradient (eve 3 and eve 4) are marked by blue stars (L).
Table 1.
| Target gene | Positioning# | N= |
|---|---|---|
| early Kr* | 48.4±4.4 | 10 |
| late Kr** | 94.1±2.5 | 9 |
| eve 3 | 39.9±1.6 | 10 |
| nub | 11.9±2.5 | 9 |
| pdm2 | 10.6±1.4 | 8 |
| eve 4 | 8.6±1.4 | 10 |
| kni | 4.4±1.0 | 11 |
| gt | 3.7±0.6 | 11 |
95% confidence
embryos staged at cycle 13 to early cycle 14
embryos staged at mid cycle 14
In wild type embryos, it has been previously shown that segmentation gene expression patterns shift anteriorly during cycle 14 [36, 37]. To test whether the timing of these shifts corresponds with the sharpening of the Hb protein gradient, we measured Hb gradient profiles and target gene RNA patterns at two specific stages, early and mid-nuclear cycle 14. For the target gene kni, the posterior expression domain moves anteriorly as the Hb gradient refines, but the relative Hb concentration at the position of 50% repression of kni does not change significantly (4.0 % [Hb]max early vs. 4.6% [Hb]max at mid cycle 14; Figure 2A–C). Similar results were obtained for five other target expression patterns (eve3, eve4, nub, pdm2, and posterior gt), all of which moved anteriorly during cycle 14 without changing the amount of Hb associated with the position of their anterior boundary (Table 1; data not shown). These results are consistent with the idea that specific Hb concentrations are involved in setting the positions of these target genes.
Figure 2.

Temporal dynamics between refinement of the Hb gradient and target gene positioning. Wild type Hb gradients (red) and the mRNA expression patterns (green) of the gap genes kni (A-C, n=11) and Kr (D-F, n=19) are shown at two time points, early in nuclear cycle 14 (A, D) or midway through the same cycle (B, E). Quantitative profiles of these expression patterns are shown on the right (C, F). Positions where target gene mRNA patterns are repressed to a level of 50% of maximum are marked with vertical dashed black lines. Thin lines represent data from early cycle 14 embryos, while thick lines represent mid-cycle 14 embryos.
An exception to this behavior was the anterior Kr expression boundary, which changed significantly with respect to its position in the Hb gradient (Figure 2D–F). Early in cycle 14, the anterior Kr boundary is positioned at nuclei that contain ~48% of [Hb]max, while in mid-cycle 14, this boundary moves anteriorly to a position where there is more than 90% [Hb]max (Table 1). This result is inconsistent with the idea that a specific concentration of Hb establishes and maintains this boundary during the course of cycle 14 (see below).
Hb acts as a repressive morphogen on a subset of target expression patterns
To test whether the Hb gradient is sufficient for repression of these target genes, we used the sna promoter to create ectopic gradients of Hb that emanate from the ventral-most regions of the embryo [17]. We further used genetic experiments to create embryos containing one to four copies of the sna-hb transgene (see Experimental Procedures), and quantified the relative levels of ectopic Hb expression (Figure 3A–F). In embryos carrying one copy of the transgene, the ventral domain expressed Hb at a level equal to ~18% of [Hb]max. Increasing to two and four copies raised the maximum level of ectopic Hb to ~36% and ~60% of [Hb]max.
Figure 3.
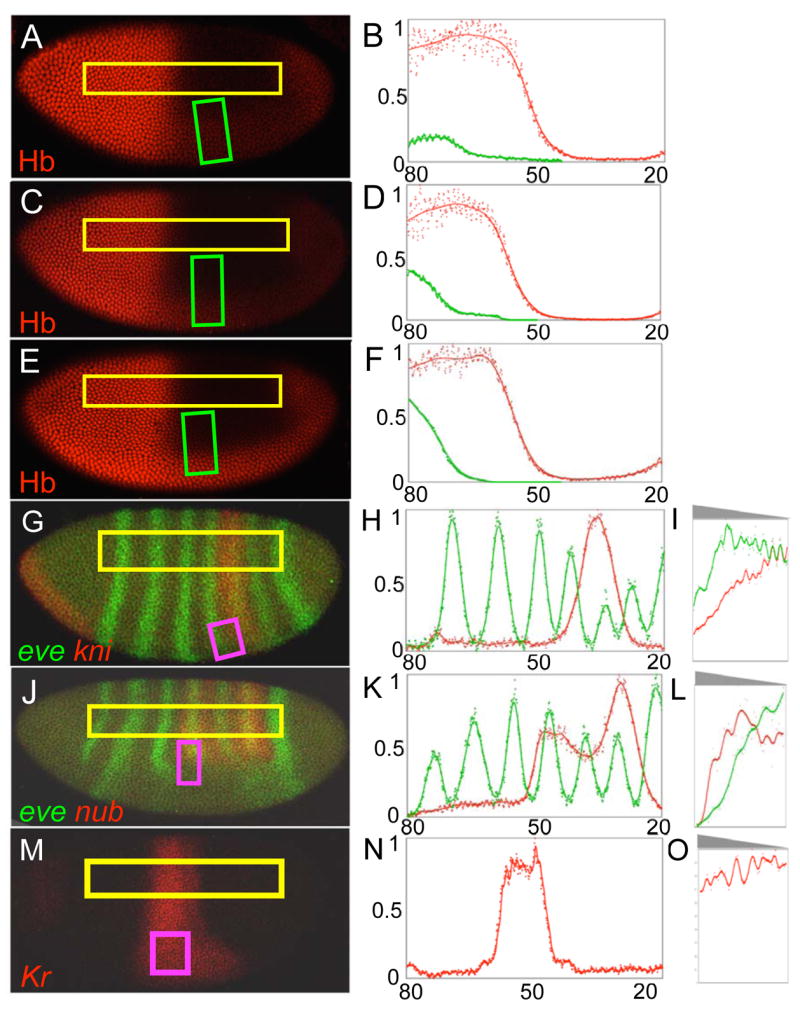
Target genes responses to ventral mis-expression of Hb. A-F. Hb protein staining patterns are shown for embryos containing one (A), two (C), or four (E) copies of the sna-hb transgene. Quantitative analyses of the ROIs (yellow boxes for the endogenous Hb profile, and green boxes for ventral expression domains) are shown to the right of each embryo (B, D, F). G-O. RNA expression patterns of target genes eve (green) and kni (red) (G, n=4), eve (green) and nub (red) (J, n=5) and Kr (red) (M, n=9) were examined in embryos containing 1 (G and M) or 2 copies (J) of the sna-hb transgene. Quantitative data for the endogenous expression patterns were collected from the longitudinal ROIs (yellow boxes), and are represented by the plots in H, K and N. ROIs represented by the purple boxes in G, J and M were used to quantify relative sensitivities to Hb-mediated responses, and are represented in the graphs in I, L and O. The grey triangles above I, L, and O show the orientation of the ventral gradient(s) with respect to the graphs below.
If differential sensitivity to Hb-mediated repression controls the relative positioning of target gene expression patterns in wild type embryos, then endogenous genes located more posteriorly should be more sensitive to repression by the ectopic gradient. This prediction was tested in three ways: First, we examined target gene expression patterns in embryos containing different copy numbers of the sna-hb transgene. In these experiments, one copy caused ventral repression of the five posterior-most target patterns (nub, pdm2, eve 4, kni, and gt; Figure 4A–F; data not shown). This is expected since one copy produces only ~18% of [Hb]max, and the anterior boundaries of all these patterns are located in regions that normally contain ~12% [Hb]max or less (Table 1). One copy of the transgene failed to repress the two patterns located more anteriorly (Kr and eve 3; Figure 4A, D). However, increasing the copy number of the sna-hb transgene to 2 or 4 causes repression of eve 3 (Figure 4D–F), which has an anterior boundary positioned where there is ~40% [Hb]max (Table 1). In contrast, ectopic Hb failed to repress Kr, even in embryos with four copies of the sna-hb transgene, but caused a posterior expansion of the Kr mRNA pattern along the ventral surface of the embryo (Figure 4G–I). This is consistent with the hypothesis that relatively low levels of Hb are required for activation of Kr [20, 21, 26].
Figure 4.
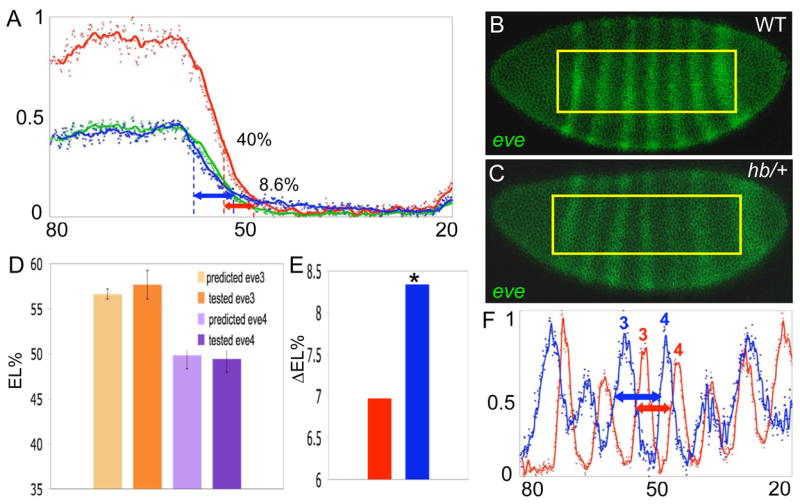
Threshold-dependent positioning of eve 3 and eve 4. A. Hb concentration profiles are shown for a wild type embryo (red curve) a hb/+ embryo (blue curve), along with a predicted hb/+ profile generated by dividing the expression levels at every position of the wild type profile by two (green curve). The AP positions where levels of Hb correspond to 50% repression of eve 3 and eve 4 in wild type embryos are marked by red dashed lines. The predicted positions of these boundaries in hb/+ embryos are marked with blue dashed lines. Red and blue arrows mark the distance between the anterior boundaries of eve 3 and eve 4 in wild type and hb/+ embryos respectively. B, C. eve RNA patterns in wild type and hb/+ embryos. The predicted and tested positions of eve 3 and eve 4 in hb/+ embryos are compared in D (n=9 each). Error bars represent standard deviations. E. The distance between the anterior boundaries of eve 3 and eve 4 in wild type (red) embryos is significantly shorter than in hb/+ embryos (blue) (p<0.0001). F. Data from the ROIs (yellow boxes in B and D) are plotted for comparisons of the positioning of the stripes. Red and blue plots represent data from B and C respectively. The arrows represent the distance between the measured anterior boundaries of eve 3 and eve 4 in B and C respectively.
Second, we performed double RNA in situ experiments to compare sensitivities to Hb-mediated repression between genes whose boundaries lie adjacent to each other along the AP axis (Figure 4, data not shown). For all pairs tested except one (kni and gt), clear differences in sensitivity were observed, which correlated perfectly with their positions in wild type embryos. For example, eve 4 is less sensitive than kni to ectopic Hb, and its anterior boundary is positioned anterior to the kni boundary in wild type embryos (Figure 4A–C). Also, eve 4 is more sensitive than nub to repression by ectopic Hb, and its anterior boundary is positioned slightly more posteriorly in wild type embryos (Figure 4D–F). In summary, five expression patterns could be organized by their relative sensitivities to Hb-mediated repression, with eve 3 being the least sensitive, followed by nub and pdm2, eve4, and kni in that order. These boundaries correspond to a specific part of the Hb gradient that ranges from ~40% [Hb]max for eve 3 to ~4.4% [Hb]max for kni (Table 1).
Finally, if target gene expression patterns are established by threshold concentrations of Hb, it should be possible to predict how far they would shift in heterozygous embryos that contain only one functional hb gene. We tested this idea using a strong allele (hb12), which was previously classified as a protein null [38, 39]. Hb gradient profiles were directly measured in hb/+ embryos, or estimated by dividing the Hb concentration profiles in wildtype embryos by 2 at each AP position (n=10). Both methods gave very similar results (Figure 4A). We then converted the AP positions of the eve 3 and eve 4 boundaries in hb heterozygotes (Figure 4D) using the relative Hb concentrations that correspond to these boundaries in wild type (Table 1), and experimentally measured the AP positions of these two boundaries in wild type and hb/+ embryos (n=9 each, see examples in Figure 4B, C). The predicted positions of the eve 3 and eve 4 boundaries in hb/+ embryos (56.6±0.5 %EL and 49.9± 1.4 %EL) were in excellent agreement with the observed positions (57.7±1.5%EL and 49.4±1.5%EL). Also, the gradient profiles in wild type and hb/+ embryos predict that the eve 3 boundary should shift farther in hb/+ embryos than the eve 4 boundary (Figure 5A), resulting in a larger distance between eve 3 and eve 4. Consistent with this prediction, the measured distance between eve 3 and eve 4 is significantly larger in hb/+ than in wild type embryos (Figure 5E, F. p<0.0001). Taken together, these results support the hypothesis that specific Hb concentrations control the differential placement of these two boundaries.
Figure 5.
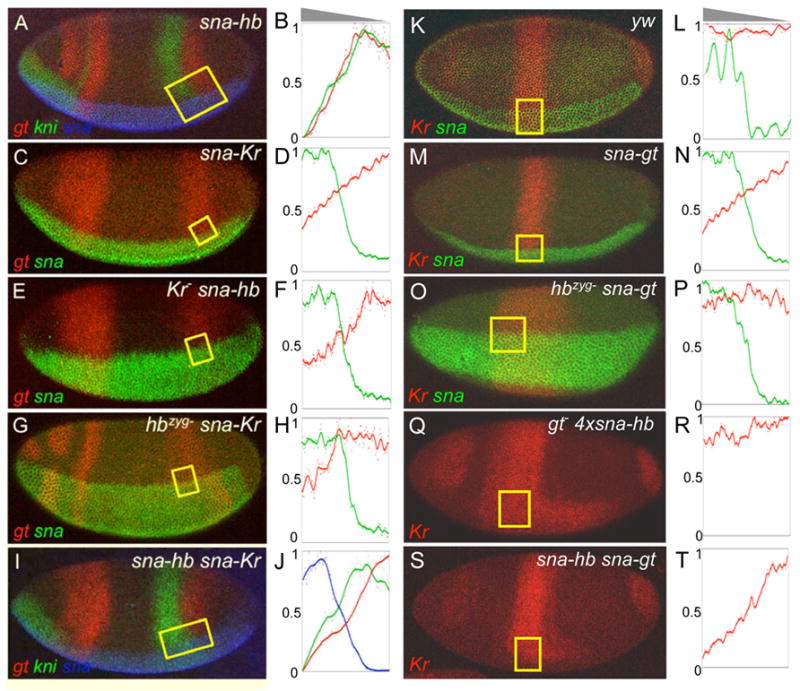
Hb functions with other gap proteins to repress the anterior boundaries of gt and Kr. Wild type (yw) and homozygous mutant embryos containing sna-hb, sna-Kr, sna-gt, or combinations of two transgenes (indicated on the upper right hand corner of each panel) were stained by in situ hybridization to detect various RNA expression patterns (indicated on the lower left hand corner of each panel). The sna expression boundary provides a landmark for identifying position along the dorsal-ventral axis, and was used to position and orient the ROIs (yellow boxes). Data collected from the ROIs is shown schematically in the graphs to the right of each embryo photograph. Embryos in Q and R were stained with Kr probe only in order to better visualize the posterior expansion of the Kr domain along the ventral surface caused by mis-expression of Hb. The grey triangles above B and L show the orientation of the ventral gradient(s) with respect to all graphs below.
Combinatorial repression of the posterior gt expression domain by Hb and Kr
An exception to the correlation between relative sensitivities to Hb-mediated repression and the positioning of endogenous expression patterns was discovered by comparing the effects of ectopic Hb on kni and gt. In the posterior region of wild type embryos, the anterior boundary of kni lies 7–8 nuclei anterior to the gt boundary (Figure 6A), and both boundaries shift anteriorly in hb mutants. However, we could not detect any difference in the degree of repression mediated by the ventrally expressed Hb gradient (Figure 6A, B). This result argues against the hypothesis that differences in Hb concentration cause the differential positioning of these two genes in wild type embryos.
Figure 6.
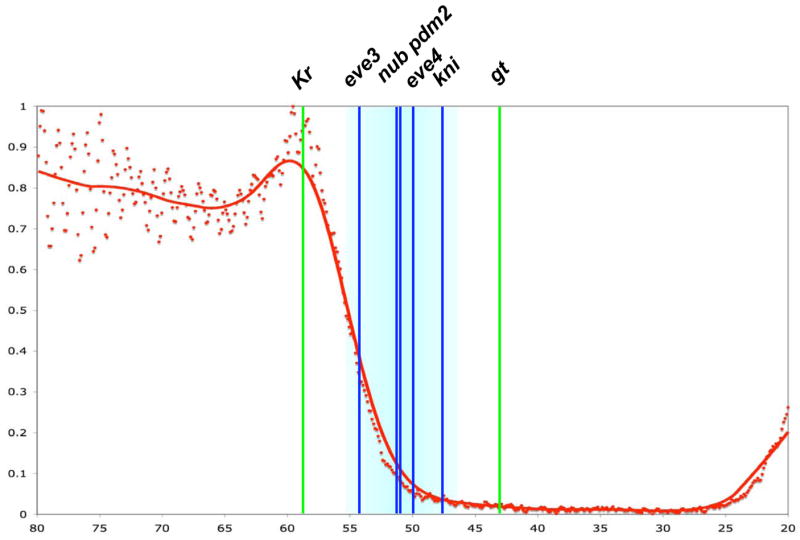
A. A morphogenetic range for the Hb repression gradient. The Hb gradient profile shown (red) is derived from a wild type embryo at mid-cycle 14. The positions of four boundaries (blue vertical lines) lie within the morphogenetic range (light blue shading), while two other boundaries (green vertical lines) lie outside this region.
One possible explanation is that Hb functions combinatorially with another protein in repression of gt, and an obvious candidate is Kr, which expands posteriorly along the ventral surface in embryos carrying sna-hb (Figure 4G). Consistent with this hypothesis, an ectopic Kr gradient created by a sna-Kr transgene causes a weak, but reproducible repression of the posterior gt domain (Figure 6C, D). To further test the relationship between Hb and Kr in repression of gt, we mis-expressed each gene in embryos lacking the zygotic contribution of the other gene. In these experiments, both genes directed a weak repressive effect in the absence of the other (Figure 6E–H). The simultaneous mis-expression of both genes caused a stronger repression of gt (Figure 6I). Interestingly, when we stained these embryos with both kni and gt probes, we detected a stronger repressive effect on gt compared to kni (Figure 6I, J), which is consistent with the positioning of these genes along the AP axis in wild type embryos. Together, these results suggest that Hb functions with Kr in setting the anterior boundary of gt expression.
Hb functions via the gap protein Gt to maintain the anterior Kr boundary
Ectopic expression of Hb driven by sna-hb does not cause any detectable repression of Kr, even in embryos containing four copies of the transgene (Figure 4G–I; data not shown). One possibility is that the levels of Hb produced by the sna-hb transgene are insufficient for repression, although with four copies, the relative amount of mis-expressed Hb (60%) surpasses the amount present at the position of the Kr boundary in early wild type embryos (Figure 2D, F). These results suggest a more complex mechanism for establishing and maintaining the anterior Kr boundary.
Previous studies in Drosophila and other insects suggested that another gap gene, giant (gt), is involved in setting the anterior Kr boundary [21, 40–42]. In Drosophila, the anterior Gt domain forms a gradient that abuts the anterior Kr boundary, with virtually no overlap between Gt and Kr at any time during blastoderm formation [[43]; Supplemental Figure 2A–C]. To test whether Gt is sufficient for Kr repression, we examined Kr expression in embryos containing a sna-gt transgene [14]. These embryos showed a significant repression of Kr in ventral regions (Figure 7C, D). To further test the relationship between Gt and Hb in repression of Kr, we expressed ectopic domains of each gene in mutant embryos lacking the zygotic function of the reciprocal gene. The genetic removal of gt had no effect on the activity of ectopic Hb, which continued to activate Kr, with no visible sign of repression (Figure 7G, H). By contrast, the genetic removal of hb strongly prevented repression of Kr by ectopic Gt (Figure 7E, F). These experiments support the hypothesis that Gt is the major factor in maintaining the anterior Kr boundary, and that Hb is required to potentiate Gt’s repression activity. Ectopic expression of both proteins causes a strong repression of the endogenous Kr domain, as well as repression of the posterior expansion of Kr expression caused by the presence of the sna-hb transgene alone (Figure 7I, J). This is consistent with the hypothesis that Hb is primarily involved in activation of Kr at this time in development, but when coexpressed with Gt, the combination of the two proteins is strong repressor.
The preceding arguments do not explain the observation that the anterior Kr boundary expands anteriorly in zygotic hb mutants. One possibility is that Hb function is required for the initial positioning of the anterior Gt domain [44], which then positions the anterior Kr boundary. To test this hypothesis, we examined Gt protein and Kr mRNA distribution in embryos lacking zygotic hb. These embryos show a clear anterior shift of the anterior Gt expression domain (Supplemental Figure 2D–F). We also detected a significant overlap between Gt protein and Kr mRNA, which is never seen in wild type embryos. This supports the hypothesis that Gt is a less effective repressor in the absence of zygotic Hb.
Discussion
A defined range of morphogenetic activity for the Hb repression gradient
We have measured the relative Hb concentrations associated with the positions of seven expression boundaries, and tested whether different Hb concentrations can account for the differential positioning of these boundaries along the AP axis of the Drosophila embryo. These experiments lead to the following conclusions.
The Hb gradient functions as a bona fide repressive morphogen for five target gene expression boundaries, eve 3, nub, pdm2, eve 4, and kni, all of which appear to be positioned primarily, if not exclusively, by specific thresholds of Hb concentration. These boundaries move anteriorly in concert with the dynamic changes of the Hb gradient in wild type embryos, they shift anteriorly in zygotic hb mutants, and their sensitivities to repression by ectopically expressed Hb are consistent with their relative positions in wild type embryos. Two other boundaries, the anterior boundary of Kr and the anterior boundary of the posterior gt domain, are established by combinatorial mechanisms involving Hb and Gt, and Hb and Kr, respectively.
There is a specific concentration range (~40% to ~4.4% [Hb]max) that mediates the major morphogenetic activities of the Hb repression gradient (Figure 8). Within this range, we detect four thresholds, one at ~40% [Hb]max that sets the anterior boundary of eve 3, one at ~12% [Hb]max that sets the anterior boundaries of both nub and pdm2, one at ~8% [Hb]max that sets the anterior boundary of eve 4, and one at ~4.4% [Hb]max that sets the anterior boundary of kni. These results suggest that these five target genes are exquisitely sensitive to small changes in Hb concentration. Hb also acts as a direct repressor to position the anterior boundary of the Hox gene Ultrabithorax (Ubx), which is first activated in late cycle 14 just before the initiation of gastrulation [45, 46]. The anterior Ubx boundary is positioned between the eve 3 and eve 4 boundaries, and thus may represent a fifth threshold within the morphogenetic range described here. Ventral misexpression of Hb causes a strong repression of Ubx (data not shown). However, it was not possible to directly compare the sensitivity of Ubx with the other target genes because the patterns of these genes have begun to decay when Ubx is first activated.
Mechanisms of differential target gene sensitivity
Previous studies have identified discrete regulatory elements that recapitulate the five expression patterns within the morphogenetic range described here [25, 28, 29, 47, 48]. All these elements contain multiple Hb binding sites, and one attractive model is that differences in sensitivity are determined by the quantity and/or quality of their Hb binding sites. The more sensitive eve 4+6 enhancer seems to contain a stronger cluster of Hb-binding sites than the less sensitive eve 3+7 enhancer, which is consistent with this hypothesis [17]. However, in preliminary experiments, we have found that this simple model can not be applied to the five target genes shown to be differentially sensitive here (Supplemental Figure 3). For example, the kni expression pattern is more sensitive to Hb-mediated repression than either eve 3 or eve 4, but its enhancer sequence does not appear to have a stronger cluster of Hb binding sites than either the eve 3+7 or the eve 4+6 enhancer. Similarly, two enhancer elements have been found to be associated with the pdm locus, which contains both nub and pdm2 [22]. When tested in reporter genes, both enhancers drive patterns of gene expression similar to the endogenous nub and pdm2 patterns [25, 47], but they do not appear to contain similar clusters of Hb sites.
If differential sensitivity cannot be linked to differences in the number or affinity of Hb-binding sites for this set of regulatory elements, other architectural features may control the level of Hb required for repression. These features may include changes in spacing between adjacent Hb sites, or specific site orientations that affect cooperative binding. Also, specific arrangements between repressor and activator sites may influence the apparent sensitivities. Consistent with this, Zinzen and coworkers have recently shown that specific arrangements between Dl and Twi sites are critical for Dorsal-dependent target gene expression in the prospective neuro-ectodermal region along the DV axis [49]. A careful analysis of the enhancer elements that respond to Hb-mediated repression will be required to fully understand the molecular rules that govern differential sensitivity.
The limits of the morphogenetic range
At the low end of the effective morphogenetic range, there is a ~2-fold difference between the Hb concentration at the eve 4 boundary (~8% [Hb]max) and the amount at the kni boundary (~4.4% [Hb]max). Moving farther posteriorly, from the kni boundary to the gt boundary, does not correlate with a significant drop in the relative Hb concentration (~4.4% [Hb]max - ~3.7% [Hb]max). We propose that the slope of the gradient in this region is too shallow for differential target gene positioning. However, by participating in a combinatorial mechanism with Kr, the very low concentrations of Hb in this region can set the gt boundary in a more posterior than the kni boundary. Hb and Kr both bind to the regulatory element that drives posterior expression of gt [25, 50], suggesting that these interactions may be direct.
Within the morphogenetic range, the anterior-most boundary is that of eve 3, which corresponds to ~40% [Hb]max. Outside this range on the anterior side is the Kr boundary, which was previously shown to expand anteriorly in zygotic hb mutants. In our experiments, Kr appeared to be quite resistant to repression by ectopic Hb, which seemingly contradicts a previous study by Schulz and Tautz, which showed that high levels of Hb were sufficient for repression. However, in that study, ectopic Hb was provided maternally, significantly before the sna-hb transgene used here would be activated. Together, the two studies support the idea that the Kr boundary is initially set independently by Hb, and that maintenance of the boundary requires both Hb and Gt activities. Our results suggest that maintenance is mediated primarily by Gt, but that Gt is an effective repressor only in the presence of Hb. The potentiating effect of Hb on Gt-mediated repression may involve direct binding of Hb and Gt to the Kr promoter, which contains binding sites for both proteins [51, 52],
A universal range of activity for gradient morphogens?
One of the most important findings from our study is that the effective range of Hb’s morphogenetic activity is between 40% [Hb]max and 4.4% [Hb]max. This range may seem surprising in light of the fact that Hb is expressed at much higher levels throughout the anterior half of the embryo. Previous studies suggest that anteriorly expressed Hb is required for activation of most Bcd-dependent target genes, which are expressed in a variety of anterior patterns [8, 11], and that the zygotic stripe of Hb expressed at the position of PS4 is required for the activation of the Hox gene Antennapedia [42] We propose that the high level of Hb protein in anterior regions also provides a reservoir, or buffer, that ensures that the repressive gradient, with all its thresholds, remains intact in individual embryos that vary in their absolute levels of Hb expression. Such a buffering mechanism could explain how heterozygous embryos, which contain roughly half the concentration of Hb, can nonetheless develop normally.
We propose further that most other morphogens will function via concentration ranges similar to the one measured in this study. The two best-studied morphogens in Drosophila are Bcd and Dorsal (Dl), both of which are viable and fertile in the heterozygous state. In embryos laid by bcd/+ females, there are dramatic shifts in the positioning of target genes in the early embryo [9, 10], but the order of gene positioning remains unchanged, the embryos survive to adulthood, and the adults are fertile. Survival would not be possible if activation of a critical target gene required a threshold greater than 50% of the maximum concentration of Bcd.
Experimental procedures
Fly stocks and crosses
yw embryos were used as wild type (WT). We used the following mutant alleles: hb12, gtX11, Kr1. All are null alleles. Embryos containing combinations of activated transgenes and mutant alleles were generated by traditional genetic crosses. To identify hb heterozygous embryos, hb12/TM3-sb hb-lacZ flies were crossed to yw flies. Embryos stained negative of lacZ probes are hb/+ and thus compared to embryos stained with lacZ (wild type).
Ventral mis-expression of the gap genes
Mis-expression constructs were made by fusing the cDNAs for the genes to be misexpressed to a 0.8-kb α-tubulin 3′ UTR fragment, and cloned into the pCaSpeR-sna transformation vector [14]. This vector contains an FRT-flanked transcription stop cassette positioned between the sna promoter and the site for insertion of the cDNA to be misexpressed. Methods for constructing the sna-hb and sna-gt transgenes used here were previously described [14, 17]. For the sna:Kr construct, a 2kb Kr cDNA containing the Kr 3′UTR fragment was blunt ended and cloned into the PmeI site of pCas-sna [14]. Transgenic lines were generated by microinjection into a y1w67c23 background [53], mapped, balanced, and made homozygous. Several combinations of individual sna-hb transgenes were recombined onto the single chromsomes to generate embryos with multiple copies. Embryos containing four copies of the sna-hb transgene were generated from parental stocks that were homozygous for two insertions each on both the second and third chromosomes. Transgenes were activated by crossing with a β-2-tubulin FLP construct, which catalyzes removal of the stop cassette in the male germline [54].
Fluorescent in situ hybridization (FISH) and immunohistochemistry
Two to four hour embryos were collected, and double-stained for protein and RNA [42], or for two different RNAs [55]. Embryos were incubated with labeled 2.0–4.0 μl per RNA probe per 100μl hybridization solution for 30–36 hours at 55°C. For digoxigenin (DIG)-labeled probes and fluorescein (FITC)-labeled probes, we used a sheep anti-DIG primary antibody and a mouse anti-FITC primary antibody (Roche), both at 1:300 dilutions in PBT (PBS+0.1%Tween20). For biotin-labeled probes, we used the RENAISSANCE® TSA™ fluorescence system (PerkinElmer™) for detection. Hb protein was detected using a guinea pig anti-Hb antibody, and Gt protein was detected using a rabbit anti-Gt antibody [56]. Both primary antibodies were diluted 1:400 in PBT. For fluorescent detection, the following secondary antibodies were used: donkey anti-sheep, donkey anti-mouse, donkey anti-guinea pig and donkey anti-rabbit conjugated with Alexa Fluor® 488, 555 and 647nm dyes. We did not use Tyramide amplification of fluorescent signals of the AP genes to maximize the linearity across the full range of detection. We used Tyramide amplification for biotin labeled sna (Figure 6A and I) to identify embryo orientation and mark the sna boundary for comparing repression levels of kni and gt. Embryos were mounted in Aqua Poly/mount (Polysciences, Inc) and stored at −20°C.
Confocal microscopy
Whole embryo FISH and immunostaining images were taken using a Leica TCS SP2 confocal scanning microscope. Images were collected using the Leica confocal analysis software. Three different wavelengths were used to excite the fluorophores: 488, 555 and 647nm. For embryos labeled with two or three fluorescent antibodies, channels were scanned sequentially. Each channel was scanned eight times sequentially to reduce the background noise. Each fluorophore was swapped to minimize fluorophore acquisition artifacts. The fluorescence acquisition levels were set so that the maximum fluorescent intensity of each channel was below saturation. To examine spatial relationships along the AP axis, we examined lateral views of embryos. To quantify levels of ectopic Hb expression and compare sensitivities of target genes, we examined ventral-lateral (Fig.3 and Fig. 5) and sometimes ventral views (Fig. 5O). These experiments often involved the use of the lateral boundary of the endogenous sna mRNA expression domain as a positional landmark along the DV axis.
Image processing
The fluorescent intensity of single pixel in each channel ranged from 0 to 255 in an 8-bit scale. The fluorescent intensity of each channel in each focal plane was transferred into a 1024 × 1024 matrix. Two approaches were used in parallel to analyze the expression data matrices, both using MATLAB (Mathworks®).
A region outside of the fluorescently labeled embryo was chosen as background. The background noise was then deducted from the matrix. The AP axis was defined as the furthest two points of the stained region. The center of the embryo was defined as the center point of the AP axis. The DV axis crossed with the AP axis perpendicularly at the center point.
An adjustable ellipse was used to mask the shape of the embryo, with the major axis ends overlapping with the embryo’s anterior and posterior endpoints. The minor axis is the dorsal-ventral (DV) axis. The background was defined as the fluorescent intensity within the ellipse where there is no expression of the specified protein or mRNA.
Both approaches gave similar results in establishing the lengths of the AP and DV axes, but the second approach is significantly faster and more memory efficient. The data shown here were quantified using the second approach.
A square region of interest (ROI) was then defined according to the purposes of each experiment. For Figures 1, 2, 4, and Supplemental Figure 1, 2, ROIs were defined as the region between 80% and 20% EL along the AP axis and the middle 50% of the DV axis. For Figure 3, endogenous Hb profiles were assayed from an ROI defined as the region between 80% and 20% EL and middle 50% of the dorsal half. The ventral Hb mis-expression profiles in Figure 3 A, C and E were assayed from a second ROI, which was defined as the region between 45% and 55% EL axis and ventral half of the DV axis, positioned so that the ROI is perpendicular to the ventral surface of individual embryo. The second ROI of Figures 3 G, J and M, and ROIs of Figure 5 were chosen in the region where the Hb target genes were expressed or repressed, and positioned so that the sna mRNA expression boundary bisected the ROI in a perpendicular manner. These ROIs were rotated clockwise and plotted so that the sna boundary perpendicularly divides the graph in the middle. Distributions of the relative fluorescent intensities of different channels in the ROI of each individual embryo were calculated, smoothened and plotted using MATLAB (Mathworks®). The X axes in the graphs represent the %EL of the ROI, and the Y axes represent the relative concentration of protein/RNA stained.
Supplementary Material
Acknowledgments
We thank Dorothy Clyde for creating fly stocks with multiple copies of the sna-hb transgene, Mark Siegal for advice on statistical analyses and image processing, Jerry Huang for assistance in analyzing Hb site clusters in regulatory elements, and Ignatius Tan for assistance with the confocal microscope. Claude Desplan, Justin Blau, Paolo Struffi, Amanda Ochoa-Espinosa, and Gozde Yucel provided helpful comments on the manuscript. DY was supported in part by an NYU MacCracken Fellowship. This work was supported by National Institutes of Health grant number GM51946 to SS, and was conducted in a facility constructed with support from Research Facilities Improvement Grant C06 RR-15518-01 from the National Center for Research Resources, National Institutes of Health.
Footnotes
Publisher's Disclaimer: This is a PDF file of an unedited manuscript that has been accepted for publication. As a service to our customers we are providing this early version of the manuscript. The manuscript will undergo copyediting, typesetting, and review of the resulting proof before it is published in its final citable form. Please note that during the production process errors may be discovered which could affect the content, and all legal disclaimers that apply to the journal pertain.
References
- 1.Turing AM. The chemical basis of morphogenesis. Philosophical Transactions of Royal Society in London. 1952;B-237:37–84. doi: 10.1098/rstb.2014.0218. [DOI] [PMC free article] [PubMed] [Google Scholar]
- 2.Kerszberg M, Wolpert L. Specifying positional information in the embryo: looking beyond morphogens. Cell. 2007;130:205–209. doi: 10.1016/j.cell.2007.06.038. [DOI] [PubMed] [Google Scholar]
- 3.Lawrence PA, Struhl G. Morphogens, compartments, and pattern: lessons from drosophila? Cell. 1996;85:951–961. doi: 10.1016/s0092-8674(00)81297-0. [DOI] [PubMed] [Google Scholar]
- 4.Wolpert L. Positional information and the spatial pattern of cellular differentiation. Journal of Theoretical Biology. 1969;25:1–47. doi: 10.1016/s0022-5193(69)80016-0. [DOI] [PubMed] [Google Scholar]
- 5.Driever W, Nusslein-Volhard C. A gradient of bicoid protein in Drosophila embryos. Cell. 1988;54:83–93. doi: 10.1016/0092-8674(88)90182-1. [DOI] [PubMed] [Google Scholar]
- 6.Gregor T, Wieschaus EF, McGregor AP, Bialek W, Tank DW. Stability and nuclear dynamics of the bicoid morphogen gradient. Cell. 2007;130:141–152. doi: 10.1016/j.cell.2007.05.026. [DOI] [PMC free article] [PubMed] [Google Scholar]
- 7.Frohnhofer HG, Nusslein-Volhard C. Organization of anterior pattern in the Drosophila embryo by the maternal gene bicoid. Nature. 1986;324:120–124. [Google Scholar]
- 8.Ochoa-Espinosa A, Yucel G, Kaplan L, Pare A, Pura N, Oberstein A, Papatsenko D, Small S. The role of binding site cluster strength in Bicoid-dependent patterning in Drosophila. Proc Natl Acad Sci U S A. 2005;102:4960–4965. doi: 10.1073/pnas.0500373102. [DOI] [PMC free article] [PubMed] [Google Scholar]
- 9.Driever W, Nusslein-Volhard C. The bicoid protein determines position in the Drosophila embryo in a concentration-dependent manner. Cell. 1988;54:95–104. doi: 10.1016/0092-8674(88)90183-3. [DOI] [PubMed] [Google Scholar]
- 10.Struhl G, Struhl K, Macdonald PM. The gradient morphogen bicoid is a concentration-dependent transcriptional activator. Cell. 1989;57:1259–1273. doi: 10.1016/0092-8674(89)90062-7. [DOI] [PubMed] [Google Scholar]
- 11.Simpson-Brose M, Treisman J, Desplan C. Synergy between the hunchback and bicoid morphogens is required for anterior patterning in Drosophila. Cell. 1994;78:855–865. doi: 10.1016/s0092-8674(94)90622-x. [DOI] [PubMed] [Google Scholar]
- 12.Small S, Blair A, Levine M. Regulation of even-skipped stripe 2 in the Drosophila embryo. Embo J. 1992;11:4047–4057. doi: 10.1002/j.1460-2075.1992.tb05498.x. [DOI] [PMC free article] [PubMed] [Google Scholar]
- 13.Andrioli LP, Oberstein AL, Corado MS, Yu D, Small S. Groucho-dependent repression by Sloppy-paired 1 differentially positions anterior pair-rule stripes in the Drosophila embryo. Dev Biol. 2004;276:541–551. doi: 10.1016/j.ydbio.2004.09.025. [DOI] [PubMed] [Google Scholar]
- 14.Andrioli LP, Vasisht V, Theodosopoulou E, Oberstein A, Small S. Anterior repression of a Drosophila stripe enhancer requires three position-specific mechanisms. Development. 2002;129:4931–4940. doi: 10.1242/dev.129.21.4931. [DOI] [PubMed] [Google Scholar]
- 15.Small S, Kraut R, Hoey T, Warrior R, Levine M. Transcriptional regulation of a pair-rule stripe in Drosophila. Genes Dev. 1991;5:827–839. doi: 10.1101/gad.5.5.827. [DOI] [PubMed] [Google Scholar]
- 16.Stanojevic D, Small S, Levine M. Regulation of a segmentation stripe by overlapping activators and repressors in the Drosophila embryo. Science. 1991;254:1385–1387. doi: 10.1126/science.1683715. [DOI] [PubMed] [Google Scholar]
- 17.Clyde DE, Corado MS, Wu X, Pare A, Papatsenko D, Small S. A self-organizing system of repressor gradients establishes segmental complexity in Drosophila. Nature. 2003;426:849–853. doi: 10.1038/nature02189. [DOI] [PubMed] [Google Scholar]
- 18.Langeland JA, Attai SF, Vorwerk K, Carroll SB. Positioning adjacent pair-rule stripes in the posterior Drosophila embryo. Development. 1994;120:2945–2955. doi: 10.1242/dev.120.10.2945. [DOI] [PubMed] [Google Scholar]
- 19.Pankratz MJ, Seifert E, Gerwin N, Billi B, Nauber U, Jackle H. Gradients of Kruppel and knirps gene products direct pair-rule gene stripe patterning in the posterior region of the Drosophila embryo. Cell. 1990;61:309–317. doi: 10.1016/0092-8674(90)90811-r. [DOI] [PubMed] [Google Scholar]
- 20.Hulskamp M, Pfeifle C, Tautz D. A morphogenetic gradient of hunchback protein organizes the expression of the gap genes Kruppel and knirps in the early Drosophila embryo. Nature. 1990;346:577–580. doi: 10.1038/346577a0. [DOI] [PubMed] [Google Scholar]
- 21.Struhl G, Johnston P, Lawrence PA. Control of Drosophila body pattern by the hunchback morphogen gradient. Cell. 1992;69:237–249. doi: 10.1016/0092-8674(92)90405-2. [DOI] [PubMed] [Google Scholar]
- 22.Cockerill KA, Billin AN, Poole SJ. Regulation of expression domains and effects of ectopic expression reveal gap gene-like properties of the linked pdm genes of Drosophila. Mech Dev. 1993;41:139–153. doi: 10.1016/0925-4773(93)90044-x. [DOI] [PubMed] [Google Scholar]
- 23.Tautz D, Lehmann R, Schnurch H, Schuh R, Seifert E, Kienlin A, Jones K, Jackle H. Finger protein of novel structure encoded by hunchback, a second member of the gap class of Drosophila segmentation genes. Nature. 1987;327:383–389. [Google Scholar]
- 24.Tautz D. Regulation of the Drosophila segmentation gene hunchback by two maternal morphogenetic centres. Nature. 1988;332:281–284. doi: 10.1038/332281a0. [DOI] [PubMed] [Google Scholar]
- 25.Schroeder MD, Pearce M, Fak J, Fan H, Unnerstall U, Emberly E, Rajewsky N, Siggia ED, Gaul U. Transcriptional control in the segmentation gene network of Drosophila. PLoS Biol. 2004;2:E271. doi: 10.1371/journal.pbio.0020271. [DOI] [PMC free article] [PubMed] [Google Scholar]
- 26.Schulz C, Tautz D. Autonomous concentration-dependent activation and repression of Kruppel by hunchback in the Drosophila embryo. Development. 1994;120:3043–3049. doi: 10.1242/dev.120.10.3043. [DOI] [PubMed] [Google Scholar]
- 27.Hoch M, Seifert E, Jackle H. Gene expression mediated by cis-acting sequences of the Kruppel gene in response to the Drosophila morphogens bicoid and hunchback. Embo J. 1991;10:2267–2278. doi: 10.1002/j.1460-2075.1991.tb07763.x. [DOI] [PMC free article] [PubMed] [Google Scholar]
- 28.Fujioka M, Emi-Sarker Y, Yusibova GL, Goto T, Jaynes JB. Analysis of an even-skipped rescue transgene reveals both composite and discrete neuronal and early blastoderm enhancers, and multi-stripe positioning by gap gene repressor gradients. Development. 1999;126:2527–2538. doi: 10.1242/dev.126.11.2527. [DOI] [PMC free article] [PubMed] [Google Scholar]
- 29.Small S, Blair A, Levine M. Regulation of two pair-rule stripes by a single enhancer in the Drosophila embryo. Dev Biol. 1996;175:314–324. doi: 10.1006/dbio.1996.0117. [DOI] [PubMed] [Google Scholar]
- 30.Schroder C, Tautz D, Seifert E, Jackle H. Differential regulation of the two transcripts from the Drosophila gap segmentation gene hunchback. Embo J. 1988;7:2881–2887. doi: 10.1002/j.1460-2075.1988.tb03145.x. [DOI] [PMC free article] [PubMed] [Google Scholar]
- 31.Margolis JS, Borowsky ML, Steingrimsson E, Shim CW, Lengyel JA, Posakony JW. Posterior stripe expression of hunchback is driven from two promoters by a common enhancer element. Development. 1995;121:3067–3077. doi: 10.1242/dev.121.9.3067. [DOI] [PubMed] [Google Scholar]
- 32.Hulskamp M, Schroder C, Pfeifle C, Jackle H, Tautz D. Posterior segmentation of the Drosophila embryo in the absence of a maternal posterior organizer gene. Nature. 1989;338:629–632. doi: 10.1038/338629a0. [DOI] [PubMed] [Google Scholar]
- 33.Irish V, Lehmann R, Akam M. The Drosophila posterior-group gene nanos functions by repressing hunchback activity. Nature. 1989;338:646–648. doi: 10.1038/338646a0. [DOI] [PubMed] [Google Scholar]
- 34.Struhl G. Differing strategies for organizing anterior and posterior body pattern in Drosophila embryos. Nature. 1989;338:741–744. doi: 10.1038/338741a0. [DOI] [PubMed] [Google Scholar]
- 35.Driever W, Nusslein-Volhard C. The bicoid protein is a positive regulator of hunchback transcription in the early Drosophila embryo. Nature. 1989;337:138–143. doi: 10.1038/337138a0. [DOI] [PubMed] [Google Scholar]
- 36.Jaeger J, Surkova S, Blagov M, Janssens H, Kosman D, Kozlov KN, Manu Myasnikova E, Vanario-Alonso CE, Samsonova M, et al. Dynamic control of positional information in the early Drosophila embryo. Nature. 2004;430:368–371. doi: 10.1038/nature02678. [DOI] [PubMed] [Google Scholar]
- 37.Luengo Hendriks CL, Keranen SV, Fowlkes CC, Simirenko L, Weber GH, DePace AH, Henriquez C, Kaszuba DW, Hamann B, Eisen MB, et al. Three-dimensional morphology and gene expression in the Drosophila blastoderm at cellular resolution I: data acquisition pipeline. Genome Biol. 2006;7:R123. doi: 10.1186/gb-2006-7-12-r123. [DOI] [PMC free article] [PubMed] [Google Scholar]
- 38.Lukowitz W, Schroder C, Glaser G, Hulskamp M, Tautz D. Regulatory and coding regions of the segmentation gene hunchback are functionally conserved between Drosophila virilis and Drosophila melanogaster. Mech Dev. 1994;45:105–115. doi: 10.1016/0925-4773(94)90024-8. [DOI] [PubMed] [Google Scholar]
- 39.Lehmann R, Nusslein-Volhard C. hunchback, a gene required for segmentation of an anterior and posterior region of the Drosophila embryo. Dev Biol. 1987;119:402–417. doi: 10.1016/0012-1606(87)90045-5. [DOI] [PubMed] [Google Scholar]
- 40.Wu X, Vakani R, Small S. Two distinct mechanisms for differential positioning of gene expression borders involving the Drosophila gap protein giant. Development. 1998;125:3765–3774. doi: 10.1242/dev.125.19.3765. [DOI] [PubMed] [Google Scholar]
- 41.Brent AE, Yucel G, Small S, Desplan C. Permissive and instructive anterior patterning rely on mRNA localization in the wasp embryo. Science. 2007;315:1841–1843. doi: 10.1126/science.1137528. [DOI] [PubMed] [Google Scholar]
- 42.Wu X, Vasisht V, Kosman D, Reinitz J, Small S. Thoracic patterning by the Drosophila gap gene hunchback. Dev Biol. 2001;237:79–92. doi: 10.1006/dbio.2001.0355. [DOI] [PubMed] [Google Scholar]
- 43.Kraut R, Levine M. Mutually repressive interactions between the gap genes giant and Kruppel define middle body regions of the Drosophila embryo. Development. 1991;111:611–621. doi: 10.1242/dev.111.2.611. [DOI] [PubMed] [Google Scholar]
- 44.Eldon E, Pirrotta V. Interactions of the Drosophila gap gene giant with maternal and zygotic pattern forming genes. Development. 1991;111:367–378. doi: 10.1242/dev.111.2.367. [DOI] [PubMed] [Google Scholar]
- 45.Muller J, Bienz M. Sharp anterior boundary of homeotic gene expression conferred by the fushi tarazu protein. Embo J. 1992;11:3653–3661. doi: 10.1002/j.1460-2075.1992.tb05450.x. [DOI] [PMC free article] [PubMed] [Google Scholar]
- 46.White RA, Lehmann R. A gap gene, hunchback, regulates the spatial expression of Ultrabithorax. Cell. 1986;47:311–321. doi: 10.1016/0092-8674(86)90453-8. [DOI] [PubMed] [Google Scholar]
- 47.Berman BP, Pfeiffer BD, Laverty TR, Salzberg SL, Rubin GM, Eisen MB, Celniker SE. Computational identification of developmental enhancers: conservation and function of transcription factor binding-site clusters in Drosophila melanogaster and Drosophila pseudoobscura. Genome Biol. 2004;5:R61. doi: 10.1186/gb-2004-5-9-r61. [DOI] [PMC free article] [PubMed] [Google Scholar]
- 48.Rivera-Pomar R, Lu X, Perrimon N, Taubert H, Jackle H. Activation of posterior gap gene expression in the Drosophila blastoderm. Nature. 1995;376:253–256. doi: 10.1038/376253a0. [DOI] [PubMed] [Google Scholar]
- 49.Zinzen RP, Senger K, Levine M, Papatsenko D. Computational models for neurogenic gene expression in the Drosophila embryo. Curr Biol. 2006;16:1358–1365. doi: 10.1016/j.cub.2006.05.044. [DOI] [PubMed] [Google Scholar]
- 50.Berman BP, Nibu Y, Pfeiffer BD, Tomancak P, Celniker SE, Levine M, Rubin GM, Eisen MB. Exploiting transcription factor binding site clustering to identify cis-regulatory modules involved in pattern formation in the Drosophila genome. Proc Natl Acad Sci U S A. 2002;99:757–762. doi: 10.1073/pnas.231608898. [DOI] [PMC free article] [PubMed] [Google Scholar]
- 51.Hoch M, Schroder C, Seifert E, Jackle H. cis-acting control elements for Kruppel expression in the Drosophila embryo. Embo J. 1990;9:2587–2595. doi: 10.1002/j.1460-2075.1990.tb07440.x. [DOI] [PMC free article] [PubMed] [Google Scholar]
- 52.Capovilla M, Eldon ED, Pirrotta V. The giant gene of Drosophila encodes a b-ZIP DNA-binding protein that regulates the expression of other segmentation gap genes. Development. 1992;114:99–112. doi: 10.1242/dev.114.1.99. [DOI] [PubMed] [Google Scholar]
- 53.Small S. In vivo analysis of lacZ fusion genes in transgenic Drosophila melanogaster. Methods Enzymol. 2000;326:146–159. doi: 10.1016/s0076-6879(00)26052-7. [DOI] [PubMed] [Google Scholar]
- 54.Struhl G, Fitzgerald K, Greenwald I. Intrinsic activity of the Lin-12 and Notch intracellular domains in vivo. Cell. 1993;74:331–345. doi: 10.1016/0092-8674(93)90424-o. [DOI] [PubMed] [Google Scholar]
- 55.Kosman D, Mizutani CM, Lemons D, Cox WG, McGinnis W, Bier E. Multiplex detection of RNA expression in Drosophila embryos. Science. 2004;305:846. doi: 10.1126/science.1099247. [DOI] [PubMed] [Google Scholar]
- 56.Kosman D, Small S, Reinitz J. Rapid preparation of a panel of polyclonal antibodies to Drosophila segmentation proteins. Dev Genes Evol. 1998;208:290–294. doi: 10.1007/s004270050184. [DOI] [PubMed] [Google Scholar]
Associated Data
This section collects any data citations, data availability statements, or supplementary materials included in this article.