Abstract
Both epigenetic alterations and genetic variations play essential roles in tumorigenesis. The epigenetic modification of DNA methylation is catalyzed and maintained by the DNA methyltransferases (DNMT3a, DNMT3b and DNMT1). DNA mutations and DNA methylation profiles of DNMTs themselves and their relationships with chicken neoplastic disease resistance and susceptibility are not yet defined. In the present study, we analyzed the complexity of the DNA methylation variations and DNA mutations in the first exon of three DNMTs genes over generations, tissues, and ages among chickens of two highly inbred White Leghorn lines, Marek's disease-resistant line 63 and -susceptible line 72, and six recombinant congenic strains (RCSs). Among them, tissue-specific methylation patterns of DNMT3a were disclosed in spleen, liver, and hypothalamus in lines 63 and 72. The methylation level of DNMT3b on four CpG sites was not significantly different among four tissues of the two lines. However, two line-specific DNA transition mutations, CpG→TpG (Chr20:10203733 and 10203778), were discovered in line 72 compared to the line 63 and RCSs. The methylation contents of DNMT1 in blood cell showed significant epimutations in the first CpG site among the two inbred lines and the six RCSs (P<0.05). Age-specific methylation of DNMT1 was detected in comparisons between 15 month-old and 2 month-old chickens in both lines except in spleen samples from line 72. No DNA mutations were discovered on the studied regions of DNMT1 and DNMT3a among the two lines and the six RCSs. Moreover, we developed a novel method that can effectively test the significance of DNA methylation patterns consisting of continuous CpG sites. Taken together, these results highlight the potential of epigenetic alterations in DNMT1 and DNMT3a, as well as the DNA mutations in DNMT3b, as epigenetic and genetic factors to neoplastic diseases of chickens.
Introduction
The relationship between somatic epigenetic variations and genetic mutations of germlines has been an emerging area in exploring tumorigenesis [1], [2]. Epigenetic and genetic mechanisms all contribute to the development of cancers [3], [4], [5], [6]. Single nucleotide polymorphisms (SNPs) are quite common genetic mutations in general populations, and one third of SNPs in humans have been associated with increased or decreased risks of various diseases, including cancers [7], [8], [9], [10], [11], [12]. In contrast, epigenetics, first described by Conrad Waddington six decades ago, is defined as the heritable changes in gene expression that occur without an alteration in DNA sequence [13]. Aberrant DNA methylation, one of the epigenetic modifications, is mitotically heritable. The genomes of cancer cells are often hypomethylated in repetitive elements and hypermethylated in the promoter and/or the first exon region of tumor suppressor genes compared to their normal counter-parts [14], [15].
Three mainly active DNA methyltransferase genes, including DNMT1, DNMT3a and DNMT3b, are involved in the epigenetic control of DNA methylation processes at the cytosine of CpG dinucleotides [16], [17]. DNMT1 is the most abundant DNA methyltransferase in mammalian cells, and is considered to be the key maintenance methyltransferase in mammals [18], [19], [20]. DNMT3a and DNMT3b function as de novo methyltransferases and together are responsible for methylation pattern acquisition during gametogenesis, embryogenesis, and somatic tissue development as well as maintaining the silence of transposable elements and enhancing the stability of genome [21], [22], [23], [24]. The DNA methyltransferases are not limited to catalyzing DNA methylation, but also involved in the regulation of gene expression. For example, DNMT3l, the regulator of DNMT3a and DNMT3b, was identified to have lost DNA methylation level in cervival cancer patients [25]; DNA mutations in DNMT3b are of importance in cancer progression [26], [27] and ICF syndrome (immunodeficiency, centromere instability and facial anomalies, an autosomal recessive disease) in humans [28]. However, the epigenetic DNA methylation alterations and DNA mutations of DNMTs themselves and their association with the resistance or susceptibility of neoplastic disease are still poorly understood.
Neoplastic diseases, defined as any malignant growth or tumor resulting from abnormal or uncontrolled cell division, are serious problems in animal and human health [29], [30]. The tumors may spread to other parts of the body through the lymphatic system or the blood stream. Being a neoplastic disease, Marek's disease (MD) is not only a natural model for lymphomas overexpressing Hodgkin's disease, but a serious concern to the poultry industry as a cause of economical losses due to the cost of routine vaccination against MD [31], [32], [33], [34]. In order to explore the epigenetic and genetic background and develop better strategies in preventing the outbreak of neoplastic diseases in chickens, we initiated explorations to determine if the DNA methylation status and the single nucleotide polymorphisms (SNPs) of chicken DNA methyltransferase genes are related to susceptibility or resistance of neoplastic diseases. We tested this hypothesis in two unique chicken inbred lines (63 and 72) through pyrosequencing, sequencing, and quantitative RT-PCR analyses. The highly inbred line 63, developed and maintained at the Avian Disease and Oncology Laboratory (ADOL), is highly resistant to Marek's disease (MD) tumors induced by the MD virus (MDV), whereas the highly inbred line 72 is highly susceptible to MD tumors [35]. Moreover, based on the two inbred lines, 19 recombinant congenic strains (RCS) have been developed. These are the only RCSs in livestock species. This unique chicken model system provides a way to elucidate epigenetic and genetic mechanisms that may influence the susceptibility or resistance to neoplastic diseases [30], [36].
To examine the hypothesis, we first investigated tissue and age specific methylation profiles in the first exons of DNMT1, DNMT3a, and DNMT3b among chickens from the MD-resistant line 63, MD-susceptible line 72, and six RCSs by pyrosequencing technology. Pyrosequencing is a quantitative technique used to detect changes in DNA methylation patterns. This technique is advantageous for analyzing and quantifying the degree of methylation of multiple continuous CpG sites in one reaction [37]. Subsequently, DNA mutations were detected by PCR sequencing. Next, we examined the mRNA expression levels of the genes using quantitative RT-PCR. Finally, we explored a new statistical method to classify and test the methylation patterns. The relationship of epigenetic variations and genetic mutations of the DNMT genes between the two inbred lines was discussed. Our results suggested that the aberrant methylation profiles of DNMT1 and DNMT3a as well as CpG to TpG transitions in DNMT3b are complex epigenetic and genetic factors that may be involved with neoplastic disease susceptibility or resistance in chickens.
Results
The sketch of DNA methylation analysis of DNMTs in the inbred lines and RCSs of chickens
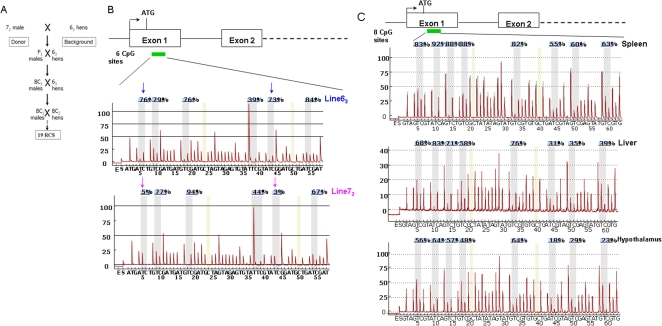
Previous studies have documented the distinct features of the chicken inbred lines 63 and 72 on neoplastic disease resistance or susceptibility as well as the genetic backgrounds of recombinant congenic strains (RCSs) [29], [36], [38], [39], [40]. Figure 1A shows that RCSs were intentionally established by crossing Marek's disease-resistant line 63 and -susceptible line 72. The F1 was then consecutively backcrossed to the background line 63 twice. A series of 19 RCSs were established by sib-mating of the second backcross (BC2) chickens. Each RCS on average carries a random sample of 87.5% background line 63 genome and 12.5% donor line 72 genome. The RCSs and their parental lines are a valuable resource for genetic and epigenetic analysis of neoplastic disease resistance and susceptibility.
Figure 1. Schematic structure of developing the recombinant congenic strains (RCSs) and quantifying DNA methylation levels of DNMT3b and DNMT3a genes.
A. The strategies to develop the 19 RCSs from the background line 63 and donor line 72; B. Upper panel, methylation analysis region on the first exon of DNMT3b. Position of transcription start site (black arrow), translation start code (ATG) and exons (open boxes) based on NCBI database (ID NM_001024828). Green box shows the position of the analyzed 6 CpG sites. Lower panel, DNA methylation pyrograms of six CpG sites in the first exon of DNMT3b in line 63 and line 72 using Pyro Q-CpG system. Grey areas indicate the CpG sites that were analyzed. The yellow regions indicate internal control regions for automatic assessment of bisulfite conversion (unmethylated C should be fully converted to T). Blue arrows and pink arrows show the methylation contents in CpG sites 1 and 5 in line 63 and line 72, respectively. C. Upper panel, methylation analysis region of 8 CpG sites on the first exon of DNMT3a (NCBI ID: 10HNM_001024832). Lower panel, DNA methylation pyrograms of 8 CpG sites in the first exon of DNMT3b in spleen, liver and hypothalamus. The percentages in each CpG site is the methylation percentage of mC/(mC+C) on this site. mC: methylated cytosine, C: unmethylated cytosine.
In this study, we firstly sought to explore the epigenetic variations of DNA methylation for the three DNA methyltransferase genes (DNMT3a, DNMT3b and DNMT1) among the two parental lines and six RCSs through pyrosequencing technology. We designed PCR primers and sequencing primers for methylation assays on the first exon of each DNMT gene as shown in Table 1 and Figure 1B and 1C. Pyrosequencing methylation analysis is based on using bisulfite converted DNA and PCR to quantitatively evaluate the methylated cytosine (mC) from unmethylated cytosine (C), and to quantify the methylation ratio by mC/(mC+C) at each CpG site. Pyrograms via pyrosequencing technology exhibit quantitative methylation level in each CpG site. As illustrated in Figure 1B, DNMT3b has different methylation profiles on the first exon in two highly inbred lines in blood cell. The methylation contents of DNMT3b at CpG sites 1 and 5 is seen to be much higher in line 63 (76% and 73%, respectively) than in line 72 (5% and 3%) in blood cell, whereas other 4 CpG sites show no obvious differences between the two lines. From Figure 1C, it is clear that DNMT3a shows different methylation profiles in spleen, liver, and hypothalamus, i.e., the average methylation contents of DNMT3a at 8 CpG sites were much higher in spleen (76.4%±14.6%) compared to that in liver (57.6%±20.1%) and in hypothalamus (44.75%±18.9%).
Table 1. PCR and pyrosequencing primers and assays for DNMT genes.
| GeneA | Assay CpG sitesB | Primers | SequenceC |
| DNMT3b | 6: 10203733 | Forward | 5′-GAGGGTTTTTTGGTTGGTTAAGT-3′ |
| 10203737 | Reverse | 5′-GGGACACCGCTGATCGTTTA CCTCCAACAACAAAACAACAATAT-3′ | |
| 10203747 | Sequencing | 5′-GTTATGAAAAAGGAGAAGAG-3′ | |
| 10203775 | Assay sequence | 5′-TTAYGGTYGG GATGAGGYGG ATTGTAGGGT AGAGTTGATTTTTTT YGAYG | |
| 10203778 | GGGATTGTAT YGATTTTATT-3′ | ||
| 10203790 | |||
| DNMT3a | 8: 107432308 | Forward | 5′-GGTTYGTCGTYGGTTGATTTG-3′ |
| 107432311 | Reverse | 5′-GGGACACCGCTGATCGTTTAAACCCCCCTACCTCACAACAAC-3′ | |
| 107432314 | Sequencing | 5′-TTGATTTGGATGTGTTTT-3′ | |
| 107432317 | Assay sequence | 5′-GTYGAYGGYGTYGGTTATTATAGGTTTAGGYGTGGTGGTTAYGTTGGGYGA | |
| 107432336 | GGTAGGGT YGGTGGGTTG -3′ | ||
| 107432347 | |||
| 107432354 | |||
| 107432365 | |||
| DNMT1 | 4: 49757939 | Forward | 5′-TGGGAAGAGGAAGGGGATAT-3′ |
| 49757957 | Reverse | 5′-GGGACACCGCTGATCGTTTA TCCCCAATAAAATCTCCTACCA-3′ | |
| 49757946 | Sequencing | 5′-GGAAGAGGAAGGGGATA-3′ | |
| 49757980 | Assay sequence | 5′-TYGATTTTTTGGAAAATAYGTTTAGGATGGTGGGTTGTYG GTYGGAGTTG-3′ | |
| Universal | 5′-/Biotin labeled/GGGACACCGCTGATCGTTTA-3′ |
A: Gene name. B: DNMT3b, based on the UCSC DNA sequence (May 2006, Chr20) that BLAT from DNMT3b cDNA sequence (NCBI: NM_001024828), it is in the exon1 region of DNMT3b. DNMT3a, based on the UCSC DNA sequence (May 2006, Chr3) that BLAT from DNMT3a cDNA sequence (NCBI: NM_001024832), it is in the exon1 region of DNMT3a. DNMT1, based on the UCSC DNA sequence (May 2006, Chr-Un-random) that BLAT from predicted DNMT1 DNA sequence (NCBI: NM_001475597). C: Y and R stand for C/T and G/A, respectively. Bold Y is the CpG sites assayed in each gene.
DNA methylation profiles of DNMT3b in different lines, tissues and ages
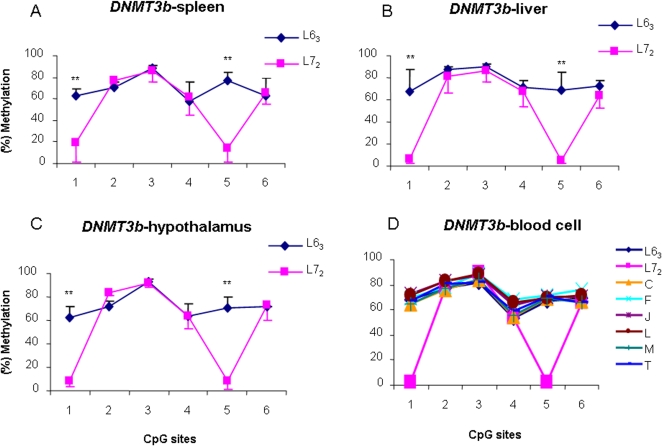
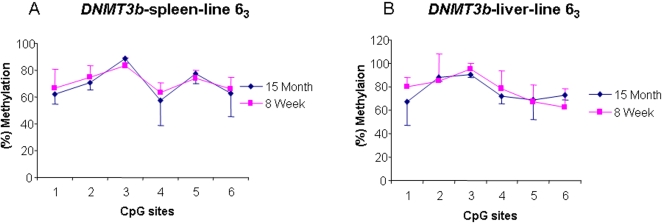
To further check the variations of DNA methylation patterns of the three chicken DNMTs, we examined DNA methylation levels of DNMT3b in four tissues at two ages of the two lines. Figure 2A, 2B, and 2C exhibited the methylation profiles of the DNMT3b in the spleen, liver and hypothalamus between lines 63 and 72 at 15 months of age. We found that the methylation levels of DNMT3b at CpG sites 1 and 5 were significantly higher in line 63 than in line 72 (P<0.01). We thereafter examined the methylation status of DNMT3b in spleen and liver in line 63 chickens of 2 months of age. As shown in Figure 3A and 3B, the methylation level of DNMT3b gene in spleen and liver shows a similar pattern in line 63 chickens of 2 and 15 months of ages (P>0.05). The results implied that the DNA methylation of DNMT3b does not have age specificity in line 63.
Figure 2. DNA methylation variations of DNMT3b in spleen (A), liver (B) and hypothalamus (C) in line 63 and 72, and in blood cell (D) in the two parental lines and the six recombinant congenic lines.
L63: lines 63; L72: lines 72. C, F, J, L, M and T: six recombinant congenic strains. n = 5 for each line and RCS.
Figure 3. DNA methylation profiles of DNMT3b in spleen (A) and liver (B) at 15 months and 8 weeks old in the line 63. n = 5 for each line.
Having observed distinct methylation patterns of DNMT3b in the parental lines 63 and 72, to check the epigenetic inheritance or epimutations of DNA methylation of the gene, we measured the methylation status of the DMNT3b gene in blood cell from the two parental lines and six RCSs, C, F, J, L, M and T. As shown in Figure 2D, we found that, in the eight chicken strains, the methylation patterns can easily be categorized into two groups, one of which is extremely similar to each other among 6 RCSs, which also closely resembles the background line 63 in contrast to the donor line 72. The results imply that the DNMT3b shows transgenerational epigenetic inheritance from background line 63 to six RCSs through meiosis for more than thirteen generations.
Line-specific SNPs and discrepant mRNA expressions of DNMT3b
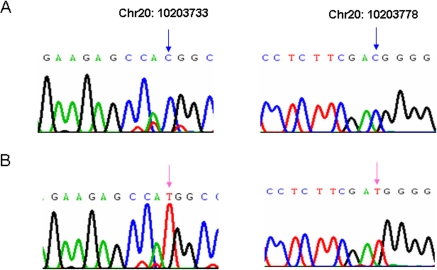
The extremely low methylation levels in the CpG sites 1 and 5 of DNMT3b, compared to other 4 CpG sites, suggested that this difference could be attributed to single nucleotide polymorphisms (SNPs) between the two inbred lines. Using DNA sequencing thereafter, two CpG to TpG transitions located in the same CpG sites 1 and 5 for DNA methylation analysis, were found in line 72 (Figure 4B) but not in line 63, the RCSs, or a wild-type chicken, a red jungle fowl (Figure 4A). Taking all this into consideration, the two line-specific SNPs of DNMT3b appear to be possible genetic factors that are involved in MD tumor susceptibility in the line 72.
Figure 4. Two CpG to TpG transitions in the first exon of DNMT3b by DNA sequencing.
A. Blue arrows show the cytosines in CpG sites 1 (Chr20: 10203733) and 5 (Chr20: 10203778) of DNMT3b in the line 63, RCSs (n = 3 for each strain) and red jungle fowl (n = 1). B. Pink arrows show the two CpG to TpG transitions in the line 72. n = 3.
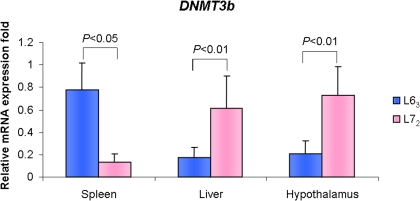
SNPs located in promoter/exon1 region of a gene may negatively or positively regulate the expression level of the gene. To ascertain the relationships, we then measured the level of DNMT3b mRNA in spleen, liver, and hypothalamus of 15 month-old chickens from the two parental lines via real-time quantitative RT-PCR. Unexpectedly, as shown in Figure 5, the mRNA level of DNMT3b in spleen was found to be significantly higher in line 63 than in line 72 (P<0.05), whereas it was significantly lower in liver and hypothalamus of line 63 than line 72 (P<0.01). The results suggested that DNMT3b may be involved in complicated regulation and/or expression mechanisms.
Figure 5. mRNA expression differences of DNMT3b in spleen, liver and hypothalamus between line 63 and line 72 at 15 months-old with quantitative RT-PCR.
Two replicates for each reaction. n = 5 for each line.
Tissue-specific methylation variations of DNMT3a in the line 72 and line 63
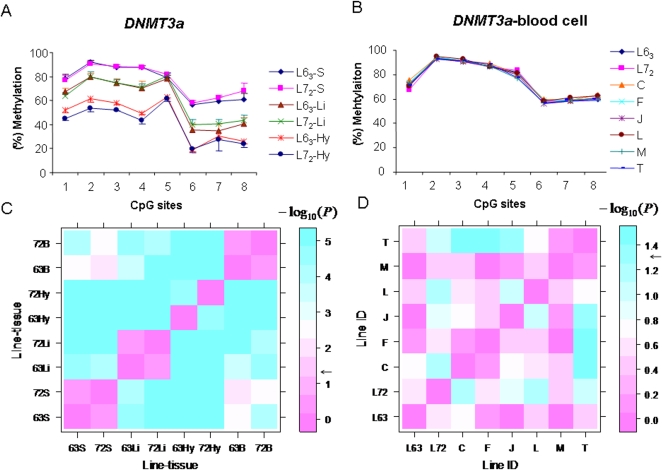
DNMT3a is another de novo DNA methyltransferase like DNMT3b. To examine the methylation profiles of DNMT3a, we conducted DNA methylation analysis of DNMT3a in tissues of chickens from the two age groups of the lines. As shown in Figures 6A, we found that the eight continuous CpG sites of DNMT3a displayed tissue-specific methylation patterns in both lines at 15 months of age, meaning that the highest level of DNA methylation was found in spleen (75.2%±2.5% in line 63 and 76.6%±2.5% in line 72) among the three tissues, followed by liver (line 63 = 60.1%±4.0%, line 72 = 61.8%±3.4%), and the lowest level was found in the hypothalamus (44.9%±1.7% in line 63, 40.8%±3.2% in line 72). Quantitative RT-PCR demonstrated that the mRNA expression of DNMT3a was significantly higher in spleen than in liver in the line 63 (n = 5, Figure S1A).
Figure 6. Tissue-specific DNA methylation variations and patterns analysis of DNMT3a in spleen, liver and hypothalamus (A) in line 63 and line 72, and in blood cell (B) in two lines and six RCSs, C, F, J, L, M and T.
L63: line 63; L72: line 72. S, spleen; Li: liver; Hy: hypothalamus. n = 5 for each line and RCS. C. P values matrix among lines and tissues using exact F test for DNA methylation patterns of DNMT3a. 63: line 63; 72: line 72. n = 5 for each. D. P values matrix for DNA methylation patterns of DNMT3a among two parental lines 63 and 72, as well as six RCSs. n = 5 for each. Color bar shows the extent of significance level (P values with −log 10(P). e.g., −log 10(0.05) = 1.3; −log 10(0.01) = 2). Black arrows show P = 0.05.
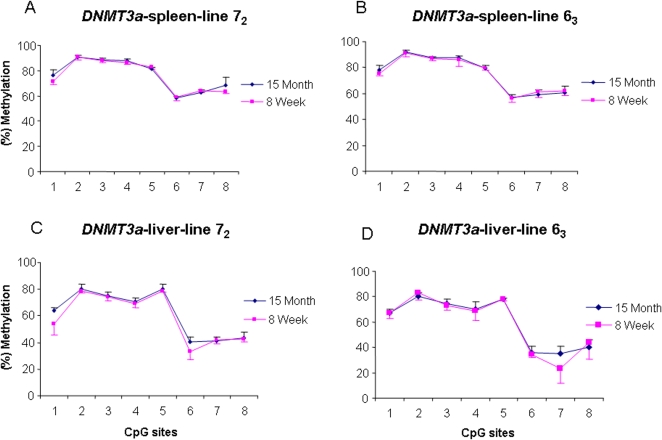
Interestingly, we noticed that the methylation levels of DNMT3a were very similar to each other in the two lines, but only one tissue, the hypothalamus, among three tissues, showed significantly higher methylation level in line 63 than in line 72 (P<0.01) at the first four CpG sites (Figure 6A). Like DNMT3b, the methylation level of DNMT3a gene also showed a similar pattern across the two ages (P>0.05), 2 month and 15 month old chickens , in spleen (Figure 7A and 7B) and liver (Figure 7C and 7D) of both lines. In addition, as shown in Figure 6B, DNA methylation patterns of DNMT3a in the two parental lines and six RCSs are almost the same as that in the blood cell at 12 months of age. These results indicate that, compared to DNMT3b, DNMT3a is a tissue-specific de novo DNA methyltransferase, and its methylation patterns and expression levels varied among the tissues.
Figure 7. DNA methylation profiles of DNMT3a in spleen (A, B) and liver (C, D) at 15 months and 8 weeks old in line 63 and line 72. n = 5 for each line.
Age-specific DNA methylation variations of DNMT1
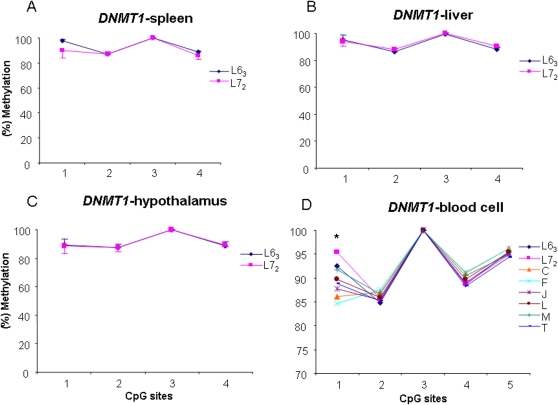
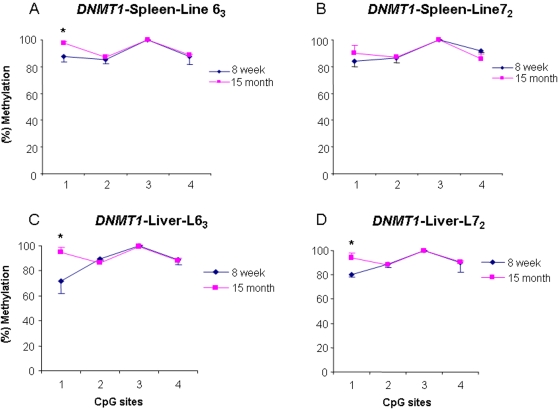
To maintain methylation patterns in daughter cells during DNA replication, the unmethylated daughter CpG site opposite to a methylated parental CpG site must be methylated by the maintenance methyltransferase, DNMT1. It is important, therefore, to investigate the methylation status of DNMT1 and compare it with the de novo methyltransferases in the unique chicken population. We quantitatively measured DNA methylation levels of four CpG sites in the exon1 region of DNMT1 in four tissues at three age stages. Our results indicated that DNMT1 had a similar methylation pattern in the spleen, liver, and hypothalamus (Figure 8A, 8B and 8C) between the two inbred lines at 15 months of age, whereas the CpG site 1 in blood cell showed a significant epimutation among the two parental lines and the six RCSs (P<0.05) (Figure 8D) at 12 months of age. Interestingly, comparing the methylation levels of DNMT1 between the two ages, we found that the methylation level of the CpG site 1 at two months of age was lower than that at 15 months of age in spleen (P<0.05) (Figure 9A) and liver (Figure 9C and 9D) for both the parental lines except in spleen of the line 72 (Figure 9B). The results indicated that DNMT1 is an epimutation gene with age-specific methylation patterns in the chickens.
Figure 8. DNA methylation variations of DNMT1 in spleen (A), liver (B) and hypothalamus (C) in the lines 63 and 72, and in blood cell (D) in the two parental lines and six recombinant congenic lines.
L63: lines 63; L72: lines 72. C, F, J, L, M and T: six recombinant congenic strains. * P<0.05. n = 5 for each line and RCS.
Figure 9. DNA methylation variations of DNMT1 in spleen (A, B) and liver (C, D) at 15 months and 8 weeks old in line 63 and line 72. * P<0.05. n = 5 for each line.
DNA methylation patterns analysis of DNMTs via principal component test
DNA methylation level is frequently aberrant on different CpG sites within one CpG island. Thus, analyzing only the average of methylation levels in continuous CpG sites may blur the major effect of the single CpG site. On the other hand, point-wise comparison can only be used to analyze the methylation difference of the same CpG site between different samples. To explore which CpG site in a continuous CpG sites region (CpG islands) is mainly responsible for the fluctuation of the methylation level and classification of methylation patterns, we developed a new method to quantitatively evaluate the methylation patterns of DNMTs via a nonparametric analysis method that transforms principle component analysis (PCA) as an exact F test.
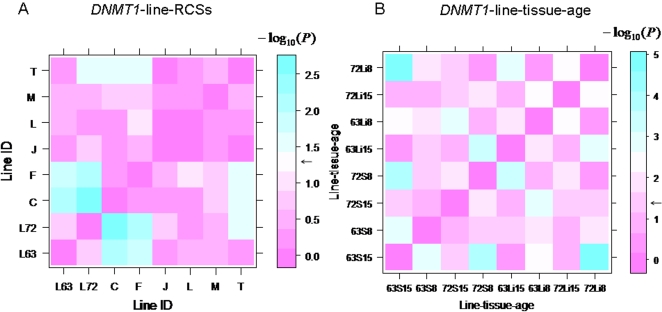
Through the exact F test, we can get the probability level of profile dissimilarity between any two groups. The P value matrix constructed from multiple profile comparison is plotted in Figure 6C. Pink between the groups means no significant differences (P>0.05), while the color gradient from pink to blue indicates the extent of significant differences (P<0.05). Consequently, it is easy to identify the significant tissue-specific differences of methylation patterns of DNMT3a among the spleen, liver, hypothalamus, and blood cell (P<0.001). Figure 6C shows a huge difference of methylation patterns in hypothalamus between the line 63 and line 72 (P<0.001), while no major differences in spleen, liver, or blood cell between the two lines were detected (P>0.05). From Figure 6D, the methylation patterns of DNMT3a among the two parental lines and six RCSs were not significantly different in blood cell (Figure 6B, P >0.05). Similarly for DNMT1, the differences of methylation patterns among the parental lines and RCSs in blood cell as well as in spleen and liver at two age stages were also analyzed as shown in Figure 10. From the Figure 10A, we found that RCS C and F in blood cell showed considerable discrepancy with the two parental lines in DNMT1 methylation patterns (P<0.05), whereas the other four RCSs showed no difference from either of the parental lines (P>0.05). Age-specific methylation pattern differences of DNMT1 at 15 months and two months of age was clearly shown in Figure 10B (P<0.05). Based on these results, we conclude that the description of differences and analysis of DNA methylation patterns including continuous CpG sites can be identified by this newly developed method.
Figure 10. Exact F test for DNA methylation patterns of DNMT1.
A. P values matrix among the two parental lines 63 and 72, as well as six RCSs, C, F, J, L, M and T. n = 5 for each. B. P values matrix among the lines, tissues on ages. 63: line 63; 72: line 72; S: spleen; Li: liver. 15: 15 months old; 8: 8 weeks old. n = 5 for each. Color bar shows the significance level (P values with −log 10(P). e.g., −log 10(0.05) = 1.3; log 10(0.01) = 2). Black arrows show P = 0.05.
Discussion
To date, the accumulating evidence of human cancers have been shown that the increased cytosine methylation levels at CpG dinucleotides of cancer suppressor genes on promoter regions and/or exon 1 or decreased methylation levels of repeat elements throughout the whole genome are highly associated with tumorigenesis [41]. In our previous report, we found the hypermethylation pattern of endogenous virus that may be relevant for resistance against tumors in chickens [31], which encouraged us to trace and analyze the epigenetic status and genetic variations of the gene family controlling DNA methylation in the unique tumor-resistant or -susceptible chicken populations. In this study, we underlined the complexity of epigenetic variations of DNA methylation and genetic mutations for three DNA methyltransferase genes (DNMTs) in two highly inbred chicken lines (63 and 72) and six recombinant congenic strains (RCSs) derived from the two inbred lines. To our knowledge, this study is the first to explore the DNA methylation variation profiles of DNMTs in tumor resistant or susceptible chickens. Due to lack of knowledge about the promoter locations of these genes in animals, the pilot assessment of DNA methylation was done on the first exon of these genes. Some of these variations may help us uncover the trigger of the susceptibility or resistance to neoplastic disease in chickens.
We found that the three DNMTs have unique epigenetic and genetic patterns in the chicken population. Among them, DNMT1 and DNMT3a showed epimutations of DNA methylation on the first exon, i.e., tissue-specific methylation of DNMT3a and age-specific methylation of DNMT1. Interestingly, the age-specific style shown by DNA methylation of DNMT1 may contribute to some forms of amyloidosis that develops with aging [42]. No DNA mutations of these two genes indicated that the regulation of related gene expression should be manipulated by epimutations of these genes. In addition, the mRNA expression data in the spleen and liver showed that high CpG methylation levels in the first exon of DNMT3a coincided with high transcription levels in spleen, and low methylation level coincided with low expression level in liver in line 63 birds (Figure S1A). Moreover, the similar CpG methylation patterns of DNMT1 in liver were also consistent with similar transcription levels (Figure S1B) in both lines 63 and line 72. The results were in good agreement with reported methylation studies, that is, the methylation level on the exons of MHC (Major Histocompatibility Complex) genes were positively related to the expression levels [43], [44]. Our unpublished data indicated that the tumor numbers induced by MDV are different among tissues in line 63 and line 72. Thus it is possible that the tissue-specific epimutations of DNMT3a is associated with the tumor number variations in different tissues.
On the contrary, CpG sites 2, 3, 4 and 6 in the first exon of DNMT3b (Fgiure 1) did not show statistical difference among the lines in tissues of varied age groups (Figure 2 and 3). Compared to resistant line 63, the six RCSs and a wild type chicken (red jungle fowl) (Figure 5A), the “methylation differences” at CpG sites 1 and 5 (Figure 2) of DNMT3b, hypermethylation in line 63 and unmethylation in line 72, are actually due to the CpG to TpG transitions in MD-susceptible line 72 (Figure 5B). A further analysis disclosed that the two transitions are synonymous mutations, but the two translation start codes (ATG) were created through the two mutations (Figure S2B). Because of the mutations, a new transcriptional binding site, PAX5 (B-cell specific activator protein), is discovered at the second mutation region in line 72, which replaced the original binding site, NUDR (Nuclear DEAF-1-related protein), on the same site in line 63 (Figure S2A and S2B). Therefore, we postulate that this crucial replacement might be related to susceptibility of neoplastic disease. It is reported that DNMT3b is an alternative splicing gene in mammals [45], [46]. Further investigations are needed to confirm whether or not there are harmonious combinations between the splicing structures, methylation status, and the two SNPs in chickens, as well as the genetic effect on chicken MD susceptibility or resistance. For the discrepant mRNA expression levels of DNMT3b among different tissues, that is, higher expression in line 63 than in line 72 in spleen, but lower expression in line 63 than line 72 in liver and hypothalamus, further investigations will follow to determine the effects of the DNA methylation variation on the promoter region of DNMT3b among different tissues and to explore any network mechanisms that may be involved.
Most importantly, the methylation patterns of the genes clearly exhibited an epigenetic inheritance of interest. To date, only a few genes have been shown to display epigenetic inheritance in mammals, such as axin-fused (AxinFu) [47] and yellow agouti (Avy) [48]. This observation supports that methylation patterns could be viewed as epigenotypes referring to mitotically heritable patterns of DNA methylation at CpG sites [49], [50]. The two highly inbred parental lines, 63 and 72, and the RCSs constitute unique resources for exploration of the nature of DNMT1, DNMT3a, and DNMT3b, which allow us to quantitatively measure methylation alterations of the three DNMTs in order to monitor whether epigenetic inheritance or epimutations of parental methylation patterns are passed on to subsequent generations. From the detailed methylation patterns of the parental lines and the RCSs plotted in Figures 2D (DNMT3b), 6B (DNMT3a), and 8B (DNMT1) we recognized that the methylation pattern of DNMT3a and DNMT3b in blood cell were inherited from the background line 63, whereas the methylation of DNMT1 in blood cell showed epimutaitons at the first CpG site between the six RCSs and their two parental lines. The plasticity of methylation patterns in DNMT1 might have offered reasonable explanation of the variability of resistance to MD among a series of 19 recombinant congenic strains (unpublished data). It is worth noting that after 13 generations of sib-mating, DNMT3a and DNMT3b in the RCSs still kept the methylation pattern of the background line 63, which resulted from epigenetic transgenerational inheritance. Although the epigenotype in the epigenome is far less stable than genotype of the DNA genome, the epigenetic inheritance of DNMT3a and DNMT3b and epimutations of DNMT1 in blood cell gives us an important clue on how to combine the epigenetic and genetic information to prevent neoplastic disease in chickens.
In our quantitative methylation analysis, DNA methylation patterns are continuous measurements of CpG sites. Traditional analysis methods based on normal distribution, such as t-test and ANOVA, are thus not suitable for the data characteristics. For pattern identification, when considering the most widely used methods, such as k-means, self-organizing map (SOM) and hierarchical clustering analysis, it has been argued recently that distance based methods generate local solutions that are not necessarily meaningful. Furthermore, identifying a priori the number of clusters remains, in general, an open problem. Therefore, determining the right pattern is a critical issue in epigenomic analysis. However, comparing methylation patterns between groups will allow us to test the influence of DNA methylation patterns on MD risk. In this study, we adopted a new method of analysis, known as principal component test, to classify DNA methylation patterns and validated it's feasibility in computational epigenetics. In principle, the PCA is a multivariate technique, which examines the relationships among the CpG sites by producing eigenvalue and principal component scores with variance, and then summarizes the CpG data in reduced dimensions. To assess a pattern-wise comparison, an exact F test was finally carried out to get a P value from the PCA transformation. This method can effectively classify the DNA methylation patterns in a continuous CpG sites region as illustrated in Figures 6, 10, S3, S4 and S5.
In summary, we characterized the unique epigenetic profiles and DNA mutations of three DNA methytransferase genes in chickens. Tissue-specific methylation pattern of DNMT3a, age-specific methylation pattern of DNMT1, and CpG to TpG transitions in DNMT3b might be associated with susceptibility of MD, which suggests new possibilities for etiological study, MD control, and genetic breeding of MD resistant chickens using these epigenetic and genetic factors.
Materials and Methods
Experimental Animals and Samples
Lines 63 and 72 White Leghorn chickens were initially selected at the Avian Disease and Oncology Laboratory in 1939 for tumor resistance or susceptibility induced by Marek's disease virus (MDV) and avian leukosis virus. Nineteen recombinant congenic strains (RCS) were developed using line 63 as the background line and line 72 as the donor line (Figure 1). Samples were collected from the two highly inbred chicken lines as well as six RCSs, M, T, F, J, C and L, which showed higher to lower MD tumor incidence difference from unvaccinated and vaccinated treatment results (our unpublished data). The line 63 is resistant to MD whereas the line 72 is susceptible. Heparinized blood samples were collected from each of the chickens prior to euthanasia. Five blood samples were collected from females of each parental line and each RCS at 2, 12 and 15 months of age and stored at −20°C until analyses. Tissue samples of line 63 and line 72 at 2 and 15 months of age were obtained from three organs: liver, spleen and hypothalamus. Tissue samples were frozen in liquid nitrogen immediately at sampling and stored at −80°C until analyses. All procedures followed standard animal care and use guidelines.
DNA extraction and bisulfite treatment
DNA was extracted from 20 µl red blood cells or 3 mm3 tissue samples using the phenol-chloroform method. DNA was precipitated in ethanol, pelleted and redissolved in TE (pH 8.0), and DNA concentration was measured by a spectrophotometer (Bio-Rad). Sodium bisulfite conversion of each sample of genomic DNA (1 µg) was performed using EZ DNA Methylation Golden Kit as described in the manufacturer's instructions (ZYMO Research). Bisulfite converted DNA was eluted in 20 µl elution buffer (ZYMO Research).
PCR and sequencing primers used in pyrosequencing assay
PCR assays were designed to amplify multiple CpG dinucleotides sites in the first exon of DNMT1, DNMT3a and DNMT3b. The principle of primer design is that the primers do not cover any CpG sites as far as possible. As shown in Table 1, forward and reverse primers of PCR assays and sequencing primer of pyrosequencing methylation assays were designed using PSQ Assay Design software (Biotage, Sweden). Based on the BLAT results from UCSC Genome Browser and the requirement of pyrosequencing techniques (PyroMarK ID, Biotag, Sweden), one 6-CpG-site region of the DNMT3b on chicken chromosome 20, 8-CpG-site region of the DNMT3a on chromosome 3 and 4-CpG-site region of the DNMT1 on one of microchromosome were analyzed (Table 1, Figure 1, Figure S6A, S6B and S6C). A biotin labeled universal primer (5′-GGGACACCGCTGATCGTTTA-3′) was used in the PCR assays [51]. The 5′ end of each reverse primer was tailed with the sequence as the universal primer (Table 1) [51].
Hot start PCR amplification
The hot start PCR was carried out in a 30 µl solution for DNMTs: 1.5 µl diluted bisulfite treated DNA (1∶5 dilution), 1×PCR buffer, 0.2 mM dNTPs, 0.5 µM forward primer, 0.05 µM reverse primer with universal tail, 0.45 µM biotin labeled universal primer, and 0.75 U Qiagen's Hotstar Taq DNA polymerase (Qiagen Inc.). PCR cycling conditions were 95°C for 15 min, followed by 50 cycles of 94°C for 30 sec, 60°C for 45 sec, and 72°C for 45 sec, and a final incubation at 72°C for 10 min. PCR product quality verification was carried out on 1.5% agarose gels with ethidium bromide.
Pyrosequencing methylation assays
Based on the concentration of the hot start PCR product, 10∼25 µl PCR product was used for each pyrosequencing reaction. Pyrosequencing methylation analysis was carried out using the Pyro Q-CpG system (PyroMark ID, Biotage, Sweden) according to manufacture's protocol. In brief, the biotin labeled PCR products were bound to Streptavidin coated Sepharose beads (GE Healthcare Bio-sciences AB, Sweden). The Sepharose beads containing the immobilized PCR product were purified in 70% ethanol for 5 sec, denatured in Denature buffer (Biotage) for 5 sec, and washed with washing buffer (Biotage) for 10 sec using the Pyrosequencing Vacuum Prep Tool (Biotage). Then, 0.5 µM sequence primer was annealed to the purified single-stranded PCR product in annealing buffer (Biotage) and pyrosequencing was carried out using the Pyro Q-CpG system. The level of methylation was expressed for each cytosine locus on CpG sites as the percentage of mC/(mC+C). Non-CpG cytosine residues were used as internal controls to verify bisulfite conversion.
PCR and DNA sequencing
The methylation assayed region of DNMT3b was amplified by PCR from the whole genome for each sample. The forward and reverse PCR primers are 5′-GGCAGCCATGAAAAAGGAGA-3′ and 5′-GGCAGCAGTGTCCTTAGTGG-3′, respectively. PCR cycling conditions were 95°C for 15 min, followed by 30 cycles of 94°C for 30 sec, 62°C for 45 sec, and 72°C for 20 sec, and a final incubation at 72°C for 10 min. The amplified region was purified from 1.5% UltraPura Agarose (Invitrogen, Inc.) gel through QIAquick Gel Extraction Kit (Qiagen, Inc.), and the purified fragments were sequenced using ABI 3730.
Real-time quantitative RT-PCR
Total RNA of 5 individuals from line 72 and line 63 was extracted from spleen, liver and hypothalamus using RNeasy Midi kit (Qiagen, Inc.). The first strand cDNA was synthesized from total RNA using SuperScript™ III Reverse Transcriptase (Invitrogen). Samples were then analyzed by real time RT-PCR using an iCycler iQ PCR system (Bio-Rad). The real time RT-PCR reactions were performed in a final volume of 20 µl with a QuantiTect SYBR Green PCR Kit (Qiagen) according to the manufacture's instructions. Each reaction has two replicates. The mRNA expression of DNMT3b was normalized against the housekeeping gene GAPDH (glyceraldehyde 3-phosphate dehydrogenase) cDNA in the corresponding samples.
Statistical analysis
In this research, point-wise comparison was carried out to analyze the difference of DNA methylation levels at each CpG site between two parental lines and six RCSs. Student's t test was used to analyze the difference of RNA expression levels of DNMTs between two lines.
In addition, we developed a new method called principal component test to evaluate the significant difference of methylation patterns consisting of continued CpG sites, which was done through the transformation of q-fold principle components (PC) [52]. In brief, the significance test of DNA methylation patterns of the eight populations (lines, tissues and ages of chickens) is conducted on the exact F statistic for high-dimension data. The objective is to assess if the two groups to which the n individuals belong are statistically distinguishable.
Let n(1) and n(2), n(1)+n(2) = n, represent the numbers of individuals in two populations, respectively, to be compared. Assume each individual has a measure of several continued CpG sites. Denote X = (x1,x2…xn), a p×n matrix representing methylation percentages on each CpG site.
Assume xi∼N(μi, Σ), the null hypothesis to be tested is
| (1) |
Let us denote  , and let D be a p×q matrix consisting of the first q (1<q<min(n, p)) eigenvectors of the solution of the following general eigenvalue problem
| (2) |
where Λ is the q×q diagonal matrix of q largest eigenvalues.
If H0 holds, the statistic
| (3) |
exactly follows F distribution with q and n-q-1 as the degrees of freedom, where Z = D′X,  . k is a vector calculated according to following equation
 |
(4) |
For a given n and p, the power of this statistic is dependent on the choice of q, the number of principals to be considered. We determined this parameter based on a cumulative energy content (CEC) criterion. That is, the q principals can capture at least 85% variance in the data.
Supporting Information
mRNA expression levels of DNMT3a and DNMT1 using quantitative RT-PCR. A. The level of DNMT3a in spleen and liver from line 63 at 15 months-old. B. The level of DNMT1 in liver between line 63 and line 72 at 15 months-old. Two replicates for each reaction. n = 5 for each line and tissue.
(0.80 MB DOC)
Predicted transcriptional binding sites at the studied CpG sites region of DNMT3b in the line 63 (A) and line 72 (B). Open boxes show the two CpG (A) to TpG (B) transitions. Underlined sequences are the predicted core regions of transcriptional binding sites using Matinspector software available on website www.genomatix.de. Transcription factors: DMP1, also named DMTF1 (Cyclin D binding myb-like transcription factor 1). In vivo, DMP1 is a physiological regulator of the Arf-p53 pathway, an oncogene-suppressor pathway; PLAG1 (Pleomorphic adenoma gene) encodes a developmentally regulated, SUMOylated and phosphorylated zinc finger transcription factor, recognizes a specific bipartite DNA consensus sequence regulating expression of a spectrum of target genes. PLAG1 is defined by various studies as a tumor-suppressor gene; NUDR, Nuclear DEAF-1-related protein, is a transcriptional regulatory factor with sequence similarity to developmental and oncogenic proteins. NUDR produced a 65–70% repression of the nuclear ribonucleoprotein A2/B1 promoter activity; PAX5, B-cell-specific activator protein. PAX5 is essential for the transcriptional control of B cell commitment, development and function as well as in B cell tumorigenesis.
(1.19 MB TIF)
Exact F test for DNA methylation patterns of DNMT3b. A. P values matrix among two parental lines 63 and 72, as well as six RCSs, C, F, J, L, M and T. n = 5 for each. B. P values matrix among lines and tissues. 63: line 63; 72: line 72; S: spleen; Li: liver. Color bar shows the extent of significance level (P values with −log10(P). e.g., −log10(0.05) = 1.3; −log10(0.01) = 2). Black arrows show P = 0.05.
(1.47 MB TIF)
P values matrix with exact F test for DNA methylation patterns of DNMT3a among lines, tissues and ages. 63: line 63; 72: line 72; S: spleen; Li: liver; Hy: hypothalamus; B: blood cell. 15: 15 months old; 8: 8 weeks old. n = 5 for each. Color bar shows the extent of significance level (P values with −log10(P). e.g., −log10(0.05) = 1.3; −log10(0.01) = 2). Black arrows show P = 0.05.
(1.01 MB TIF)
P values matrix with exact F test for DNA methylation patterns of DNMT1 among lines and tissues. 63: line 63; 72: line 72; S: spleen; Li: liver; Hy: hypothalamus; B: blood cell. n = 5 for each. Color bar shows the extent of significance level (P values with −log10(P). e.g., −log10(0.05) = 1.3; −log10(0.01) = 2). Black arrows show P = 0.05.
(0.95 MB TIF)
BLAT results of chicken DNMT3B (S6A), DNMT3A (S6B) and DNMT1 (S6C) using UCSC Genome Browser. Brown boxes show the first exon that including the analyzed CpG sites in each gene.
(5.39 MB TIF)
Acknowledgments
We would like to thank Naili Liu for DNA sequencing technical support, Mardi Byerly for sampling help, and Apratim Mitra, Mary Rogier for some grammar modification.
Footnotes
Competing Interests: The authors have declared that no competing interests exist.
Funding: Maryland State Funds
References
- 1.Ogino S, Hazra A, Tranah GJ, Kirkner GJ, Kawasaki T, et al. MGMT germline polymorphism is associated with somatic MGMT promoter methylation and gene silencing in colorectal cancer. Carcinogenesis. 2007;28:1985–1990. doi: 10.1093/carcin/bgm160. [DOI] [PubMed] [Google Scholar]
- 2.Murrell A, Heeson S, Cooper WN, Douglas E, Apostolidou S, et al. An association between variants in the IGF2 gene and Beckwith-Wiedemann syndrome: interaction between genotype and epigenotype. Hum Mol Genet. 2004;13:247–255. doi: 10.1093/hmg/ddh013. [DOI] [PubMed] [Google Scholar]
- 3.Tost J. Epigenetics Caister Academic Press. 2008 [Google Scholar]
- 4.McGarvey KM, Greene E, Fahrner JA, Jenuwein T, Baylin SB. DNA methylation and complete transcriptional silencing of cancer genes persist after depletion of EZH2. Cancer Res. 2007;67:5097–5102. doi: 10.1158/0008-5472.CAN-06-2029. [DOI] [PubMed] [Google Scholar]
- 5.Szyf M. Targeting DNA methylation in cancer. Bull Cancer. 2006;93:961–972. [PubMed] [Google Scholar]
- 6.Yu L, Liu C, Vandeusen J, Becknell B, Dai Z, et al. Global assessment of promoter methylation in a mouse model of cancer identifies ID4 as a putative tumor-suppressor gene in human leukemia. Nat Genet. 2005;37:265–274. doi: 10.1038/ng1521. [DOI] [PubMed] [Google Scholar]
- 7.Tebbutt SJ, James A, Pare PD. Single-nucleotide polymorphisms and lung disease: clinical implications. Chest. 2007;131:1216–1223. doi: 10.1378/chest.06-2252. [DOI] [PubMed] [Google Scholar]
- 8.Seligman SJ. Single nucleotide polymorphisms in human genes and increased susceptibility to West Nile Virus disease. J Infect Dis. 2006;193:1187–1188. doi: 10.1086/501504. author reply 1188. [DOI] [PubMed] [Google Scholar]
- 9.Schroder NW, Schumann RR. Single nucleotide polymorphisms of Toll-like receptors and susceptibility to infectious disease. Lancet Infect Dis. 2005;5:156–164. doi: 10.1016/S1473-3099(05)01308-3. [DOI] [PubMed] [Google Scholar]
- 10.Bao L, Zhou M, Cui Y. nsSNPAnalyzer: identifying disease-associated nonsynonymous single nucleotide polymorphisms. Nucleic Acids Res. 2005;33:W480–482. doi: 10.1093/nar/gki372. [DOI] [PMC free article] [PubMed] [Google Scholar]
- 11.Wang Y, Armstrong SA. Genome-wide SNP analysis in cancer: leukemia shows the way. Cancer Cell. 2007;11:308–309. doi: 10.1016/j.ccr.2007.03.017. [DOI] [PubMed] [Google Scholar]
- 12.LaFramboise T, Weir BA, Zhao X, Beroukhim R, Li C, et al. Allele-specific amplification in cancer revealed by SNP array analysis. PLoS Comput Biol. 2005;1:e65. doi: 10.1371/journal.pcbi.0010065. [DOI] [PMC free article] [PubMed] [Google Scholar]
- 13.Waddington C. The epigenotype. Endeavous. 1942;1:18–20. [Google Scholar]
- 14.Piyathilake CJ, Frost AR, Bell WC, Oelschlager D, Weiss H, et al. Altered global methylation of DNA: an epigenetic difference in susceptibility for lung cancer is associated with its progression. Hum Pathol. 2001;32:856–862. doi: 10.1053/hupa.2001.26471. [DOI] [PubMed] [Google Scholar]
- 15.Peng DF, Kanai Y, Sawada M, Ushijima S, Hiraoka N, et al. Increased DNA methyltransferase 1 (DNMT1) protein expression in precancerous conditions and ductal carcinomas of the pancreas. Cancer Sci. 2005;96:403–408. doi: 10.1111/j.1349-7006.2005.00071.x. [DOI] [PMC free article] [PubMed] [Google Scholar]
- 16.Okano M, Xie S, Li E. Dnmt2 is not required for de novo and maintenance methylation of viral DNA in embryonic stem cells. Nucleic Acids Res. 1998;26:2536–2540. doi: 10.1093/nar/26.11.2536. [DOI] [PMC free article] [PubMed] [Google Scholar]
- 17.Okano M, Bell DW, Haber DA, Li E. DNA methyltransferases Dnmt3a and Dnmt3b are essential for de novo methylation and mammalian development. Cell. 1999;99:247–257. doi: 10.1016/s0092-8674(00)81656-6. [DOI] [PubMed] [Google Scholar]
- 18.Yokomine T, Hata K, Tsudzuki M, Sasaki H. Evolution of the vertebrate DNMT3 gene family: a possible link between existence of DNMT3L and genomic imprinting. Cytogenet Genome Res. 2006;113:75–80. doi: 10.1159/000090817. [DOI] [PubMed] [Google Scholar]
- 19.Eggert A, Grotzer MA, Ikegaki N, Zhao H, Cnaan A, et al. Expression of the neurotrophin receptor TrkB is associated with unfavorable outcome in Wilms' tumor. J Clin Oncol. 2001;19:689–696. doi: 10.1200/JCO.2001.19.3.689. [DOI] [PubMed] [Google Scholar]
- 20.Bonsch D, Lenz B, Fiszer R, Frieling H, Kornhuber J, et al. Lowered DNA methyltransferase (DNMT-3b) mRNA expression is associated with genomic DNA hypermethylation in patients with chronic alcoholism. J Neural Transm. 2006;113:1299–1304. doi: 10.1007/s00702-005-0413-2. [DOI] [PubMed] [Google Scholar]
- 21.Cheng X. Structure and function of DNA methyltransferases. Annu Rev Biophys Biomol Struct. 1995;24:293–318. doi: 10.1146/annurev.bb.24.060195.001453. [DOI] [PubMed] [Google Scholar]
- 22.Bestor TH, Verdine GL. DNA methyltransferases. Curr Opin Cell Biol. 1994;6:380–389. doi: 10.1016/0955-0674(94)90030-2. [DOI] [PubMed] [Google Scholar]
- 23.Lyko F, Ramsahoye BH, Kashevsky H, Tudor M, Mastrangelo MA, et al. Mammalian (cytosine-5) methyltransferases cause genomic DNA methylation and lethality in Drosophila. Nat Genet. 1999;23:363–366. doi: 10.1038/15551. [DOI] [PubMed] [Google Scholar]
- 24.Turek-Plewa J, Jagodzinski PP. The role of mammalian DNA methyltransferases in the regulation of gene expression. Cell Mol Biol Lett. 2005;10:631–647. [PubMed] [Google Scholar]
- 25.Gokul G, Gautami B, Malathi S, Sowjanya AP, Poli UR, et al. DNA methylation profile at the DNMT3L promoter: a potential biomarker for cervical cancer. Epigenetics. 2007;2:80–85. doi: 10.4161/epi.2.2.3692. [DOI] [PMC free article] [PubMed] [Google Scholar]
- 26.Jones JS, Amos CI, Pande M, Gu X, Chen J, et al. DNMT3b polymorphism and hereditary nonpolyposis colorectal cancer age of onset. Cancer Epidemiol Biomarkers Prev. 2006;15:886–891. doi: 10.1158/1055-9965.EPI-05-0644. [DOI] [PubMed] [Google Scholar]
- 27.Oda M, Yamagiwa A, Yamamoto S, Nakayama T, Tsumura A, et al. DNA methylation regulates long-range gene silencing of an X-linked homeobox gene cluster in a lineage-specific manner. Genes Dev. 2006;20:3382–3394. doi: 10.1101/gad.1470906. [DOI] [PMC free article] [PubMed] [Google Scholar]
- 28.Xu GL, Bestor TH, Bourc'his D, Hsieh CL, Tommerup N, et al. Chromosome instability and immunodeficiency syndrome caused by mutations in a DNA methyltransferase gene. Nature. 1999;402:187–191. doi: 10.1038/46052. [DOI] [PubMed] [Google Scholar]
- 29.Bacon LD, Hunt HD, Cheng HH. Genetic resistance to Marek's disease. Curr Top Microbiol Immunol. 2001;255:121–141. doi: 10.1007/978-3-642-56863-3_5. [DOI] [PubMed] [Google Scholar]
- 30.Burgess SC, Young JR, Baaten BJG, Hunt L, Ross LNJ, et al. Marek's disease is a natural model for lymphomas overexpressing Hodgkin's disease antigen (CD30). PNAS. 2004;101:13879–13884. doi: 10.1073/pnas.0305789101. [DOI] [PMC free article] [PubMed] [Google Scholar]
- 31.Yu Y, Zhang H, Tian F, Bacon L, Zhang Y, et al. Quantitative Evaluation of DNA Methylation Patterns for ALVE and TVB Genes in a Neoplastic Disease Susceptible and Resistant Chicken Model. PLoS ONE. 2008;3:e1731. doi: 10.1371/journal.pone.0001731. [DOI] [PMC free article] [PubMed] [Google Scholar]
- 32.Burgess SC, Young JR, Baaten BJ, Hunt L, Ross LN, et al. Marek's disease is a natural model for lymphomas overexpressing Hodgkin's disease antigen (CD30). Proc Natl Acad Sci U S A. 2004;101:13879–13884. doi: 10.1073/pnas.0305789101. [DOI] [PMC free article] [PubMed] [Google Scholar]
- 33.Nair V. Evolution of Marek's disease–a paradigm for incessant race between the pathogen and the host. Vet J. 2005;170:175–183. doi: 10.1016/j.tvjl.2004.05.009. [DOI] [PubMed] [Google Scholar]
- 34.Fadly AM, Payne LN. Leukosis/sarcoma group. In: Saif YM, Barnes HJHJ, Glisson JR, Fadly AM, Mcdougald LR, editors. Disease of Poultry 11th end: 465–516. Ames, Iowa, USA: Iowa State Press, Blackwell Publishing Company; 2003. [Google Scholar]
- 35.Bacon LD, Hunt HD, Cheng HH. A review of the development of chicken lines to resolve genes determining resistance to diseases. Poult Sci. 2000;79:1082–1093. doi: 10.1093/ps/79.8.1082. [DOI] [PubMed] [Google Scholar]
- 36.Bacon LD, Hunt HD, Cheng HH. A review of the development of chicken lines to resolve genes determining resistance to diseases. Poult Sci. 2000;79:1082–1093. doi: 10.1093/ps/79.8.1082. [DOI] [PubMed] [Google Scholar]
- 37.Tost J, Gut IG. Analysis of gene-specific DNA methylation patterns by pyrosequencing(r) technology. Methods Mol Biol. 2006;373:89–102. doi: 10.1385/1-59745-377-3:89. [DOI] [PubMed] [Google Scholar]
- 38.Zhang HM, Bacon LD, Heidari M, Muir WM, Groenen MA, et al. Genetic variation at the tumour virus B locus in commercial and laboratory chicken populations assessed by a medium-throughput or a high-throughput assay. Avian Pathol. 2007;36:283–291. doi: 10.1080/03079450701449248. [DOI] [PubMed] [Google Scholar]
- 39.Zhang HM, Hunt HD, Kulkarni GB, Palmquist DE, Bacon LD. Lymphoid organ size varies among inbred lines 6(3) and 7(2) and their thirteen recombinant congenic strains of chickens with the same major histocompatibility complex. Poult Sci. 2006;85:844–853. doi: 10.1093/ps/85.5.844. [DOI] [PubMed] [Google Scholar]
- 40.Bacon LD, Fulton JE, Kulkarni GB. Methods for evaluating and developing commercial chicken strains free of endogenous subgroup E avian leukosis virus. Avian Pathol. 2004;33:233–243. doi: 10.1080/0307943042000195731. [DOI] [PubMed] [Google Scholar]
- 41.Santos-Reboucas CB, Pimentel MM. Implication of abnormal epigenetic patterns for human diseases. Eur J Hum Genet. 2007;15:10–17. doi: 10.1038/sj.ejhg.5201727. [DOI] [PubMed] [Google Scholar]
- 42.Ray D, Wu A, Wilkinson JE, Murphy HS, Lu Q, et al. Aging in heterozygous Dnmt1-deficient mice: effects on survival, the DNA methylation genes, and the development of amyloidosis. J Gerontol A Biol Sci Med Sci. 2006;61:115–124. doi: 10.1093/gerona/61.2.115. [DOI] [PubMed] [Google Scholar]
- 43.Zhang X, Yazaki J, Sundaresan A, Cokus S, Chan SW, et al. Genome-wide high-resolution mapping and functional analysis of DNA methylation in arabidopsis. Cell. 2006;126:1189–1201. doi: 10.1016/j.cell.2006.08.003. [DOI] [PubMed] [Google Scholar]
- 44.Rakyan VK, Hildmann T, Novik KL, Lewin J, Tost J, et al. DNA methylation profiling of the human major histocompatibility complex: a pilot study for the human epigenome project. PLoS Biol. 2004;2:e405. doi: 10.1371/journal.pbio.0020405. [DOI] [PMC free article] [PubMed] [Google Scholar]
- 45.Kanai Y, Hirohashi S. Alterations of DNA methylation associated with abnormalities of DNA methyltransferases in human cancers during transition from a precancerous to a malignant state. Carcinogenesis. 2007;28:2434–2442. doi: 10.1093/carcin/bgm206. [DOI] [PubMed] [Google Scholar]
- 46.Weisenberger DJ, Velicescu M, Preciado-Lopez MA, Gonzales FA, Tsai YC, et al. Identification and characterization of alternatively spliced variants of DNA methyltransferase 3a in mammalian cells. Gene. 2002;298:91–99. doi: 10.1016/s0378-1119(02)00976-9. [DOI] [PubMed] [Google Scholar]
- 47.Rakyan V, Whitelaw E. Transgenerational epigenetic inheritance. Curr Biol. 2003;13:R6. doi: 10.1016/s0960-9822(02)01377-5. [DOI] [PubMed] [Google Scholar]
- 48.Waterland RA, Jirtle RL. Transposable elements: targets for early nutritional effects on epigenetic gene regulation. Mol Cell Biol. 2003;23:5293–5300. doi: 10.1128/MCB.23.15.5293-5300.2003. [DOI] [PMC free article] [PubMed] [Google Scholar]
- 49.Chong S, Whitelaw E. Epigenetic germline inheritance. Curr Opin Genet Dev. 2004;14:692–696. doi: 10.1016/j.gde.2004.09.001. [DOI] [PubMed] [Google Scholar]
- 50.Whitelaw NC, Whitelaw E. How lifetimes shape epigenotype within and across generations. Hum Mol Genet. 2006;15 Spec No 2:R131–137. doi: 10.1093/hmg/ddl200. [DOI] [PubMed] [Google Scholar]
- 51.Colella S, Shen L, Baggerly KA, Issa JP, Krahe R. Sensitive and quantitative universal Pyrosequencing methylation analysis of CpG sites. Biotechniques. 2003;35:146–150. doi: 10.2144/03351md01. [DOI] [PubMed] [Google Scholar]
- 52.Laüter J. Exact t and F tests for analyzing studies with multiple endpoints. Biometrics. 1995:964–970. [Google Scholar]
Associated Data
This section collects any data citations, data availability statements, or supplementary materials included in this article.
Supplementary Materials
mRNA expression levels of DNMT3a and DNMT1 using quantitative RT-PCR. A. The level of DNMT3a in spleen and liver from line 63 at 15 months-old. B. The level of DNMT1 in liver between line 63 and line 72 at 15 months-old. Two replicates for each reaction. n = 5 for each line and tissue.
(0.80 MB DOC)
Predicted transcriptional binding sites at the studied CpG sites region of DNMT3b in the line 63 (A) and line 72 (B). Open boxes show the two CpG (A) to TpG (B) transitions. Underlined sequences are the predicted core regions of transcriptional binding sites using Matinspector software available on website www.genomatix.de. Transcription factors: DMP1, also named DMTF1 (Cyclin D binding myb-like transcription factor 1). In vivo, DMP1 is a physiological regulator of the Arf-p53 pathway, an oncogene-suppressor pathway; PLAG1 (Pleomorphic adenoma gene) encodes a developmentally regulated, SUMOylated and phosphorylated zinc finger transcription factor, recognizes a specific bipartite DNA consensus sequence regulating expression of a spectrum of target genes. PLAG1 is defined by various studies as a tumor-suppressor gene; NUDR, Nuclear DEAF-1-related protein, is a transcriptional regulatory factor with sequence similarity to developmental and oncogenic proteins. NUDR produced a 65–70% repression of the nuclear ribonucleoprotein A2/B1 promoter activity; PAX5, B-cell-specific activator protein. PAX5 is essential for the transcriptional control of B cell commitment, development and function as well as in B cell tumorigenesis.
(1.19 MB TIF)
Exact F test for DNA methylation patterns of DNMT3b. A. P values matrix among two parental lines 63 and 72, as well as six RCSs, C, F, J, L, M and T. n = 5 for each. B. P values matrix among lines and tissues. 63: line 63; 72: line 72; S: spleen; Li: liver. Color bar shows the extent of significance level (P values with −log10(P). e.g., −log10(0.05) = 1.3; −log10(0.01) = 2). Black arrows show P = 0.05.
(1.47 MB TIF)
P values matrix with exact F test for DNA methylation patterns of DNMT3a among lines, tissues and ages. 63: line 63; 72: line 72; S: spleen; Li: liver; Hy: hypothalamus; B: blood cell. 15: 15 months old; 8: 8 weeks old. n = 5 for each. Color bar shows the extent of significance level (P values with −log10(P). e.g., −log10(0.05) = 1.3; −log10(0.01) = 2). Black arrows show P = 0.05.
(1.01 MB TIF)
P values matrix with exact F test for DNA methylation patterns of DNMT1 among lines and tissues. 63: line 63; 72: line 72; S: spleen; Li: liver; Hy: hypothalamus; B: blood cell. n = 5 for each. Color bar shows the extent of significance level (P values with −log10(P). e.g., −log10(0.05) = 1.3; −log10(0.01) = 2). Black arrows show P = 0.05.
(0.95 MB TIF)
BLAT results of chicken DNMT3B (S6A), DNMT3A (S6B) and DNMT1 (S6C) using UCSC Genome Browser. Brown boxes show the first exon that including the analyzed CpG sites in each gene.
(5.39 MB TIF)


