

Abstract
Objectives
Concern for driving safety has prompted research into understanding factors related to performance. Brake reaction speed (BRS), the speed with which persons react to a sudden change in driving conditions, is a measure of performance. Our aim is to determine the visual, cognitive, and physical factors predicting BRS in a population sample of 1425 older drivers.
Methods
The Maryland Department of Motor Vehicles roster of persons aged 67–87 and residing in Salisbury, MD, was used for recruitment of the study population. Procedures included the following: habitual, binocular visual acuity using ETDRS charts, contrast sensitivity using a Pelli-Robson chart, visual fields assessed with a 81-point screening Humphrey field at a single intensity threshold, and a questionnaire to ascertain medical conditions. Cognitive status was assessed using a standard battery of tests for attention, memory, visuo-spatial, and scanning. BRS was assessed using a computer-driven device that measured separately the initial reaction speed (IRS) (from light change to red until removing foot from accelerator) and physical response speed (PRS) (removing foot from accelerator to full brake depression). Five trial times were averaged, and time was converted to speed.
Results
The median brake reaction time varied from 384 to 5688 milliseconds. Age, gender, and cognition predicted total BRS, a non-informative result as there are two distinct parts to the task. Once separated, decrease in IRS was associated with low scores on cognitive factors and missing points on the visual field. A decrease in PRS was associated with having three or more physical complaints related to legs and feet, and poorer vision search. Vision was not related to PRS.
Conclusion
We have demonstrated the importance of segregating the speeds for the two tasks involved in brake reaction. Only the IRS depends on vision. Persons in good physical condition may perform poorly on brake reaction tests if their vision or cognition is compromised.
Keywords: Vision, Cognition, Driving, Population study
INTRODUCTION
The graying of America is a well described phenomenon, with those over age 65 constituting the fastest growing segment of the United States population.1 This aging trend has generated considerable concern about the safety of public highways. In general, crashes are more frequent among older drivers, per mile driven, compared to most other age groups.2 Moreover, crashes more often lead to disability or death among older drivers.3
Driving safety becomes of paramount concern because of the 170% increase in number of older drivers over the last 20 years, the highest among all age groups, and three times greater than the growth of the total driving population. Much of this increase is due to the tremendous growth in older female drivers.4 However, determining the potentially adverse effect on highway safety of these older drivers is not straightforward, as driving an automobile is a major component of independence and mobility among older persons. Loss of driving privileges and resultant dependencies are greatly feared and can lead to continued driving even among those at high risk of crashes.
Thus, research into the age-related changes that may predict deficits in measures of driving performance is critical to understanding who is at risk. Brake reaction time, the time to respond to sudden changes in the driving environment by fully depressing a brake pedal, is one measure of driving performance. Past studies have identified personal risk factors for poorer brake reaction time, such as alcohol use,5 distractors such as cell phone use,6-7 and medications causing sedation such as antihistamines or psychotropic agents.8-10 One small study of ten drivers, five with visual impairment (VA = 20/100) and five controls with normal vision matched by age, gender and driving experience, found that poor visual acuity is associated with slower brake reaction time.11
Previous research has identified two primary components of Brake Reaction Time (BRT): Initial Reaction Time (IRT, sometimes referred to as perception-reaction time), and Physical Reaction Time (PRT, also called brake-movement time). IRT is the time from when the stimulus first appears to the start of foot movement off the accelerator; the PRT is the time from the first physical movement off the accelerator to the depression of the brake pedal. Research suggests these components may be influenced by different factors, but they may not be entirely independent.12 In one study of these two components, increasing age was associated with slower IRT, but not PRT, and male gender was associated with faster PRT.12
We could find no other studies that evaluated personal factors associated with these two components simultaneously in the same population of drivers. We postulated that cognition, primarily the domains of attention and visual search, and vision would be related to IRT, while physical problems would be related to PRT. We evaluated these factors in a population of 1425 older drivers enrolled in the Salisbury Eye Evaluation Driving Study (SEEDS) who performed on a brake reaction test simulator.
METHODS
Sample
The SEEDS participants were recruited from a complete listing of all Maryland Department of Motor Vehicle Administration (DMVA), licensees age 67 to 87 years as of May 1, 2005, and those newly age 67 as of March 1,2006. The licensees had to be resident in zip codes which encompass the greater Salisbury, MD metropolitan area. According to legal privacy regulations, strict recruitment procedures that did not allow us access to the population for recruitment had to be followed. A letter went out from the Maryland DMVA Department of Research, explaining the study and asking the licensee to participate, with willingness indicated by mailing to the SEEDS clinic an enclosed, stamped, addressed postcard.
We were allowed to contact only those who returned a “yes” postcard, and were not allowed further contact with those who responded “no” or with any non-responder. Second and third mailings from the DMVA were sent to non-responders; in addition, we were permitted to recruit at presentations, church meetings, and other gatherings. Of 8380 registered licensees, 4503 (54%) returned postcards. Of that group, 6.0% were no longer driving, 1.6% were deceased, and 2.3% no longer were living in the eligible area. Of the remainder, 42% agreed to participate and 83% of them completed a clinic exam.
Home interview
At the home interview, a questionnaire was administered by a trained interviewer who collected data on medical conditions likely to affect driving, such as arthritis, diabetes, Parkinson’s disease, and stroke. Symptoms such as pain in the feet and legs and hips also were queried.
Clinic examination
Each participant underwent a series of vision tests that included visual acuity, contrast sensitivity, and visual field. Presenting binocular visual acuity was tested, with the participant’s usual distance vision spectacles, using ETDRS charts and forced choice protocols. Results were coded as LogMAR acuity. Contrast sensitivity was tested for each eye separately using the Pelli-Robson contrast sensitivity chart. Results were coded as number of letters seen. The visual field was tested using the Humphrey Field Analyzer II, Full Field 81 Point test, with a Quantify-defects test strategy.
Each participant also underwent a series of tests that measure certain aspects of cognition. We specifically hypothesized a relationship with the cognitive domains of attention, and psychomotor speed and visual search. The specific tests used were Brief Test of Attention (BTA), and Trails A, respectively. In addition, a general test of cognition, the Mini-Mental State Examination (MMSE), also was used. These tests are part of a standard battery of tests used by neuropsychologists to elicit deficits in the domains of interest.
Reaction speed measurements
The Brake Reaction test apparatus was composed of a Pentium 4 computer (Shuttle XPCSB75G2), two flat panel monitors, a USB Steering Wheel with both brake and gas pedals at equal heights from the floor, and a custom software application developed using Labview. A high performance graphics card was installed into the computer to support two separate monitors simultaneously. Thus, the technician could conduct the test and monitor the data quality on one monitor, while the participant saw only visual test cues on the second monitor.
The software controlling the test displayed the current status of the test to the technician as well as a strip chart of the measured responses from the foot pedals as a function of time. Displaying the position of the pedals for each of the test sequences allowed the technician to observe the data quality and to take any corrective actions, such as calibration of the foot pedals or instructing the participant to use only a single foot for the test.
The participant sat before the second monitor and the steering wheel control and saw only the image of a traffic light. The test began with the participant fully depressing the gas pedal. At this point, the traffic light was green and a software countdown timer began. The duration of the timer was a fixed value (30 seconds) with an additional random variation added (±10 seconds). The random element had been added to prevent the participant from anticipating when the traffic light would change. When the countdown timer finished, the traffic light switched from green to red, at which point the participant reacted by releasing the gas pedal and depressing the brake. The test sequence was completed when the participant had fully depressed the brake pedal. Five of these sequences were used for the test; for each person a mean time was taken as the measure. These sequences typically followed two practice sequences, which served to familiarize the participant with the test.
The software recorded the time at which the participant began to release the gas pedal, when the gas pedal was fully released, when the brake pedal began to be depressed, and when the brake pedal was fully depressed for each of the sequences. All times were relative to the traffic light changing from green to red. The foot pedal positions were sampled at a rate of 125 Hz (8 ms sample spacing). We used three measures for analyses: Initial Reaction Time (IRT) or the time from when the signal turned red until there were a motor response, Physical Reaction Time (PRT) or the time from when the foot first started to move from the accelerator pedal until the brake pedal was depressed fully, and Brake Reaction Time (BRT), or the total time for the task. Because the distributions of all the time components in brake reaction test were skewed, we transformed the time to rate (1/time).
Data analysis
The means of Break Reaction Rate (BRR), Initial Reaction Rate (IRR), and Physical Reaction Rate (PRR) were calculated for the population according to age, gender, race, vision, cognition, and medical conditions. Analysis of variance (ANOVA) was used to determine differences by characteristic. The correlation between IRR and PRR was calculated by the Pearson method.13 Multiple linear regression models were used to evaluate the association of demographic, visual, cognitive, and physical factors with BRR, IRR, and PRR. Age at the time of the clinical examination was centered at the mean age, 76 years. We transformed the time taken to perform Trails A to a log scale. Final models were selected based on the F-test. All the analyses were performed using SAS software, version 9 (SAS Institute Inc, Cary, NC). Graphs were plotted in R (http://www.r-project.org).
RESULTS
For the period from July 13 to October 25, 2005, the data on the individual segments of the brake reaction test were not stored properly. The problem was repaired, but data were lost for 385 of our 1425 participants. One person was excluded because of missing brake reaction test results. The characteristics of the SEEDS participants who have and do not have BRT data, are shown in Table 1. The group without BRT data tended to be white and older, but visual, cognitive, and physical factors do not differ from the group with BRT data.
Table 1.
Characteristics of Salisbury Eye Evaluation Driving Study participants
| With BRT data | Without BRT data | |||
|---|---|---|---|---|
| Characteristic Demographic | N | % | N | % |
| Age*: 67–74 | 458 | 44.08 | 107 | 27.79 |
| 75–79 | 263 | 25.31 | 150 | 38.96 |
| 80+ | 318 | 30.61 | 128 | 33.25 |
| Female | 508 | 48.89 | 204 | 52.99 |
| White* | 881 | 84.79 | 352 | 91.43 |
| Vision Acuity: | ||||
| 20/20 or better | 638 | 61.41 | 233 | 60.52 |
| 20/20–20/40 | 389 | 37.44 | 151 | 39.22 |
| Worse than 20/40 | 12 | 1.15 | 1 | 0.26 |
| Contrast Sensitivity: | ||||
| 33 letters or better | 945 | 91.04 | 357 | 92.73 |
| 30–32 letters | 69 | 6.65 | 22 | 5.71 |
| 29 or fewer letters | 24 | 2.31 | 6 | 1.56 |
| Binocular Visual Fields: | ||||
| no points missed | 574 | 55.51 | 223 | 58.84 |
| 1–10 missed | 404 | 39.07 | 139 | 36.68 |
| 11+ missed | 56 | 5.42 | 17 | 4.49 |
| Cognition | ||||
| MMSE <= 24 | 52 | 5.01 | 14 | 3.64 |
| Trails A: 85 seconds or more | 73 | 7.07 | 21 | 5.59 |
| Brief Test of Attention: 3 or less | 139 | 13.43 | 46 | 12.01 |
| Physical Factors | ||||
| 1–2 medical conditions | 438 | 42.20 | 160 | 41.56 |
| 3+ medical conditions | 99 | 9.54 | 41 | 10.65 |
comparing people with BRT to those without BRT, the race and age are statistically and significantly different, p-value <0.05.
Overall, these older drivers tended to have good acuity, contrast sensitivity, and visual fields, and good overall cognitive scores on MMSE. However, there were significant numbers who showed evidence of cognitive impairment in the domains we targeted. Overall, the median of each person’s BRT varied from 384–5688 milliseconds. The distribution of times for each of the brake reaction components, IRT and PRT, and BRT, in this cohort were shown in Figure 1. For 84% of the participants in this cohort, the total brake reaction time was less than one second, where one second or greater is considered quite slow. Figure 2 shows the relationship between IRR and PRR. The correlation between the two is 0.28. Although the relationship is somewhat linear, some people with high rates of initial reaction have low rate in physical reaction, and vice versa.
Figure 1.
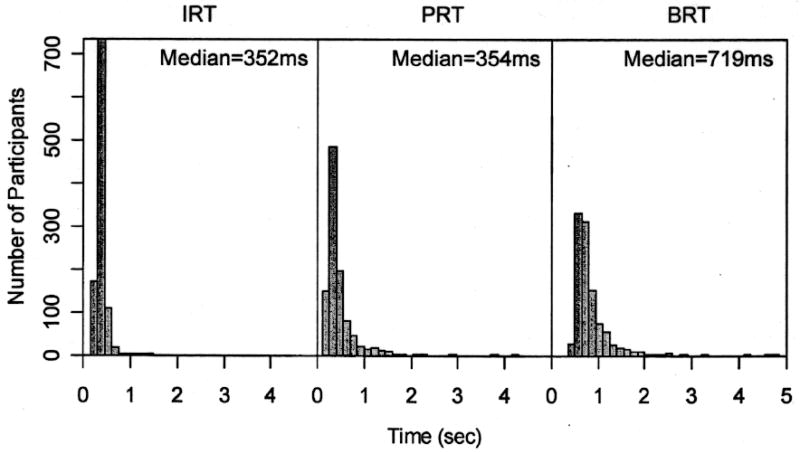
Distribution of reaction times.
Figure 2.
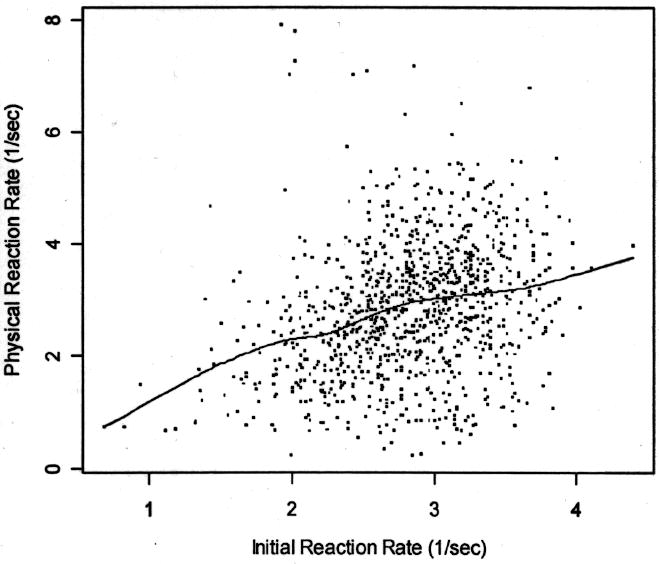
Relationship between initial reaction rate and physical reaction rate. The dots represent data points, and the line is a smooth spline.
The factors associated with overall BRR and IRR and PRR consisted of demographic, vision, cognition, and physical variables (Table 2). As hypothesized, IRR was more closely associated with vision and cognition, and PRR was more closely associated with physical factors. Table 3 shows the linear regression models of factors related to IRR and PRR. Increasing age and being female were associated with slower IRR. Missing more points in the visual field, and worse contrast sensitivity scores also were associated with slower IRR.
Table 2.
Characteristics associated with initial reaction rate (IRR), physical reaction rate (PRR) and brake reaction rate (BRR).
| IRR | PRR | BRR | |||||
|---|---|---|---|---|---|---|---|
| Characteristic Demographic | N | < Mean | * P-value | Mean | P-value | Mean | P-value |
| Age: 67–74 | 458 | 2.98 | <0.01 | 3.09 | <0.01 | 1.45 | <0.01 |
| 75–79 | 263 | 2.74 | 2.74 | 1.32 | |||
| 80+ | 318 | 2.65 | 2.57 | 1.25 | |||
| Female | 508 | 2.76 | <0.01 | 2.69 | <0.01 | 1.32 | <0.01 |
| Male | 531 | 2.87 | 2.99 | 1.39 | |||
| Non-white | 158 | 2.77 | 0.24 | 2.66 | 0.03 | 1.29 | 0.02 |
| White | 881 | 2.82 | 2.87 | 1.37 | |||
| Vision | |||||||
| Acuity: 20/20 or better | 638 | 2.89 | <0.01 | 2.95 | <0.01 | 1.40 | <0.01 |
| 20/20–20/40 | 389 | 2.71 | 2.66 | 1.29 | |||
| Worse than 20/40 | 12 | 2.58 | 2.51 | 1.24 | |||
| Contrast sensitivity: 33 letters or better | 945 | 2.84 | <0.01 | 2.88 | 0.01 | 1.37 | <0.01 |
| 30–32 letters | 69 | 2.62 | 2.59 | 1.26 | |||
| 29 or fewer letters | 24 | 2.42 | 2.23 | 1.06 | |||
| Binocular visual fields: no points missed | 574 | 2.87 | <0.01 | 2.93 | 0.01 | 1.39 | <0.01 |
| 1–10 | 404 | 2.78 | 2.76 | 1.33 | |||
| 11+ missed | 56 | 2.57 | 2.55 | 1.21 | |||
| Cognition | |||||||
| MMSE: 25 or more | 986 | 2.84 | <0.01 | 2.86 | 0.07 | 1.37 | <0.01 |
| 24 or less | 52 | 2.35 | 2.55 | 1.16 | |||
| Trails A: < 85 seconds | 960 | 2.85 | <0.01 | 2.88 | <0.01 | 1.37 | <0.01 |
| 85 seconds or more | 73 | 2.29 | 2.26 | 1.10 | |||
| Brief test of attention: 4 + | 896 | 2.86 | <0.01 | 2.89 | <0.01 | 1.38 | <0.01 |
| 3 or less | 139 | 2.56 | 2.59 | 1.22 | |||
| Physical Factors | |||||||
| 0 medical conditions | 501 | 2.87 | <0.01 | 2.90 | 0.01 | 1.39 | <0.01 |
| 1–2 medical conditions | 438 | 2.80 | 2.84 | 1.35 | |||
| 3+ medical conditions | 99 | 2.63 | 2.51 | 1.24 | |||
P-value is given by ANOVA.
Table 3.
Multi-variable linear regression models (final models) of initial reaction rate (IRR), physical reaction rate (PRR) and brake reaction rate (BRR).
| Covariate | IRR | PRR | BRR |
|---|---|---|---|
| (Age –76) | −0.01 (−0.02, −0.01) | −0.03 (−0.05, −0.02) | −0.01 (−0.02, −0.01) |
| Gender | |||
| Female | −0.15 (−0.21, −0.1) | −0.31 (−0.45, −0.17) | −0.10 (−0.14, −0.05) |
| Male | 0.00 (Ref) | 0.00 (Ref) | 0.00 (Ref) |
| Race | |||
| Non-white | 0.06 (−0.02, 0.14) | −0.17 (−0.37, 0.02) | −0.03 (−0.09, 0.03) |
| White | 0.00 (Ref) | 0.00 (Ref) | 0.00 (Ref) |
| Vision | |||
| Contrast Sensitivity (3 letters) | 0.04 (0, 0.08) | — | 0.00 (−0.03, 0.03) |
| Binocular Vision Field (10 points) | −0.08 (−0.13, −0.03) | — | −0.04 (−0.08, 0) |
| Cognition | |||
| MMSE>24 | 0.00 (Ref) | — | 0.00 (Ref) |
| MMSE <=24 | −0.21 (−0.35, −0.08) | — | −0.05 (−0.16, 0.05) |
| Log (paper trail test A) | −0.30 (−0.38, −0.22) | −0.37 (−0.55, −0.19) | −0.15 (−0.21, −0.09) |
| Brief Test of Attention | 0.02 (0.01, 0.04) | — | 0.01 (0, 0.02) |
| Physical Factors | |||
| 0 medical conditions | 0.00 (Ref) | 0.00 (Ref) | 0.00 (Ref) |
| 1–2 medical conditions | −0.02 (−0.08, 0.04) | 0.00 (−0.15, 0.14) | −0.01 (−0.06, 0.03) |
| 3+ medical conditions | −0.14 (−0.24, −0.04) | −0.28 (−0.53, −0.04) | −0.09 (−0.17, −0.01) |
An overall poorer score on the Mini-Mental State Examination and slower IRR were related as well, specifically with a worse score on the Brief Test of Attention and on Trails A. A significant association was observed between worse rate for the IRR and having 3 or more conditions related to pain in the hips, legs, knees or feet or current treatment for arthritis. 21% of the variance in IRR was explained by this model. Worse PRR also was related to older age and being female. Having three or more medical conditions also was related to PRR, as expected. No vision variable was related to PRR, but worse scores on Trails A, the cognitive test of visual search and psychomotor speed, was related to PRR.
Overall, the factors related to the individual components also were related to BRR (Table 3). In addition to age and female sex, increasing numbers of points missed in visual field was marginally related to slower BRR. Worse scores in the cognitive domains of attention, and especially visual search and psychomotor speed, also were related to slower BRR. Three or more medical conditions were associated with slower BRR.
DISCUSSION
In the Salisbury Eye Evaluation Driving Study, we found that older drivers with visual, cognitive, or physical deficits performed more slowly in the brake reaction test. As suggested by others,13 the two components of the brake reaction test were only modestly positively correlated with each other, with a correlation of 0.28 (Figure 2), consistent with a previous study, in which the correlations ranged from 0.24 to 0.44.13 The variability in correlations in the previous study was related to the variable times between the stimulus for braking, with the highest correlations during the tests with the most variable times. We also introduced variable times, but found an overall low correlation. Differences could also be due to the greater range of ages, 18–82, in the 72 subjects in the study by Warshawsky-Livne and Shinar, where younger subjects had overall faster times and less variability. Our subjects were all older drivers.
Nevertheless, the correlations suggest that initial reaction and physical reaction may have some common components. Slow IRR and PRR both were related to increasing age and female gender. Faster rates among males in Physical Reaction have previously been reported.13,14 One study found that females were slower when the brake pedal was at the same level as the gas pedal14; others have found that the sexes have similar times when the brake pedals were level.15 Gender differences on initial reaction time in braking have not been found previously.13,15 However, previous work has not controlled for any gender differences in cognition and physical complaints that may have masked such differences. Other studies using other models of reaction times have reported more variability among women compared to men.
We also found that physical condition, specifically three or more complaints of pain in feet, hips, legs, or arthritis, was associated both with PRR and IRR. Because IRR is thought to be primarily perceptual, this finding was not expected. However, the total time of initial reaction ends with a signal that the foot is moving off the gas pedal, which requires motor activity from the participant. It is conceivable that participants with pain in the lower extremities find it harder to initiate movement, and thus this delay may contribute to slower IRT.
Interestingly, we found that poorer scores on Trails A, a test of psychomotor speed and visual search, were related to slower PRR as well as IRR. Because PRR is believed to reflect a primarily motor response time, this finding was not expected. The relationship may reflect the participant’s unfamiliarity with the setup of the testing environment, requiring some thought as to where to move their feet to brake; however, we provided two test runs before the five actual trials, so some of this “learning” should have dissipated.
Low scores on the Brief Test of Attention were associated with slower IRR and PRR. Numerous studies have documented increasing brake reaction time in general when having to divide attention between driving performance and distracters. Of special interest are studies that have shown that the distraction of cell phone use while driving decreases the rate of reaction in a crucial driving situation, and increased the risk of crashes.6,7,16 A test of visual attention (as opposed to our cognitive test of attention) has been linked to crash risk, providing further support for the domain of attention as a critical factor in driving performance.17-20 In our study, we have linked this domain to poorer performance in both components of brake reaction test.
Visual loss, as measured by visual fields, was associated with slower IRR but was not related to PRR. Contrast sensitivity loss was weakly associated with slower IRR. Being able to see the stimulus leading to the need to brake is critical; research has documented poorer brake reaction times among persons with severe visual acuity loss.11 However, the older drivers in our study in general had good acuity, and the lack of an association between brake reaction time and acuity was expected. Our stimulus for braking, a traffic light mimic involving a change from a green light to red light, against a background of light gray on the computer screen, was of sufficient contrast that no one complained of having difficulty seeing it. However, other stimuli that are lower contrast, such as persons in gray clothing against gray background, may be more difficult to detect, resulting in substantially lower IRR. Others have shown that poor contrast sensitivity was associated with poorer driving performance when using an index of driving performance that included detecting objects.21
The association of visual field loss and slower IRR time is a new finding. The association is independent of attention, age, and gender. Because a visual field test requires a participant to react to a visual light stimulus by pressing a hand held device to indicate the point was seen, this test also measures reaction time to a stimulus as well as actual visual field. For this reason, we chose the most severe measure, that of missing the point rather than requiring a higher threshold, to be certain we were measuring visual loss and not a surrogate for reaction time. However, it will be important to obtain longitudinal data to corroborate the association.
There are limitations to our study. First, the SEEDS cohort was identified from the Maryland Department of Motor Vehicle Administration and, because of the legal restrictions on recruitment, cannot be considered a population-based study. Rather, it is a sample cohort of older drivers who will be followed over time for declines in vision and cognition and impact on driving performance. These findings cannot be generalized to a population of all older drivers, who may have more severe decrements in vision and cognition than we observed in our cohort, and who may continue driving even after failure to renew their license. However, even with our sample of drivers, we observed associations of poorer performance in brake reaction associated with cognitive and visual factors. We also experienced loss of data during a period of time. Because this loss was related to a time period, and not to a particular subgroup of our population, we do not believe this loss biased our findings.
Secondly, we recognize that our test of brake reaction time may not mimic a real car driving experience, where there may be far more uncertainty about the need to brake. Event uncertainty impacts the brake reaction test, as it increases the IRT.12 In our testing situations, persons were allowed to practice prior to testing; although the stimulus time was variable, the participant was always aware that a brake reaction was expected at some point. While reactions that “jumped the gun” (response prior to the light change) were not included, trials where the participant failed to respond to the stimulus also were not included because there would have been no segment components. Thus, these trials likely reflect better times for brake reaction than might be seen under real driving conditions. Nevertheless, we observed a BRT of greater than 1 second in 16% of our participants.
In the multivariate analysis, we accounted for only a small component of the variability in the PRR (R-square 0.08). Another source of variability may be the relatively imprecise measure of physical impairments. Medical conditions were self-reported and reflect pain rather than weakness. Ideally, we would have combined self-report of pain with measures of frailty by using a dynamometer.
In summary, our results support both common and unique factors for the individual components of the brake reaction test. The cognitive domain of psychomotor speed and visual search is particularly important for both components; vision appears to be particularly important for initial reaction. Even small effects on time as a result of these deficits may have significant consequences for the driver. The following example illustrates this point: at 55 miles per hour, a car travels 81 feet in a second. Assuming a person driving at 55 miles per hour takes one second to complete his initial reaction, he has already traveled 81 feet. If this person has lost 10 additional points in the visual field, it will now take him 88 feet to complete his initial reaction, before he physically responds by braking. Thus, even with adequate physical function, people with visual or cognitive impairment will have increased difficulties initially reacting to the braking stimulus in a timely fashion.
Footnotes
The Editor in Chief had no role in the review or determination of acceptance of this manuscript and was masked at all times to the review process.
References
- 1.Traeuber CM. Current Population Reports. Washington, DC: US Gov. Printing Office. United States Economics & Statistics Administration Bureau of Census; 1992. Sixty-five plus in America; pp. 23–178. 2–11. [Google Scholar]
- 2.DOT HS 807316. Washington, DC: National Highway Traffic Safety Administration, US Dept of Transportation; 1989. Conference on Research & Development Needed to Improve Safety and Mobility of Older Drivers. [Google Scholar]
- 3.Evans L. Risk of fatality from physical trauma versus age and sex. J Trauma. 1988;28:368–378. doi: 10.1097/00005373-198803000-00013. [DOI] [PubMed] [Google Scholar]
- 4.Stamatiadis N, Deacon JA. Trends in highway safety: effects of an aging population on accident propensity. Accid Anal Prev. 1995;27(4):443–459. doi: 10.1016/0001-4575(94)00086-2. [DOI] [PubMed] [Google Scholar]
- 5.Kuypers KP, Samyn N, Ramaekers JG. MDMA and alcohol effects, combined and alone, on objective and subjective measures of actual driving performance and psychomotor function. Psychopharmacology. 2006;187:467–475. doi: 10.1007/s00213-006-0434-z. [DOI] [PubMed] [Google Scholar]
- 6.Beede KE, Kass SJ. Engrossed in conversation: The impact of cell phones on simulated driving performance. Accid Anal Prev. 2006;38:415–421. doi: 10.1016/j.aap.2005.10.015. [DOI] [PubMed] [Google Scholar]
- 7.Hancock PA, Lesch M, Simmons L. The distraction effects of phone use during a crucial driving maneuver. Accid Anal Prev. 2003;35:501–514. doi: 10.1016/s0001-4575(02)00028-3. [DOI] [PubMed] [Google Scholar]
- 8.Tashiro M, Horikawa E, Mochizuki H, et al. Effects of fexofenadine and hydroxyzine on brake reaction time during car driving with cellular phone use. Hum Psychopharmacol Clin Exp. 2005;20:501–509. doi: 10.1002/hup.713. [DOI] [PubMed] [Google Scholar]
- 9.Vuurman EF, Rikken GH, Muntjewerff ND, de Halleux F, Ramaekers JG. Effects of desloratadine, diphenydramine and placebo on driving performance and psychomotor performance measurements. Eur J Clin Pharmacol. 2004;60:307–313. doi: 10.1007/s00228-004-0757-9. [DOI] [PubMed] [Google Scholar]
- 10.Ridout F, Hindmarch I. Effects of tianeptine and mianserin on car driving skills. Psychopharmacology. 2001;154:356–361. doi: 10.1007/s002130000662. [DOI] [PubMed] [Google Scholar]
- 11.Lamble D, Summala H, Hyvarinen L. Driving performance of drivers with impaired central visual acuity. Accid Anal Prev. 2002;34:711–716. doi: 10.1016/s0001-4575(01)00071-9. [DOI] [PubMed] [Google Scholar]
- 12.Warshawsky-Livne L, Shiner D. Effects of uncertainty, transmission type, driver age and gender on brake reaction and movement time. J Safety Res. 2002;33:117–128. doi: 10.1016/s0022-4375(02)00006-3. [DOI] [PubMed] [Google Scholar]
- 13.Rosner B. Fundamentals of Biostatistics. 4. Duxbury Press; Belmont CA: 1995. pp. 503–517. [Google Scholar]
- 14.Davies BT, Watts JM. Further investigations of movement time between brake and accelerator pedals in automobiles. Hum Factors. 1970;12:559–561. doi: 10.1177/001872086901100413. [DOI] [PubMed] [Google Scholar]
- 15.Schweitzer N, Apter Y, Ben-avid J, Liebermann D, Parush A. A field study on braking responses during driving II: Minimum brake reaction times. Ergonomics. 1995;38:1903–1910. [Google Scholar]
- 16.McCartt AT, Hellinga LA, Bratiman KA. Cell phones and driving: Review of research. Traffic Inj Prev. 2006;7:89–106. doi: 10.1080/15389580600651103. [DOI] [PubMed] [Google Scholar]
- 17.Ball K, Owsley C, Sloane ME, Roenker DL, Bruni JR. Visual attention problems as a predictor of vehicle crashes in older drivers. Invest Ophthalmol Vis Sci. 1993;34:3110–3123. [PubMed] [Google Scholar]
- 18.Owsley C, Ball K, McGwin G, Jr, et al. Visual processing impairment and risk of motor vehicle crash among older adults. JAMA. 1998;279:1083–1088. doi: 10.1001/jama.279.14.1083. [DOI] [PubMed] [Google Scholar]
- 19.Owsley C, McGwin G. Association between visual attention and mobility in older adults. J Am Geriatr Soc. 2004;52:1901–1906. doi: 10.1111/j.1532-5415.2004.52516.x. [DOI] [PubMed] [Google Scholar]
- 20.Bowers A, Peli E, Elgin J, McGwin G, Owsley C. On-road driving with moderate visual field loss. Optometry Vision Sci. 2005;82:657–667. doi: 10.1097/01.opx.0000175558.33268.b5. [DOI] [PubMed] [Google Scholar]
- 21.Wood JM. Age and visual impairment decrease driving performance as measured on a closed road circuit. Hum Factors. 2002;44:482–494. doi: 10.1518/0018720024497664. [DOI] [PubMed] [Google Scholar]