

Abstract
The goal of targeted ultrasound contrast agents is to significantly and selectively enhance the detection of a targeted vascular site. In this manuscript, three distinct contrast agents targeted to the αvβ3 integrin are examined. The αvβ3 integrin has been shown to be highly expressed on metastatic tumors and endothelial cells during neovascularization, and its expression has been shown to correlate with tumor grade. Specific adhesion of these contrast agents to αvβ3-expressing cell monolayers is demonstrated in vitro, and compared with that of nontargeted agents. Acoustic studies illustrate a backscatter amplitude increase from monolayers exposed to the targeted contrast agents of up to 13-fold (22 dB) relative to enhancement due to control bubbles. A linear dependence between the echo amplitude and bubble concentration was observed for bound agents. The decorrelation of the echo from adherent targeted agents is observed over successive pulses as a function of acoustic pressure and bubble density. Frequency–domain analysis demonstrates that adherent targeted bubbles exhibit high-amplitude narrowband echo components, in contrast to the primarily wideband response from free microbubbles. Results suggest that adherent targeted contrast agents are differentiable from free-floating microbubbles, that targeted contrast agents provide higher sensitivity in the detection of angiogenesis, and that conventional ultrasound imaging techniques such as signal subtraction or decorrelation detection can be used to detect integrin-expressing vasculature with sufficient signal-to-noise.
Keywords: Ultrasound, contrast agent, microbubble, α V β 3, integrin, targeted imaging, molecular imaging, angiogenesis
Introduction
With recent advances in molecular science, the opportunity has arisen to design targeted ultrasound contrast agents. Unlike blood pool agents, site-directed contrast agents are intended to selectively enhance the detection of diseased tissues, which would be otherwise difficult to distinguish from surrounding normal tissue. These novel targeted contrast agents permit noninvasive detection of thrombus, cancer, inflammation, or other sites where specific integrins or other adhesion molecules are expressed. Site-specific adhesion molecules such as monoclonal antibodies, peptides, asialoglycoproteins, or polysaccharides are incorporated into the shell of the microbubble or liposome [1]. After injection into the bloodstream, the targeted agent accumulates via adhesion receptors at the affected site, enhancing detection with a clinical imaging system [2]. Tumor targeting has demonstrated promise with magnetic resonance imaging (MRI) [3–6], nuclear medicine [7,8], and most recently, ultrasound [9,10], as researchers have demonstrated the success of targeting specific contrast agents to the αvβ3 integrin, permitting noninvasive monitoring of angiogenesis.
The αvβ3 integrin promises to be an effective target for molecular imaging of cancer, due to its role in angiogenesis. Angiogenesis, which is the formation of new blood vessels, has been shown to be necessary for malignant tumor growth and metastasis [11–16]. The αvβ3 integrin is expressed during angiogenesis and has been shown to correlate with tumor grade [17–20]. It is typically expressed on various malignant tumors, as well as on endothelial cells during neovascularization [14,21–24]. Therefore, αvβ3 is an appropriate receptor for targeted ultrasound imaging where adhesion of contrast agents to endothelial cells provides the signal enhancement.
Ultrasonic contrast agents (UCAs) are encapsulated microbubbles on the order of 1 to 10 μm in diameter. UCAs are filled with air, or a gas with a lower water solubility than air, such as a perfluorocarbon. The difference in acoustic impedance between blood or tissue and the gas within a microbubble results in UCAs being extremely echogenic, such that the presence of even a single UCA can be detected with an ultrasonic imaging system. Typically, a small amount of contrast agent (ranging from μL to mL) is injected into the bloodstream during an ultrasonic exam to enhance measurements of tissue perfusion or assist in delineating anatomical features. Successful targeted contrast agents must bind in sufficient quantities at the desired site, and resonate with sufficient echogenicity to produce a detectable signal change when interrogated with an imaging system.
In this work, we aim to enhance the sensitivity of ultrasound to tumors by targeting cells which express αvβ3. For this purpose, targeted UCAs incorporate either cyclic analogs of the arginine–glycine–aspartic acid (RGD) ligand, or the anti-αvβ3 antibody LM609.
Previous studies of targeted contrast agents directed towards angiogenesis have demonstrated that the retention of targeted microbubbles in αvβ3-expressing vasculature can enhance ultrasound echoes from the sample volume [9,10]. Although these studies illustrate the potential of these targeted contrast agents, prior measurements of signal enhancement have been based on video intensity as produced by a clinical imaging system. In this analysis, we provide further insight into the application of contrast agents targeted to αvβ3 through measurements of the magnitude and frequency of acoustic responses from adherent and free micro-bubbles. First, we demonstrate the increased adhesion of targeted agents to αvβ3-expressing cells compared to controls, both optically and through acoustic measurements. The specificity of the targeted agents is confirmed through competitive inhibition experiments with free peptide or antibody. Second, optical and acoustic measurements are used to define the relationship between adherent bubble density and signal amplitude. Additionally, the rate of echo decorrelation and the spectral characteristics of echoes from adherent bubbles are examined, in order to elucidate the ability to use signal processing techniques to optimally detect adherent targeted agents.
Cell monolayers, including two αvβ3-expressing lines and a null control, are exposed to both targeted and nontargeted contrast agents. The cell layers are optically examined and scanned with an ultrasonic imaging system, and the change in acoustic backscatter from the cell layer is quantified as a function of adhesion ligand, as determined from the radiofrequency echo amplitude. Inhibition with free RGD peptide or antibody demonstrates the specificity of the adhesion mechanism.
Materials and Methods
Cell Culture
Human umbilical vein endothelial cells (HUVECs) were purchased from Cascade Biologicals (Portland, OR) and cultured and maintained using the manufacturer's recommendations. A375m and VUP cell lines were obtained from John Marshall at Cancer Research UK Clinical Centre, London. For the optical and acoustic studies, cell lines were grown on either 25-mm glass coverslip circles or Kapton HN30 film (DuPont, Wilmington, DE). The 25-mm glass coverslips were sterilized by autoclaving for 20 min and then incubated with 1% w/v gelatin in PBS++ at 37 °C for 30 min. The coverslips were then incubated in 0.5% v/v glutaralde-hyde/PBS++, followed by 0.1 M glycine in PBS++, and then washed extensively with PBS++ and incubated in culture media. Cells were seeded onto the coverslips at a density of 1−2 × 10⁵ per coverslip. The cells were then incubated in a humidified tissue culture incubator at 37°C and grown under 5% CO2 atmosphere. One to three hours after the cells attached, media was gently added and the cells were incubated at 37°C in a humidified tissue culture incubator 95%/5% air/CO2 overnight.
Activation of αvβ3
The αvβ3 expression was up-regulated with the addition of 200 ng/mL phorbol 12-myristate 13-acetate (PMA) (Sigma, St. Louis, MO), after which the cells were incubated for the indicated time at 37°C. Following stimulation, the coverslip or Kapton membrane was washed twice with PBS++ prior to analysis.
Flow Cytometry
For FACS analysis, cells were gently detached by treatment with a dilute trypsin/EDTA solution. The average number of αvβ3 sites per cell was determined by flow cytometry using a FacSCAN cytometer (Becton Dickinson, Franklin Lakes, NJ). FITC-(fluorescein)-conjugated LM609 human anti-αvβ3-antibody (Chemicon International, Temecula, CA) was used for quantitation of site densities. Quantum Simply Cellular beads (Bangs Laboratory, Fishers, IN), which have defined numbers of antibody binding sites per bead, were used for calibration. FITC-labeled rat anti-mouse antiserum was incubated separately with both the cells and the Simply Cellular beads. The average mean fluorescence for the targeted agents was plotted against the standard curve obtained for the Simply Cellular beads to yield the binding site density.
Microbubbles
Antibody-targeted microbubbles were produced in-house by 20 kHz sonication of a lipid formulation comprising 1,2-dibehenoyl-sn-glycero-3-phosphocholine (PE), polyoxyethylene 40 stearate (Myrj 52), and 1,2-distearoyl-sn-glycero-3-phosphoethanolamine-N-{biotinyl(polyethylene glycol)2000} (PEG-biotin-PE), 85:10:5, m/m/m, respectively [25]. Microbubbles were sized using a Coulter Particle Counter with a probe orifice size of 50 μm. Bubble diameter was visually confirmed using a size-calibrated Olympus IX-70 inverted microscope with a 60× oil objective under bright-field illumination. Bubbles were purified from the unincorporated biotinylated lipids by flotation, and then resuspended in PBS++. Following purification, anti-human αvβ3 antibodies (biotinylated MAB 1976 from Chemicon) were conjugated to the bubbles using an avidin linker technique [26]. Antibody conjugated bubbles were then repurified using the floatation protocol. Bubbles synthesized without 1,2-distearoyl-sn-glycero-3-phosphoethanolamine-N-{biotinyl (polyethylene glycol)2000} and without biotin were used as a control for nonspecific ionic interaction. Bubbles made in-house using these techniques are referred to as UCD-C for the nontargeted control agents, and UCD-T for the targeted agents. Bubble concentrations in the stock preparations of UCD-C and UCD-T were ∼2 × 10⁶ and ∼3 × 10⁶ bubbles/μL, respectively. The mean agent diameter for the agents was ∼2.6 μm with a standard deviation of ∼1.7 and 2.0 μm with a standard deviation of ∼1.5 μm, respectively.
Peptide-targeted microbubbles were provided by ImaRx Therapeutics (Tucson, AZ). MRX-408 is a lipid-shelled microbubble designed by ImaRx Therapeutics which incorporates a cyclic-RGD peptide bioconjugate ligand into the bubble membrane. MRX-408 was used in two different formulations, with 1 and 5 wt.% RGD peptide, which we will refer to as MRX-408−1 and MRX-408−5, respectively. Although the bioconjugate ligands incorporating RGD peptides used in this research were initially intended for targeting the platelet receptor GPIIb IIIa [27] and therefore may not be optimized for in vivo studies due to lack of specificity, customized cyclic RGD peptides have demonstrated potent selectivity for the αvβ3 integrin [28–30]. The contrast agent MRX-133, which lacks the targeting ligand but is otherwise similar to the MRX-408 agents, was used as a control for the MRX agents. Bubble concentrations for each of these stock agents were similar, with a concentration on the order of 2 × 10⁶ bubbles/μL. The mean diameters for all three agents were ∼2.0 μm, with standard deviations of ∼1.6 μm.
Optical and Acoustic Studies
The Kapton film or glass coverslip with the cell monolayer was mounted into a stainless steel holder which provided a frame with a 2-mm deep well above the cell layer. Kapton film was nearly acoustically transparent at the frequency used in this study (2.25 MHz), and is fairly optically transparent. For optical-only studies, glass coverslips were used in order to obtain better optical clarity. For blocking experiments, the appropriate blocking agent was added to the well prior to the addition of the microbubbles, and allowed to incubate for approximately 500 sec. Targeted or control bubbles were introduced to the cell layer by filling the well with PBS++ and a small volume of the agent to be studied. This volume of bubbles added to the chamber was 10 μL, in all cases except for the studies of backscatter and decorrelation versus bubble density, where the initial concentration was reduced in increments over an order of magnitude to achieve lower densities of adherent bubbles. The well was then covered with a 35-mm glass coverslip to retain the liquid in the well, inverted, and maintained at 37°C for another 500 sec. The 35-mm coverslip was then removed, and the cell layer was rinsed with PBS++ for 3 sec using a squirt bottle. Every effort was made to apply the same rinsing technique across all experiments. Optical microscopy was performed in order to record the number of bound bubbles per cell. In each case, 20 optical fields were analyzed for the number of bound bubbles per cell. Data were normalized to the number of bound bubbles per square micron of cell area, with the surface area of a HUVEC estimated to be approximately 500 μm2, and that of the A375m and VUP estimated to be approximately 50 μm2.
For acoustic studies, the sample was then placed in a PBS++ bath for ultrasonic interrogation. A 2.25-MHz transducer (Panametrics V305), spherically focused at 2 in., was confocally mounted with the center of the cell layer sample. The −12 dB bandwidth for this transducer was approximately 0.6−3.6 MHz. The sample was mounted at 60° with respect to the transducer axis to minimize specular reflections. The water bath was filled with PBS++ in order to provide acoustic coupling for the transducer and to maintain the viability of the cell layer. The transducer was energized with a Ritec SP801 ultrasonic pulser. The acoustic pulse was a sinusoid of approximately 1.5 cycles. A Ritec BR640 receiver was used to amplify scattered echoes from the sample volume and a Ritec MDX-2 diplexor permitted transmission and reception with the same transducer. A Lecroy 9350 digital oscilloscope was used to digitize received echoes and a PC with a LabView interface was used to record data. Postprocessing was performed in MATLAB. Amplitude of received echoes was determined from the peak voltage of the received signal.
Statistics
Statistical significance between mean values was determined using the two-sided Student's t test, and significance was indicated by p < .05.
Results
Confirmation of αvβ3 Expression by Flow Cytometry
αvβ3 expression of cell lines was confirmed by flow cytometry. The αvβ3 receptor densities for A375m, HUVECs, and VUP were approximately 167,500 ± 22,900, 145,300 ± 33,400, and 3,809 ± 1,666 sites/cell (background level), respectively. These results are consistent with previous reports, which have demonstrated high integrin expression levels for both HUVEC and A375m melanoma lines [31,32]. Although FACS using the LM609 antibody was unable to show changes in integrin activation with stimulation, recent studies using a reporter of αvβ3, WOW-1, have demonstrated an increase in integrin activation of 2.4-fold with PMA stimulation [33].
Optical Observations of Bubble Adhesion
Optical microscopy was used to measure the density of adherent bubbles to cell monolayers for control and targeted bubbles. Targeted microbubbles demonstrated substantial adhesion to the αvβ3-expressing cell lines used in these studies. The adhesion of targeted bubbles to the null cell line and the adhesion of nontargeted agents to αvβ3-expressing cell lines were observed to be minimal. We observed approximately 3-fold greater adhesion of peptide-targeted bubbles (MRX-408−1) to HUVEC 3 hr after PMA stimulation compared to unstimulated HUVEC (data not shown). Figure 1 is a micrograph showing the adhesion of RGD-targeted microbubbles (MRX-408−1) to stimulated HUVECs. Targeted micro-bubbles appear as black spheres due to their index of refraction. The image illustrates three large microbubbles and several smaller microbubbles adherent to a large HUVEC in the center of the image.
Figure 1.
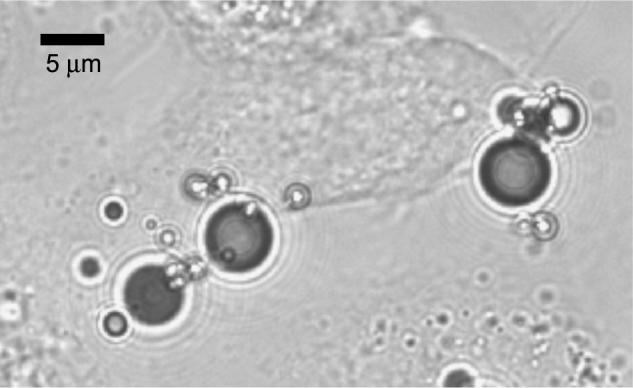
Optical micrograph of a HUVEC monolayer after incubation with peptide-targeted microbubbles. Several microbubbles are observed adherent to the cell in the center of the image.
The bar graph in Figure 2A illustrates the optically determined adhesion density of antibody (UCD-T) and peptide-targeted microbubbles (MRX-408) to HUVEC. Based on the evaluation of optical images, targeted bubble adhesion to PMA stimulated HUVEC for UCD-T was 18-fold greater than the control agent, UCD-C. Additionally, adhesion of targeted agents MRX-408−1 and MRX-408−5 was 16-fold and 23-fold greater than adhesion of the control agent MRX-133, respectively. The bar graph in Figure 2B shows the number of bubbles adherent to A375m cells. For stimulated A375m, bubble adhesion increased by 6-fold for UCD-T compared to UCD-C, and by 6-fold for MRX-408−1 compared to MRX-133. Finally, the adhesion of the targeted agent MRX-408−1 to the null expressing control VUP cells was measured to be approximately 17-fold lower than adhesion to unstimulated HUVEC (data not shown). In each case, the difference in adherent bubble density between control and targeted microbubbles was significant (p < .05). The adhesion of targeted bubbles to the null cell line was also observed to be significantly less than adhesion to the αvβ3 expressing lines (p < .05).
Figure 2.

Bubble density (bubbles per square micron of cell area) as observed optically for control, peptide-targeted, and antibody-targeted agents. (A) Bubbles adherent to HUVEC. (B) Bubbles adherent to A375m. Asterisk indicates significant difference from control.
Acoustic Studies of Backscatter Enhancement
The effect of targeted microbubbles on the echogenicity of the cell monolayers was measured for targeted and control agents. Data presented in Figure 3A–D demonstrate the echo enhancement for PMA stimulated cell monolayers exposed to targeted microbubbles compared to monolayers exposed to control microbubbles. Each bar illustrates a ratio of the scattered echo amplitude from the targeted case normalized by the control case, and each represents the new value calculated over 5 to 40 acoustic sample volumes. The echo amplitude due to adhesion of MRX-408−1 to HUVEC relative to the echo amplitude provided by MRX-133 demonstrated a ∼13-fold increase, or ∼22 dB (p < .05) (Figure 3A). Pretreatment of the cell layer with either 50 μg/mL free RGD peptide or 20 μg/mL free LM609 antibody inhibited adhesion, and subsequently reduced scattered signal amplitude below the nonblocked case. For the LM609 blocking treatment, there was no significant difference between the enhancement of the preblocked targeted bubble and the control bubble. Pretreatment of the cell layer with 50 μL/mL of a scrambled peptide, RGA, resulted in no significant blocking effect.
Figure 3.

Acoustic enhancement as compared to controls. Plots indicate ratio of echo amplitude from targeted agents normalized to control. Blocking with RGA, RGD, or LM609 antibody was used to demonstrate specificity. (A) MRX-408−1 adherent to HUVEC. (B) MRX-408−5 adherent to HUVEC. (C) Antibody-targeted UCD-T adherent to HUVEC. (D) Antibody-targeted UCD-T adherent to A375m. Asterisk indicates significant difference from control; double asterisk indicates no significant difference from control.
Acoustic studies performed with the targeted agent MRX-408−5 and HUVEC demonstrated similar trends as those using MRX-408−1 (differences were not significant) (Figure 3B). Echo enhancement of 12-fold was provided by adhesion of the targeted agent (p < .05), and the specificity of the agent was demonstrated through blocking.
Peak echo amplitude scattered was ∼10-fold (20.0 dB) higher from HUVECs exposed to UCD-T as opposed to UCD-C, indicating significant enhancement by the antibody-targeted bubble (p < .05) (Figure 3C).
Echo enhancement of A375m due to adhesion of UCD-T was 10-fold greater than enhancement due to the control agent UCD-C (p < .05), and pretreatment with 20 μg/mL free LM609 blocked adhesion to levels not significantly different than the control bubble (p < .05) (Figure 3D).
Echo Amplitude as a Function of Bubble Density
The echo amplitude scattered from MRX408−1 bubbles adherent to HUVECs was measured as a function of adherent bubble density for two clinically relevant acoustic pressures, 350 and 2500 kPa. Figure 4A–B shows echo amplitude in millivolts (mV) as a function of bubble density for transmitted pressures of 350 and 2500 kPa. Scattered signal amplitude was observed to increase monotonically for bubble densities within the range observed, although the scatter of the data made it difficult to fit any trends. The range of bubble densities measured was from 0.03 to 15 bubbles/1000 μm2 for the 350-kPa study, and the corresponding signal amplitudes ranged from ∼0.1 to 3.3 mV. For the 2500-kPa study, the range of bubble densities ranged from 0.5 to 15 bubbles/1000 μm2, and echo amplitudes ranged from ∼1 to 14 mV. The linear least-squares fits, illustrated by a dotted line on the plots, have r2 = .43 for the 350-kPa case, and r2 = .70 for the 2500-kPa case.
Figure 4.
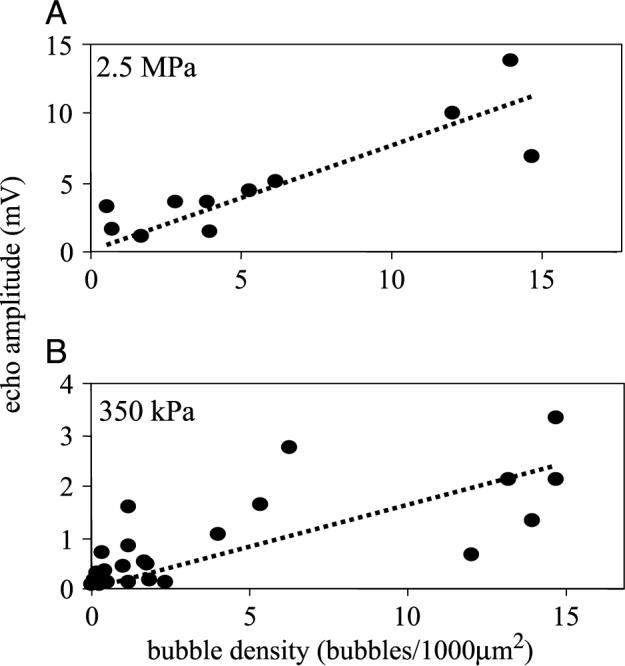
Amplitude of scattered echo as a function of bubble density on HUVEC. (A) Acoustic pressure of 2.5 MPa. (B) Acoustic pressure of 350 kPa.
Echo Decorrelation as a Function of Pulsing and Bubble Concentration
Decorrelation of microbubble echoes with repeated insonation of adherent targeted contrast agents was studied as a function of acoustic pressure and bubble concentration. MRX-408−1 bubbles adherent to HUVEC were insonified at a rate of 5 pulses/sec, and postprocessing of the scattered echoes was performed to quantify signal decorrelation. Figure 5A–C illustrates echo decorrelation as a function of pulse index (number of pubes per sample volume) for pressures of 350, 700, and 2500 kPa. The data recorded illustrate that decorrelation of the echo occurs more rapidly at lower bubble densities and at higher acoustic pressures. At the highest acoustic pressure, 2.5 MPa, the received echoes decorrelated over a few pulses in all cases. For cell layers with approximately three bubbles bound per cell (1 bubble/167 μm2, Figure 5A), the signal required 12 pulses for the correlation magnitude to decrease to zero, in contrast to 5 pulses for 0.1 bubble per cell (1 bubble/5000 μm2, Figure 5C). At the lowest acoustic pressure, 350 kPa, the echoes remained highly correlated for over 1000 pulses, even at bubble densities as low as 1 bubble/10 cells (1 bubble/5000 μm2).
Figure 5.

Decorrelation of scattered radio frequency echoes as a function of three acoustic pressures, 2500, 700, and 350 kPa, as a function of bubble density on HUVEC. (A) Bubble density ∼3 bubbles/cell. (B) Bubble density ∼0.5 bubble/cells. (C) Bubble density ∼0.1 bubble/cells.
Frequency Analysis of Acoustic Backscatter Enhancement
Echoes were recorded from free and adherent microbubbles, and the frequency spectrum of each was evaluated and compared. Free microbubble echoes were recorded from individual bubbles in suspension, whereas adherent microbubble echoes were from low concentration studies that produced a peak time–domain echo amplitude of less than 200 mV. We compared spectra for free-floating targeted microbubbles (MRX-408−5) to those adherent to a HUVEC monolayer (Figure 6). Spectra were corrected for transducer bandwidth. For this reason, the system noise floor, also included in the figure, appears concave over the bandwidth. The spectrum from adherent microbubbles had a mean frequency of 2.3 MHz and a −6 dB bandwidth of approximately 1.5 MHz. In contrast, the mean frequency for the free microbubbles was 2.7 MHz. The bandwidth of the echo from the free contrast agents in this case could not be fully characterized with the 2.25-MHz transducer due to the poor response of the transducer above 3.6 MHz, however, previous experiments performed with a 5-MHz transducer used for detection demonstrated that broadband echo spectra from free contrast agents extends beyond 8 MHz [34].
Figure 6.
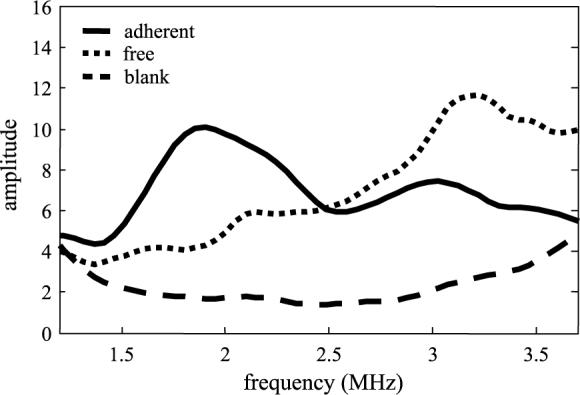
Echo spectra scattered from free bubbles in suspension as compared to adherent microbubbles, and plotted in addition to the noise floor of the system. Suspended microbubbles produce a more wideband response than adherent microbubbles.
Discussion
Both A375m and HUVEC cell lines were found to express abundant functional surface αvβ3 receptors. Optical studies confirmed substantially greater adhesion to the cell monolayers by targeted microbubbles than by control microbubbles. For HUVEC experiments, both the peptide and antibody-targeted bubbles achieved maximum bubble densities of ∼16−23 bubbles per cell. Although the binding affinity of the individual RGD peptide bonds in these cases is several orders of magnitude lower than that of the antibody (KdLM609 = 0.18 × 10⁻⁹ M [35] vs. KdRGD = ∼1 × 10⁻⁶ M [28]), we hypothesize that the multivalent ligand binding achieved because of the large contact area between the contrast agents and the monolayer results in equivalent adhesion in either case. For a bubble of 2 μm in diameter, we estimate a surface area in contact with the monolayer within the approximate extension range of the PEG-ligand bioconjugate (∼15 nm) to be on the order of 0.09 μm2, or 0.75% of the total bubble surface area. Assuming ∼7.5 mol% of bioconjugate (UCD-T), and an area of the lipid headgroup of ∼75Å2, the ligand density would be on the order of 1 × 10⁶ per bubble. This bioconjugate density would potentially provide ∼7500 ligands in contact between a bubble and a monolayer. In this case, the likely limit to bubble adhesion would be integrin expression, conformation, and localization, rather than affinity of RGD versus antibody. Additionally, it is likely that there were differences in the ligand density between the different agent types. For MRX-408−5, ∼1.3 mol% of bioconjugate is used in the bubble formulation and we estimate ∼2 × 10⁵ ligands per bubble. Significant differences were not observed between the adhesion of either type of bubble and HUVEC, indicating that contact surface area between the bubbles and the monolayer was great enough so that a minimum number of adhesion ligands was achieved regardless of ligand type. We attribute differences in adhesion between MRX-408−1 and UCD-T for the A375m cells to the nonspecific adhesion which was observed with the MRX agents and the A375m cell line. Although ∼145,300−167,500 sites were expressed on suspended A375 cells and HUVEC, respectively, as measured by flow cytometry, it is likely that fewer sites are accessible when the cells are in a monolayer. Confocal microscopy showed that αvβ3 expression was primarily on the edges of the cells (data not shown, and Ref. [36]), which corresponds with the regions where maximum bubble adhesion was observed. Additionally, agents were observed to adhere in clumps. This observation is consistent with the findings of Lum et al. [37] who report that activated integrins also cluster on the plasma membrane. Thus, it is likely that maximum bubble density was limited by available active integrins and the spatial density of bubbles that could fit around the cell periphery. The density of adherent MRX-133 nontargeted agents was optically measured to be ∼7-fold higher on A375m cells than on HUVEC. The mechanism for this nonspecific biding is unknown although possibly due to electrostatic interactions, as the MRX-133 microbubbles possess a net negative charge. For this reason, further studies with the MRX agents were conducted with HUVEC.
Both peptide- and antibody-targeted agents significantly enhanced the acoustic signal from the targeted cell monolayer, and both demonstrated specificity for the αvβ3 integrin (p < .05). The adhesion of peptide-targeted bubbles was inhibited by pretreating the mono-layer with RGD peptide or LM609 antibody, whereas a control peptide, RGA, showed no blocking effect. Following blocking with RGD peptide, echo amplitude was not reduced to the same extent as antibody blocked monolayers. We hypothesize that this is due to the lower binding affinity of the individual peptide ligands in contrast to the antibody. Acoustic enhancement from A375m cells with the antibody-targeted agents appeared nearly 2-fold higher than observed for enhancement of HUVEC, however, optical counts did not demonstrate this difference.
Initial results support the hypothesis that scattered echo amplitude can be correlated with density of targeted agents, and therefore would be indicative of the degree of expression of molecular target. For low concentrations of microbubbles, peak echo amplitude from adherent bubbles was observed to increase in proportion to the bubble density. There appeared to be a direct correlation between bubble density and signal amplitude. A linear fit of the trend was observed at both acoustic pressures (r2 = .43, 350 kPa; r2 = .70, 2500 kPa). This is different than observed in previous studies of contrast agents in suspension, which demonstrated a linear relationship between backscattered power and concentration, rather than amplitude [38].
Although the large size of gas-core contrast agents, such as those described in this manuscript, may reduce the achievable agent density compared to smaller contrast agents, such as perfluorocarbon nanoparticles, gas-core agents retain their utility due to their significant echogenicity and sensitivity to acoustic pressure. The significant mismatch in acoustic impedance between tissue and a microbubble contrast agent means that an ultrasonic imaging system can detect the echo from only a few microbubbles within the acoustic sample volume. Previous studies by Leong-Poi et al. [9] have reported significant acoustic enhancement for targeted bubble retention in a rat tumor model on the order of 7−20 bubbles per 10 optical fields or 0.5 mm2. Although this sensitivity could also be viewed as a drawback in the case of nonspecific bubble retention, the increased concentration of adherent bubbles at a target site provides a substantial increase in signal-to-noise over the echoes from a much lower concentration of nonspecifically retained bubbles. Additionally, the most significant advantage of this type of agent is its sensitivity to acoustic pressure. High-intensity ultrasound rapidly disrupts microbubble contrast agents, and the decorrelation of the resulting echo provides a means to discriminate contrast agent echoes from tissue. This technique of decorrelation-based contrast imaging is unique to ultrasound.
At high acoustic pressures (2.5 MPa), the scattered echo from adherent bubbles decorrelated rapidly as bubbles were destroyed. This effect was pronounced at lower concentrations, requiring less than half the number of transmitted pulses to achieve similar decorrelation for an order of magnitude less dense bubbles. Lower acoustic intensities did not produce rapid signal decorrelation. This implies that targeted agents adherent at a vascular site could be imaged repeatedly and nondestructively with the use of low acoustic intensities. This relationship between decorrelation rate and bubble density may also provide a means for estimating adherent bubble concentration, and therefore receptor density. Decorrelation-based techniques have shown initial promise in detection of contrast agents in animal models, but have not yet been used to estimate bubble density [39].
Adherent agents produced an echo of large magnitude, even greater than that of free-floating contrast agents at an order of magnitude higher acoustic pressure. Although for these experiments we were unable to compare the concentration of the free and adherent bubbles, we hypothesize that this magnitude difference may be due to the contrast agents scattering ultrasound coherently when bound to the cell monolayer. Similar results have been documented for perfluorocarbon nanoparticles, particles, which are weakly echogenic in suspension, but can produce a substantial scattered echo when deposited in a layer [40,41]. Additionally, a similar high-amplitude, narrow bandwidth, signal is observed when contrast agents are concentrated along a surface due to radiation force [42]. Microbubbles adherent to a cell layer act as a strong reflector of the transmitted center frequency and show a high-amplitude narrowband spectrum. In contrast, free microbubbles produce an extremely broadband signal [42,43]. This difference in frequency content may be taken advantage of by imaging schemes designed to separate the signals from adherent and non-adherent bubbles.
Conclusion
This study contributes to the field of targeted imaging with ultrasound with the first analysis of the acoustic responses from microbubbles adherent to αvβ3-expressing cells. Preliminary results indicate that targeted agents can substantially increase the backscattered energy from a targeted site, unlike traditional nontargeted agents. Additionally, the scattered echo from targeted contrast agents is proportional to the density of adherent agents, and decorrelates rapidly with high transmitted acoustic pressures. It is observed that targeted microbubbles adherent in a layer produce a large narrowband response, which has less harmonic content than echoes from free microbubbles. These results demonstrate that targeted contrast can substantially increase the signal-to-noise from a target site, and therefore may increase the sensitivity of ultrasound to pathologies otherwise difficult to detect.
Acknowledgments
This research was supported by NIH 1R21CA980692 and by an institutional research grant from the UC Davis Cancer Center. We thank Christina Lin and Hanako Zeidenberg for assistance with data analysis. We also thank Dustin Kruse and Susannah Bloch for writing LabView data acquisition software.
Abbreviations
- UCA
ultrasound contrast agent
- RGD
arginine-glycine-aspartic acid peptide sequence
- RGA
arginine-glycine-alanine peptide sequence
- HUVEC
human umbilical vein endothelial cell(s).
References
- 1.Lanza GM, Wickline SA. Targeted ultrasonic contrast agents for molecular imaging and therapy. Prog Cardiovasc Dis. 2001;44:13–31. doi: 10.1053/pcad.2001.26440. [DOI] [PubMed] [Google Scholar]
- 2.Klibanov AL, Hughes MS, Marsh JN, Hall CS, Miller JG, Wible JH, Brandenburger GH. Targeting of ultrasound contrast material. An in vitro feasibility study. Acta Radiol Suppl. 1997;412:113–120. [PubMed] [Google Scholar]
- 3.Anderson SA, Rader RK, Westlin WF, Null C, Jackson D, Lanza GM, Wickline SA, Kotyk JJ. Magnetic resonance contrast enhancement of neovasculature with alpha(v)beta(3)-targeted nanoparticles. Magn Reson Med. 2000;44:433–439. doi: 10.1002/1522-2594(200009)44:3<433::aid-mrm14>3.0.co;2-9. [DOI] [PubMed] [Google Scholar]
- 4.Sipkins DA, Cheresh DA, Kazemi MR, Nevin LM, Bednarski MD, Li KC. Detection of tumor angiogenesis in vivo by alpha Vbeta3-targeted magnetic resonance imaging. NatMed. 1998;4:623–626. doi: 10.1038/nm0598-623. [DOI] [PubMed] [Google Scholar]
- 5.Winter PM, Caruthers SD, Kassner A, Harris TD, Chinen LK, Allen JS, Lacy EK, Zhang H, Robertson JD, Wickline SA, Lanza GM. Molecular imaging of angiogenesis in nascent Vx-2 rabbit tumors using a novel alpha(nu)beta3-targeted nano-particle and 1.5 tesla magnetic resonance imaging. Cancer Res. 2003;63:5838–5843. [PubMed] [Google Scholar]
- 6.Winter PM, Morawski AM, Caruthers SD, Fuhrhop RW, Zhang H, Williams TA, Allen JS, Lacy EK, Robertson JD, Lanza GM, Wickline SA. Molecular imaging of angiogenesis in early-stage atherosclerosis with alpha(v)beta3-integrin-targeted nanoparticles. Circulation. 2003;108:2270–2274. doi: 10.1161/01.CIR.0000093185.16083.95. [DOI] [PubMed] [Google Scholar]
- 7.Haubner R, Wester HJ, Weber WA, Mang C, Ziegler SI, Goodman SL, Senekowitsch-Schmidtke R, Kessler H, Schwaiger M. Noninvasive imaging of alpha(v)beta3 integrin expression using 18F-labeled RGD-containing glycopeptide and positron emission tomography. Cancer Res. 2001;61:1781–1785. [PubMed] [Google Scholar]
- 8.Haubner RH, Wester HJ, Weber WA, Schwaiger M. Radio-tracer-based strategies to image angiogenesis. Q J Nucl Med. 2003;47:189–199. [PubMed] [Google Scholar]
- 9.Ellegala DB, Leong-Poi H, Carpenter JE, Klibanov AL, Kaul S, Shaffrey ME, Sklenar J, Lindner JR. Imaging tumor angiogenesis with contrast ultrasound and microbubbles targeted to alpha(v)beta3. Circulation. 2003;108:336–341. doi: 10.1161/01.CIR.0000080326.15367.0C. [DOI] [PubMed] [Google Scholar]
- 10.Leong-Poi H, Christiansen J, Klibanov AL, Kaul S, Lindner JR. Noninvasive assessment of angiogenesis by ultrasound and microbubbles targeted to alpha(v)-integrins. Circulation. 2003;107:455–460. doi: 10.1161/01.cir.0000044916.05919.8b. [DOI] [PubMed] [Google Scholar]
- 11.Folkman J. Tumor angiogenesis. Adv Cancer Res. 1985;43:175–203. doi: 10.1016/s0065-230x(08)60946-x. [DOI] [PubMed] [Google Scholar]
- 12.Folkman J. The role of angiogenesis in tumor growth. Semin Cancer Biol. 1992;3:65–71. [PubMed] [Google Scholar]
- 13.Folkman J. Role of angiogenesis in tumor growth and metastasis. Semin Oncol. 2002;29:15–18. doi: 10.1053/sonc.2002.37263. [DOI] [PubMed] [Google Scholar]
- 14.Folkman J. Angiogenesis in cancer, vascular, rheumatoid and other disease. Nat Med. 1995;1:27–31. doi: 10.1038/nm0195-27. [DOI] [PubMed] [Google Scholar]
- 15.Folkman J. What is the evidence that tumors are angio-genesis dependent? J Natl Cancer Inst. 1990;82:4–6. doi: 10.1093/jnci/82.1.4. [DOI] [PubMed] [Google Scholar]
- 16.Rak JW, St Croix BD, Kerbel RS. Consequences of angiogenesis for tumor progression, metastasis and cancer therapy. Anticancer Drugs. 1995;6:3–l8. doi: 10.1097/00001813-199502000-00001. [DOI] [PubMed] [Google Scholar]
- 17.Brooks PC, Clark RA, Cheresh DA. Requirement of vascular integrin alpha v beta 3 for angiogenesis. Science. 1994;264:569–571. doi: 10.1126/science.7512751. [DOI] [PubMed] [Google Scholar]
- 18.Brooks PC, Stromblad S, Klemke R, Visscher D, Sarkar FH, Cheresh DA. Antiintegrin alpha v beta 3 blocks human breast cancer growth and angiogenesis in human skin. J Clin Invest. 1995;96:1815–1822. doi: 10.1172/JCI118227. [DOI] [PMC free article] [PubMed] [Google Scholar]
- 19.Gladson CL, Cheresh DA. Glioblastoma expression of vitronectin and the alpha v beta 3 integrin. Adhesion mechanism for transformed glial cells. J Clin Invest. 1991;88:1924–1932. doi: 10.1172/JCI115516. [DOI] [PMC free article] [PubMed] [Google Scholar]
- 20.Albelda SM, Mette SA, Elder DE, Stewart R, Damjanovich L, Herlyn M, Buck CA. Integrin distribution in malignant melanoma: association of the beta 3 subunit with tumor progression. Cancer Res. 1990;50:6757–6764. [PubMed] [Google Scholar]
- 21.Stromblad S, Cheresh DA. Integrins, angiogenesis and vascular cell survival. Chem Biol. 1996;3:881–885. doi: 10.1016/s1074-5521(96)90176-3. [DOI] [PubMed] [Google Scholar]
- 22.Eliceiri BP, Cheresh DA. The role of alphav integrins during angiogenesis: Insights into potential mechanisms of action and clinical development. J Clin Invest. 1999;103:1227–1230. doi: 10.1172/JCI6869. [DOI] [PMC free article] [PubMed] [Google Scholar]
- 23.Vamer JA, Cheresh DA. Tumor angiogenesis and the role of vascular cell integrin alphavbeta3. Important Adv Oncol. 1996:69–87. [PubMed] [Google Scholar]
- 24.Brooks PC, Montgomery AM, Rosenfeld M, Reisfeld RA, Hu T, Klier G, Cheresh DA. Integrin alpha v beta 3 antagonists promote tumor regression by inducing apoptosis of angiogenic blood vessels. Cell. 1994;79:1157–1164. doi: 10.1016/0092-8674(94)90007-8. [DOI] [PubMed] [Google Scholar]
- 25.Borden MA, Longo ML. Dissolution behavior of lipid monolayer-coated, air-filled microbubbles: Effect of lipid hydro-phobic chain length. Langmuir. 2002;18:9225–9233. [Google Scholar]
- 26.Lanza GM, Wallace KD, Scott MJ, Cacheris WP, Abendschein DR, Christy DH, Sharkey AM, Miller JG, Gaffney PJ, Wickline SA. A novel site targeted ultrasonic contrast agent with broad biomedical application. Circulation. 1996;94:3334–3340. doi: 10.1161/01.cir.94.12.3334. [DOI] [PubMed] [Google Scholar]
- 27.Schumann PA, Christiansen JP, Quigley RM, McCreery TP, Sweitzer RH, Unger EC, Lindner JR, Matsunaga TO. Targeted-microbubble binding selectively to GPIIb IIIa receptors of platelet thrombi. Invest Radiol. 2002;37:587–593. doi: 10.1097/00004424-200211000-00001. [DOI] [PubMed] [Google Scholar]
- 28.Pfaff M, Tangemann K, Muller B, Gurrath M, Muller G, Kessler H, Timpl R, Engel J. Selective recognition of cyclic RGD peptides of NMR defined conformation by alpha IIb beta 3, alpha V beta 3, and alpha 5 beta 1 integrins. J Biol Chem. 1994;269:20233–20238. [PubMed] [Google Scholar]
- 29.Aumailley M, Gurrath M, Muller G, Calvete J, Timpl R, Kessler H. Arg–Gly–Asp constrained within cyclic pentapeptides. Strong and selective inhibitors of cell adhesion to vitronectin and laminin fragment P1. FEBS Lett. 1991;291:50–54. doi: 10.1016/0014-5793(91)81101-d. [DOI] [PubMed] [Google Scholar]
- 30.Haubner R, Gratias B, Diefenbach B, Goodman SL, Jonczyk A, Kessler H. Structural and functional aspects of RGD-containing cyclic pentapeptides as highly potent and selective integrin alpha(v)beta(3) antagonists. J Am Chem Soc. 1996;118:7461–7472. [Google Scholar]
- 31.Byzova TV, Kim W, Midura RJ, Plow EF. Activation of integrin alpha(V)beta(3) regulates cell adhesion and migration to bone sialoprotein. Exp Cell Res. 2000;254:299–308. doi: 10.1006/excr.1999.4765. [DOI] [PubMed] [Google Scholar]
- 32.Allman R, Cowburn P, Mason M. In vitro and in vivo effects of a cyclic peptide with affinity for the alpha(nu)beta3 integrin in human melanoma cells. Eur J Cancer. 2000;36:410–422. doi: 10.1016/s0959-8049(99)00279-8. [DOI] [PubMed] [Google Scholar]
- 33.Pampori N, Hato T, Stupack DG, Aidoudi S, Cheresh DA, Nemerow GR, Shattil SJ. Mechanisms and consequences of affinity modulation of integrin alpha(V)beta(3) detected with a novel patch-engineered monovalent ligand. J Biol Chem. 1999;274:21609–21616. doi: 10.1074/jbc.274.31.21609. [DOI] [PubMed] [Google Scholar]
- 34.Dayton P, Klibanov A, Brandenburger G, Ferrara K. Acoustic radiation force in vivo: A mechanism to assist targeting of microbubbles. Ultrasound Med Biol. 1999;25:1195–1201. doi: 10.1016/s0301-5629(99)00062-9. [DOI] [PubMed] [Google Scholar]
- 35.Lele M, Sajid M, Wajih N, Stouffer GA. Eptifibatide and 7E3, but not tirofiban, inhibit alpha(v)beta(3) integrin-mediated binding of smooth muscle cells to thrombospondin and prothrombin. Circulation. 2001;104:582–587. doi: 10.1161/hc3101.092199. [DOI] [PubMed] [Google Scholar]
- 36.Voura EB, Ramjeesingh RA, Montgomery AM, Siu CH. Involvement of integrin alpha(v)beta(3) and cell adhesion molecule L1 in transendothelial migration of melanoma cells. Mol Biol Cell. 2001;12:2699–2710. doi: 10.1091/mbc.12.9.2699. [DOI] [PMC free article] [PubMed] [Google Scholar]
- 37.Lum AF, Green CE, Lee GR, Staunton DE, Simon SI. Dynamic regulation of LFA-1 activation and neutrophil arrest on intercellular adhesion molecule 1 (ICAM-1) in shear flow. J Biol Chem. 2002;277:20660–20670. doi: 10.1074/jbc.M202223200. [DOI] [PubMed] [Google Scholar]
- 38.Marsh JN, Hall CS, Scott MJ, Fuhrhop RW, Gaffney PJ, Wickline SA, Lanza GM. Improvements in the ultrasonic contrast of targeted perfluorocarbon nanoparticles using an acoustic transmission line model. IEEE Trans Ultrason Ferroelectr Freq Control. 2002;49:29–38. doi: 10.1109/58.981381. [DOI] [PubMed] [Google Scholar]
- 39.Lindner JR, Dayton PA, Coggins MP, Ley K, Song J, Ferrara K, Kaul S. Noninvasive imaging of inflammation by ultra-sound detection of phagocytosed microbubbles. Circulation. 2000;102:531–538. doi: 10.1161/01.cir.102.5.531. [DOI] [PubMed] [Google Scholar]
- 40.Lanza GM, Trousil RL, Wallace KD, Rose JH, Hall CS, Scott MJ, Miller JG, Eisenberg PR, Gaffney PJ, Wickline SA. In vitro characterization of a novel, tissue-targeted ultrasonic contrast system with acoustic microscopy. J Acoust Soc Am. 1998;104:3665–3672. doi: 10.1121/1.423948. [DOI] [PubMed] [Google Scholar]
- 41.Hall CS, Marsh JN, Scott MJ, Gaffney PJ, Wickline SA, Lanza GM. Time evolution of enhanced ultrasonic reflection using a fibrin-targeted nanoparticulate contrast agent. J Acoust Soc Am. 2000;108:3049–3057. doi: 10.1121/1.1322566. [DOI] [PubMed] [Google Scholar]
- 42.Dayton PA, Morgan KE, Klibanov AL, Brandenburger GH, Ferrara KW. Optical and acoustical observations of the effects of ultrasound on contrast agents. IEEE Trans Ultrason Ferroelectr Freq Control. 1999;46:220–232. doi: 10.1109/58.741536. [DOI] [PubMed] [Google Scholar]
- 43.Morgan KE, Dayton PA, Kruse DE, Klibanov AL, Brandenburger GH, Ferrara KW. Changes in the echoes from ultrasonic contrast agents with imaging parameters. IEEE Trans Ultrason Ferroelectr Freq Control. 1998;45:1537–1548. doi: 10.1109/58.738293. [DOI] [PubMed] [Google Scholar]