

Abstract
We studied the dependence between voluntary motion of a finger and pressing forces produced by the tips of other fingers of the hand. Subjects moved one of the fingers (task finger) of the right hand trying to follow a cyclic, ramp-like flexion-extension template at different frequencies. The other fingers (slave fingers) were restricted from moving; their flexion forces were recorded and analyzed. Index finger motion caused the smallest force production by the slave fingers. Larger forces were produced by the neighbors of the task finger; these forces showed strong modulation over the range of motion of the task finger. The enslaved forces were higher during the flexion phase of the movement cycle as compared to the extension phase. The index of enslaving expressed in N/rad was higher when the task finger moved through the more flexed postures. The dependence of enslaving on both range and direction of task finger motion poses problems for methods of analysis of finger coordination based on an assumption of universal matrices of finger inter-dependence.
Keywords: finger, force production, enslaving, kinetics, kinematics
1. Introduction
When a person tries to move a single finger of a hand or to press with a finger, other fingers of the hand move or generate force (Kilbreath & Gandevia, 1994; Kinoshita, Murase, & Bandou, 1996; Li , Latash, & Zatsiorsky, 1998; Lang & Schieber, 2004). This phenomenon has been referred to as enslaving (Li et al. 1998; Zatsiorsky, Li, & Latash, 2000) or lack of individuation (Lang & Schieber, 2003; Schieber & Santello, 2004). Enslaving has been discussed as a consequence of both peripheral and neural factors. In particular, the presence of multi-tendon, multi-digit muscles and of passive connective tissue links between adjacent fingers can be expected to contribute to enslaving (Kilbreath & Gandevia 1994; Leijnse, Snijders, Bonte, Landsmeer, Kalker, Van Der Meulen, Sonneveld, & Hovius, 1993). In addition, projections of fingers in the primary motor cortex show substantial overlaps (Schieber & Hibbard, 1993; Schieber, 1999; Schieber & Santello, 2004) suggesting a neural contribution to enslaving. Besides, enslaving of a comparable magnitude has been documented in experiments when the subjects produced flexion forces by pressing with their proximal phalanges (Latash, Li, Danion, & Zatsiorsky, 2002a). Primary agonists of this action are intrinsic hand muscles that are digit specific. Hence, the finding supports the idea of a central neural origin of the enslaving.
Enslaving has been usually characterized using percentages of maximal forces produced by non-instructed fingers when one finger of the hand (the “task finger” or the “master finger”) was instructed to produce maximal force (maximal voluntary contraction, MVC) (Li et al. 1998; Zatsiorsky, Li, & Latash, 1998, 2000). In other studies enslaving was quantified during submaximal force production by master fingers (Latash, Scholz, Danion, & Schöner, 2001, 2002b; Scholz, Danion, Latash, & Schoner, 2002). These studies have revealed, in particular, that unintended forces show nearly linear changes with the force produced by the master finger. This finding has allowed using matrices of enslaving indices for analysis of finger coordination over a variety of tasks and force magnitudes (reviewed in Latash, Scholz, & Schöner, 2002c, 2007). Enslaving matrices have also been addressed as finger interconnection matrices and used for computational modeling of finger interaction over a variety of subject subpopulations and tasks (Zatsiorsky et al. 1998; Gao, Li, Li, Latash, & Zatsiorsky, 2003).
In some of the everyday actions, an object is grasped with only a subset of fingers, for example in the precision grip with the thumb and one of the fingers or in the tripod grip, while other fingers are free to perform movements. In such actions, intended force production by the grasping digits may lead to unintended motion of other digits of the hand, while motion of free fingers may lead to changes in the grasping force. The main purpose of the current study has been to provide quantitative estimates of enslaving between the kinematic and kinetic variables. In particular, we have been interested in the following questions: Is motion of a finger in flexion and in extension brings about symmetrical changes in forces produced by enslaved fingers? Are quantitative indices of enslaving similar over the range of flexion and extension motion of the instructed finger? To answer these questions, we quantified the unintended force production by three fingers of the hand during the instructed flexion-extension cyclic movements of the fourth finger at different frequencies. Indices of enslaving were compared over different phase intervals within the flexion-extension cycle and across different movement frequencies (different movement speeds). Answering these questions is important for modeling relations between the kinematics and kinetics during hand action with possible implications to such areas as changes in hand function with age and neurological disorder, hand rehabilitation, and prosthetics.
2. Methods
2.1. Subjects
Ten healthy right-handed volunteers (five males and five females) participated in this study. Their mean (± SD) anthropometric characteristics were: age 27.7 ± 5.5 years, weight 68.1 ± 13.1 kg, height 170 ± 8.2 cm, hand width 7.5 ± 0.9 cm, and hand length 17.5 ± 1.2 cm. The hand length was measured between the middle fingertip and the distal crease of the wrist with the hand extended, and the hand width was measured between the lateral aspect of the index and little finger metacarpophalangeal (MCP) joints. None of the subjects had a history of neurological or peripheral disorders of the hand or professional training that might affect the hand function such as playing musical instruments. All subjects gave informed consent according to the procedures approved by the Office for Research Protection of the Pennsylvania State University in compliance with the Helsinki Declaration.
2.2. Apparatus
A flat aluminum panel (Fig. 1A) was mounted vertically on a polyvinyl-chloride panel (16 × 14 × 0.9 cm). Six piezoelectric sensors (Model 208A03, Piezotronic Inc., Depew, NY) were placed on the aluminum panel, oriented in the vertical direction with the distance of 2.5 cm between the adjacent sensors. This distance was selected as comfortable and natural for the subjects and compatible with the size of the force sensors. A slot (3 × 6 cm) was located between the 3-rd and 4-th sensors. The subject’s finger tips could be comfortably placed on the sensors without making contact with each other. The aluminum panel with the sensors could be moved vertically in order to allow alignment of the slot with different fingers such that three fingers of the hand were always placed on force sensors while the remaining finger could move through the slot. The sensor location could be adjusted in the horizontal direction to accommodate the hands of different size. Cotton pads were attached on the upper surface of the sensors to increase friction and to prevent the effects of skin temperature on force measurement.
Figure 1.
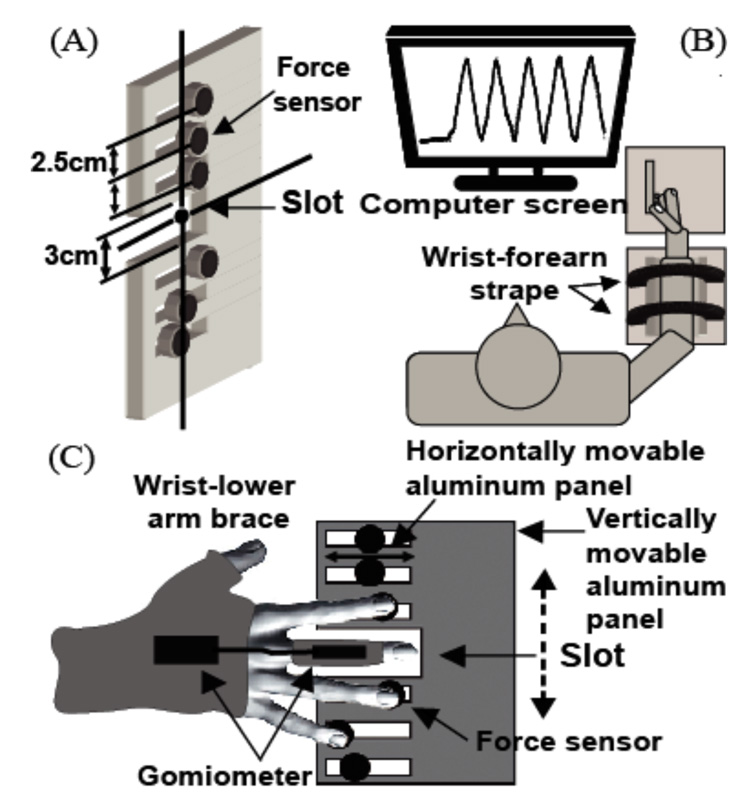
An illustration of the experimental setup. A: The vertical plate with force sensors and a slot for finger motion; B: The position of the subject and the task presentation; C: The hand positions with the brace and goniometer.
The subject’s lower arm was fixed in a forearm brace (Ebonite Inc, Daytona Beach, FL), and the wrist was locked in the hand brace (STAT, Powel, TN) both in flexion-extension and ulnar-radial deviation. This prevented wrist joint rotation. Small customized splints (made of thin wooden sticks and Velcro straps) were used to restrict movements at the interphalangeal joints of all the fingers; only MCP joint movement was allowed (See Procedure). A two-axis goniometer (SGw65, Biometrics Ltd, Ladysmith VA) was used to record motion of the MCP joint of the finger positioned against the slot in the frame (the task finger).
A 17” computer monitor was located about 0.8 m away from the subject; it was used to display the tasks and provide visual feedback on the current MCP joint angle of the task finger. The signals from the goniometer were amplified using an amplifier model LS800 (Biometrics Ltd., Ladysmith, VA), while the signals from the force sensors were amplified by AC/DC conditioners (M482M66, Piezotronics Inc., Depew, NY). Further, all the signals were digitized at 1000 Hz with a 16-bit A/D board (National instruments, Austin, TX). A Dell 450-MHz laptop computer and customized LabVIEW-based software (LabVIEW 6.1, National Instruments, Austin, TX) were used for data collection. MatLab programs (Mathworks, Natick, MA) were written for data processing and analyses.
2.3. Procedure
The subject sat on a chair facing the experimental setup. The wrist-forearm brace was affixed to the testing table in front of the subject with a set of Velcro straps. The right upper arm was abducted approximately 45° in the frontal plane and flexed 20° in the frontal plane; the elbow was at about 110° of flexion (Fig. 1B).
One rigid end of the goniometer was affixed onto the dorsal surface of the hand along the third metacarpal, using double-sided adhesive tape. The other end was attached at the level of the middle phalanx to the splint placed over the task finger. Before each trial, the subject was instructed to extend all the fingers with the thumb pointing upward. The vertical position of the aluminum panel and the horizontal position of the sensors were adjusted such that the task finger could move freely through the slot on the aluminum panel while the non-task finger tips were placed on the sensors (Fig. 1C).
The subjects were given a familiarization session to ensure that they were familiar with the setup and able to perform the tasks. During the session they got a detailed description of the procedure and were allowed to perform a few trials (not recored). During the experiment, the subject was instructed to perform cyclic flexion-extension movements of the task finger through the slot. The MCP joint angle trajectory of the task finger was shown in real time on the screen, and the task was to match the MCP trajectory with the ramp template shown on the same screen (Fig. 1B). The template consisted of a sequence of straight lines leading from 0° (corresponding to the fully extended finger position) to 45° (flexion motion) and back from 45° to 0° (extension motion) over time intervals that varied across trials. There were five 0°-to-45° lines and five 45°-to-0° lines, the lines alternated to form a cyclic task. We will use expressions “flexion segment” and “extension segment” for the flexion and extension half-cycles of the movement.
Before each trial, all force signals were zeroed. Each trial started with the computer generating a beep (get ready) and then a yellow cursor showing the current angular position of the MCP joint of the task finger started to move over the screen at a constant speed. The subject was instructed to move the task finger and match the cursor line with the template as accurately as possible. The subjects were instructed not to pay attention to possible force production by the other three fingers that rested on the sensors (non-task fingers). This instruction was used to discourage subjects from using extension efforts in non-task fingers (see also Li et al. 1998; Zatsiorsky et al. 1998, 2000).
There were four tasks corresponding to different task fingers, the index (I –Task), middle (M-Task), ring (R-Task), and little (L-Task) fingers, and seven durations of the flexion and extension segments forming the template, 3.0, 2.5, 2.0, 1.5, 1.0, 0.75, and 0.5 s. They corresponded to movement periods of 6, 5, 4, 3, 2, 1.5, and 1 s. The duration of trials was adjusted to include five successive complete cycles; it was 30, 25, 20, 15, 10, 7.5, and 5 s, respectively. Three complete cycles in the middle of the trial were always available and used for analysis to avoid possible effects of trial initiation and termination. Two trials were performed for each condition with an 8-s interval between the trials. There were 30-s intervals between conditions. The total of 56 trials were collected, two trials by four task-fingers by seven periods. All subjects were given two practice, warm-up trials prior to each task. The tasks and periods were presented in a balanced order across the subjects.
2.4 Data analysis
The force and angle data were digitally low-pass filtered with a second-order, zero-lag Butterworth filter at 25 Hz.
The task finger trajectories and force profiles produced by the non-task fingers were measured over the three cycles in the middle of each trial. Individual flexion and extension segments of the three accepted cycles were aligned by the onsets of the corresponding segment lines in the template (Fig. 2). Further, the data were averaged over ramp segments for each task. The duration of each segment was further converted to 100% to allow comparisons across different movement periods.
Figure 2.
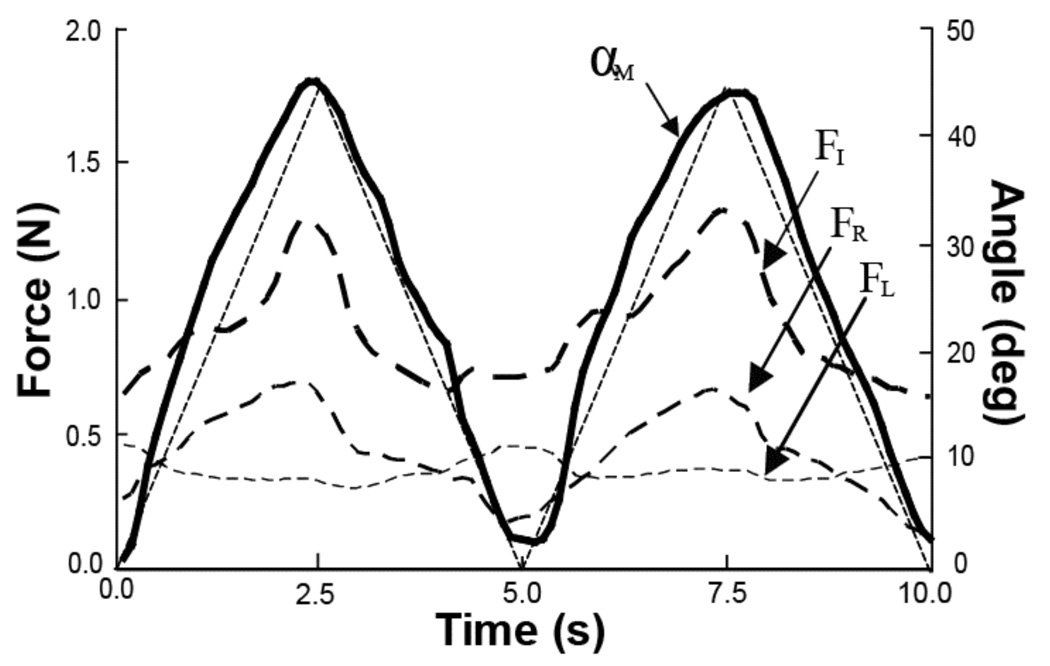
An illustration of a typical performance by a representative subject in the middle finger movement task (M-task) over two cycles with the movement period of 5 s. The angular trajectory of the task finger MCP joint is shown with a thick solid line (αM), and the forces of the non-task fingers are shown with dashed, thin and thick lines (FI, FR, and FL). The thin dashed straight line shows the template. Note the in-phase changes of FI and FR, and the task finger trajectory.
The root mean square deviation (RMS) of the angular joint trajectory from the template was used as an index of accuracy of the task performance. This index was computed separately over the middle 80% of the flexion and extension segments to avoid possible inconsistencies related to changes in the movement direction. RMS was computed over each segment and then averaged over the six accepted segments.
The unintended force production by the non-task fingers during the movement of the task finger (enslaving) was quantified using the following index:
where ΔFi indicates a change in the force of a non-task finger i, and Δαj is a change in the angular position of the task finger j (i,j = I - index, M - middle, R - ring, and L – little). Enslaving was quantified within three intervals of equal duration over the flexion and extension segments. The intervals covered the middle 80% of each segment duration. They will be referred to as FL1, FL2, and FL3 (for the flexion segment) and EX1, EX2, and EX3 (for the extension segment). The subscripts 1, 2, and 3 refer to the intervals 10 to 36%, 37 to 63%, and 64 to 90% of the corresponding segment duration. The enslaving indices (Ei,j) were also quantified at the peak flexion position when finger flexion turned into extension (PEAK) as the ratio between the total force produced by an enslaved finger and movement amplitude of the task finger.
2.5. Statistics
The data are presented in the text as means and standard errors of the mean.
ANOVAs with and without repeated measures was run for the following characteristics of performance: Accuracy of the task performance (RMS), non-task finger forces, and the index of enslaving (E). For the RMS index, the factors were Direction (two levels: flexion and extension), Period (seven levels: 1, 1.5, 2, 3, 4, 5, and 6 s), and Task-Finger (four levels: Index, Middle, Ring, and Little). Analysis of non-task finger forces involved factors Finger (typically three levels out of four: Index, Middle, Ring, and Little), Time-interval (seven levels: FL1, FL2, FL3, PEAK, EX1, EX2, and EX3). Direction, and Period. Analysis of the index of enslaving E involved factors Direction, Finger, and Time-interval.
Appropriate pair-wise contrasts and post-hoc Tukey’s Honestly Significant Difference (HSD) tests were used for further analysis of significant effects of the ANOVAs. The level of significance was set at p < 0.05.
3. Results
3.1. Movement and force patterns
Motion of the task finger led to force production by all the non-task fingers of the hand. Changes in the flexion force produced by the non-task fingers showed time profiles qualitatively similar to the trajectory of the task finger. Figure 2 shows time series of the kinematic and kinetic variables in the M-Task performed by a representative subject.
Figure 3 illustrates relations between the angular trajectory of the task finger and the total force produced by all non-task fingers together (total enslaved force). In this Figure, the M-Task is illustrated performed by a representative subject. There is a close to linear relation between the total non-task finger force and the task finger joint angle. Figure 3 illustrates an increase in the average level of the total enslaved force (thick bold line) over the three successive cycles (dotted line). For example, the third cycle (FL3 and EX3) shows the highest magnitude of force as compared to the first (FL1 and EX1) and second (FL2 and EX2) cycles. There is a dependence of the angle-force relation shown in Figure 3 on the direction of motion, but only close to the most flexed joint position (the rightmost portion of the curves). Within that joint angle range, the enslaved force was higher during flexion motion than during extension motion.
Figure 3.
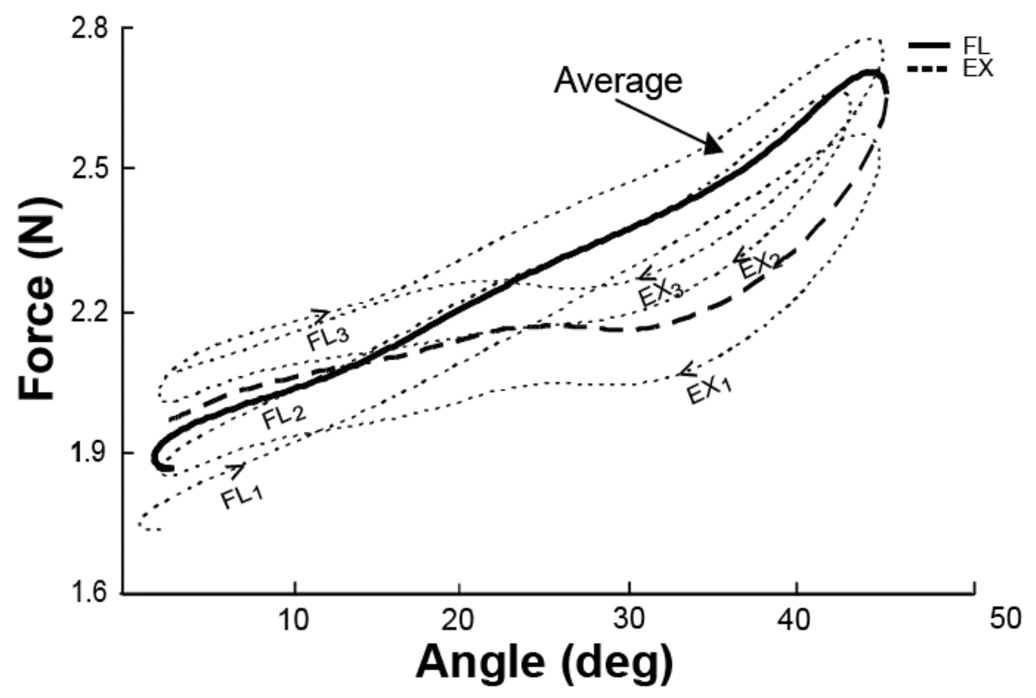
Changes in the total enslaved force with task finger motion (middle finger task) over three cycles by a representative subject. Individual cycle data are shown with dashed lines, while the average data are shown with the solid lines. Time direction is shown by arrows. The consecutive flexion and extension segments are shown with labels FL1, FL2, FL3, and EX1, EX2, and EX3 respectively. Note the lower forces produced in the extension segment as compared to the flexion segment. There was also an increase in the average force level from the first cycle to the third cycle.
3.2. Accuracy of the movement task performance
Changes in movement speed led to strong effects on kinematic variability while having little effects on enslaving. Cycle-to-cycle variability of the task finger trajectory was estimated with an index (RMS) computed with respect to the template. The RMS time profiles were close to bell-shaped for every segment of the task finger trajectory with peaks values showing a drop with an increase in the movement period. Figure 4 showed averaged across subjects data for all four tasks (subscripts I, M, R, and L correspond to the I-task, M-task, R-task, and L-task respectively). The four dependences are similar; they were fit with a 1/x function. This regression accounted, on average, for 92.7% of the variance in the data.
Figure 4.
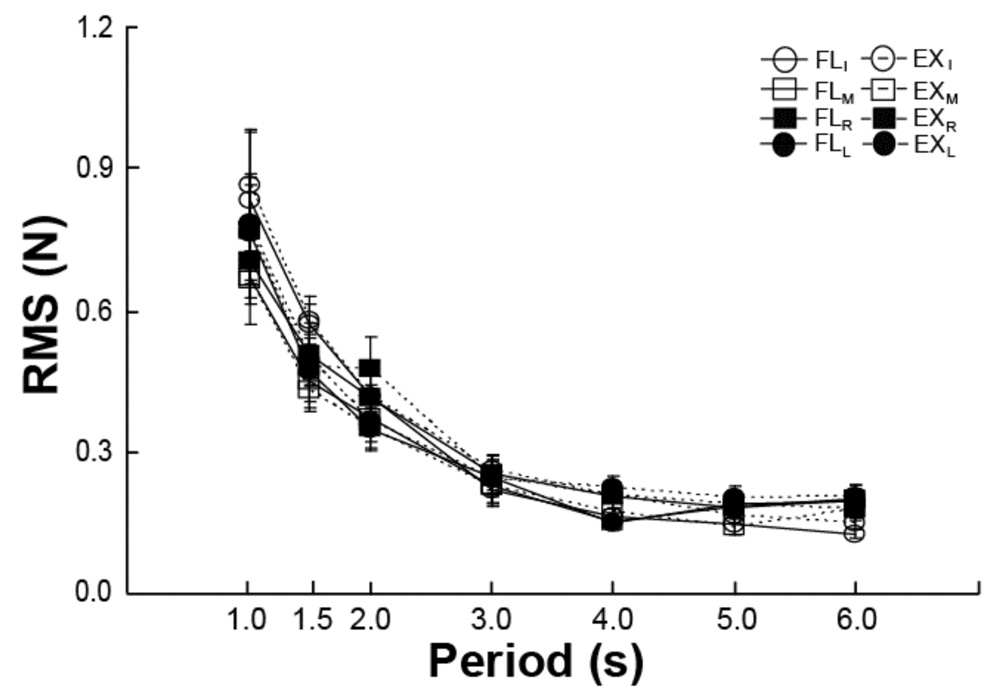
Movement accuracy (RMS) depended on the movement period but not on movement direction or the moving finger. Averaged across subjects data are shown for the four tasks and two movement directions.
Figure 4 illustrates that speeding the movement up (shorter periods) led to higher peak RMS values as compared to slower movements. This was true over all task fingers and both directions, flexion and extension. These findings were tested using repeated-measures ANOVA with three factors, Period, Task-Finger, and Direction. The ANOVA showed a significant main effects of Period (F(6,54) = 57.7; p < 0.001) without other significant effects or interactions. Tukey's HSD tests confirmed significant differences between each of the three fastest tasks and each of the three slowest tasks (p < 0.05).
3.3. Characteristics of the forces produced by the non-task fingers
The I-task was characterized by the smallest magnitudes of the enslaved force across all the time intervals. In all tasks, the most strongly enslaved finger produced force that was strongly modulated over the flexion and extension time intervals (FL1, FL2, FL3, PEAK, EX1, EX2, and EX3), while the less enslaved fingers showed no or weak force modulation. These results are illustrated in Figure 5 that shows the means and standard errors of individual finger forces of the non-task fingers averaged over the seven intervals. The most strongly enslaved fingers were M for the I- and R-tasks, I for the M-task, and R for the L-task. Note that these are close neighbors of the task finger.
Figure 5.
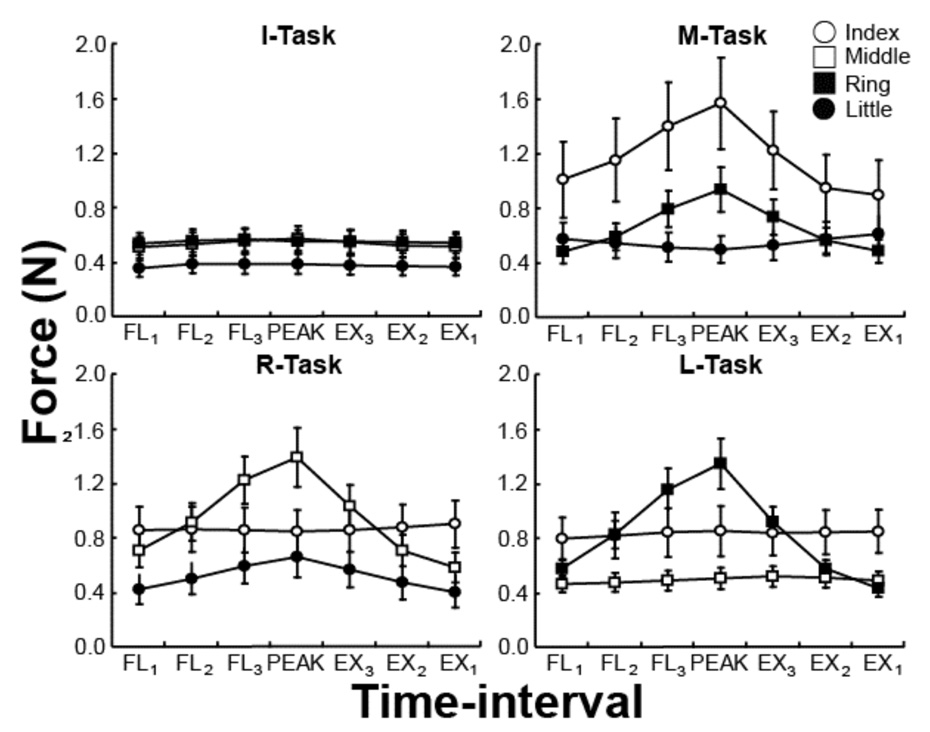
Individual finger forces of the non-task fingers averaged across subjects with standard error bars: MRL in the I-task, IRL in the M-task, IML in the R-task, and IMR in the L-task. The data are shown for each of the four tasks and all the time intervals. Note the differences in the profiles of individual finger forces. The closest neighbor tended to produce the highest force.
Repeated-measures, Finger × Time-interval ANOVAs on forces produced by individual slave fingers were run for the four tasks separately. ANOVAs showed significant effects of Finger for the M-, R, and L-tasks (F(2,18) > 6.10, p < 0.05) but was under the level of significance for the I-task (F(2,18) = 3.18, p >0.05). These results confirmed the larger enslaving of one of the neighbor fingers in each task. There were also significant effects of Time-interval for each of the four tasks (F(6,54) > 5.0, p < 0.001) confirming higher enslaving at more flexed positions of the task finger. A Finger × Time-interval interaction was also significant for all four tasks (F(12,10) > 4.2, p < 0.001). Tukey's HDS comparisons revealed that the forces produced by the neighbor fingers of the task finger were more significantly modulated across the time-intervals (p < 0.001).
Figure 6 illustrates the average enslaved force with standard error bars produced over the seven time intervals for all the tasks. The data were averaged across the four tasks and then across subjects. There was a statistically significant increase in the total enslaved force with an increase in the movement period; this increrase was modest in magnitude. The apparent drop in enslaving from the period of 5 s to 6 s was not significant. The highest enslaved forces were observed at the most flexed task finger position (PEAK). There was also a trend for the enslaved forces to be higher during the flexion joint motion (FL) as compared to the extension motion (EX).
Figure 6.
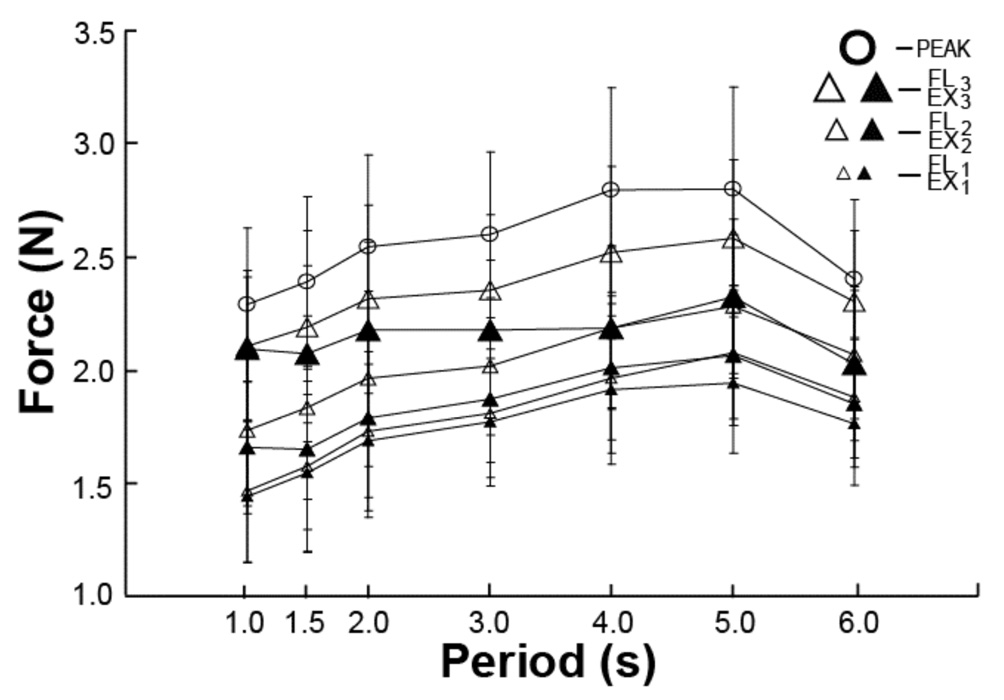
The averaged across subjects and tasks total enslaved force is shown with standard error bars. Note the trend of an increase in the total enslaved force with an increase in the movement period up to 5 s.
These findings were tested using a three-way repeated-measure ANOVA with the factors Period, Direction, and Time-interval. All three factors showed significant main effects (F(6,54) = 2.43; p<0.05, F(1,9) = 19.85; p<0.001, and F(2,18) = 17.0; p<0.001, respectively). There were also significant two-way interactions Period × Direction, Period × Time-interval, and Direction × Time-interval (F(6,54) = 6.7, p<0.001; F(12,108) = 4.38, p<0.001; and F(2,18) = 50.37, p<0.001, respectively). Pair-wise Tukey’s comparisons confirmed higher enslaved forces for flexion movement as compared to extension movement, and higher enslaved forces at time intervals corresponding to more flexed finger positions (FL3 and EX3) as compared to the other positions (FL2 and EX2; FL1 and EX1 , p < 0.05 for all comparisons).
3.4. Quantitative analysis of the enslaving
The average amount of enslaving across subjects (E, in N/rad) is presented in Table 1 for all fingers and across all tasks. The data are shown separately for the three intervals during the flexion motion, during the extension motion, and also at the most flexed position of the task finger (PEAK). Note that the E-index for the PEAK position was computed differently from other intervals and reflected “average enslaving” over the whole range of motion. The I-task showed much weaker enslaving effects on other fingers over both directions. For example, the average E for the M-, R-, and L-tasks was between 2 and 3 times larger than for the I-task.
Table 1.
Indices of Enslaving (E)
| Interval | Task | Non-task finger (N/rad) |
|||
|---|---|---|---|---|---|
| I | M | R | L | ||
| FL1 | I | – | 0.32±0.09 | 0.15±0.04 | 0.06±0.02 |
| M | 0.63±0.19 | – | 0.39±0.15 | −0.08±0.04 | |
| R | −0.01±0.07 | 0.96±0.17 | – | 0.47±0.09 | |
| L | 0.07±0.06 | 0.02±0.05 | 1.10±0.25 | – | |
| FL2 | I | – | 0.32±0.05 | 0.07±0.02 | 0.03±0.02 |
| M | 0.74±0.15 | – | 0.36±0.16 | −0.14±0.05 | |
| R | 0.01±0.05 | 0.91±0.19 | – | 0.26±0.08 | |
| L | 0.10±0.04 | 0.06±0.03 | 1.08±0.24 | – | |
| FL3 | I | – | 0.68±0.09 | 0.04±0.03 | 0.03±0.01 |
| M | 1.57±0.32 | – | 1.26±0.28 | −0.16±0.08 | |
| R | −0.06±0.05 | 1.69±0.42 | – | 0.57±0.18 | |
| L | 0.11±0.07 | 0.07±0.03 | 1.93±0.44 | – | |
| PEAK | I | – | 0.46±0.07 | 0.09±0.03 | 0.04±0.02 |
| M | 0.95±0.19 | – | 0.71±0.19 | −0.13±0.05 | |
| R | −0.02±0.04 | 1.16±0.24 | – | 0.43±0.10 | |
| L | 0.09±0.05 | 0.06±0.03 | 1.31±0.27 | – | |
| EX3 | I | – | 0.97±0.15 | 0.07±0.03 | 0.01±0.02 |
| M | 1.76±0.32 | – | 1.11±0.29 | −0.23±0.07 | |
| R | −0.08±0.06 | 1.83±0.39 | – | 0.51±0.18 | |
| L | 0.02±0.09 | −0.01±0.03 | 2.10±0.42 | – | |
| EX2 | I | – | 0.29±0.06 | 0.04±0.02 | 0.01±0.02 |
| M | 0.47±0.17 | – | 0.37±0.16 | −0.19±0.07 | |
| R | −0.09±0.05 | 0.80±0.17 | – | 0.32±0.07 | |
| L | −0.03±0.02 | 0.06±0.02 | 0.83±0.20 | ||
| EX1 | I | – | 0.08±0.04 | 0.04±0.03 | 0.05±0.02 |
| M | 0.04±0.17 | – | 0.37±0.08 | −0.12±0.06 | |
| R | −0.09±0.05 | 0.80±0.17 | – | 0.32±0.07 | |
| L | −0.02±0.02 | 0.11±0.03 | 0.51±0.18 | – | |
Averages across subjects are shown with standard errors for the four tasks (I - Index, M - Middle, R - Ring, and L - Little) and seven intervals (FL1, FL2, FL3,PEAK, EX1, EX2, and EX3).
These results are summarized in Figure 7, which shows E-indices averaged over all tasks and subjects for the seven intervals (FL1, FL2, FL3, EX3, EX2, EX1, and PEAK) separately. The largest enslaving indices were observed when the subjects were moving through the more flexed angle interval, whether into flexion or into extension (FL3 and EX3).
Figure 7.
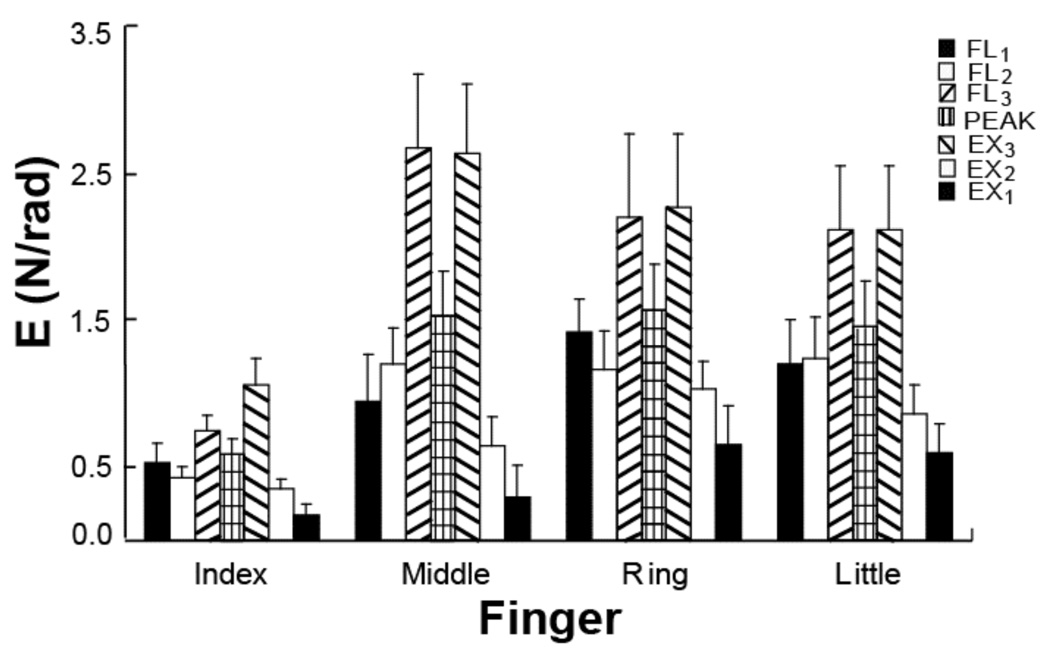
Indices of enslaving (E) averaged over all tasks and subjects for the seven intervals (FL1, FL2, FL3, EX3, EX2, EX1, and PEAK). The largest enslaving effect was observed when the subjects were moving through the most flexed finger interval (hatched bars), whether into flexion or into extension (FL3 and EX3).
The smallest enslaving was seen in the I-task, and there were no significant differences across the other three tasks. Three-way repeated-measure ANOVA with factors Time-interval, Direction, and Finger confirmed these results with significant main effects of each of the factors (F(2,18) = 27.31, p<0.001; F(1,9) = 12.41, p<0.01; and F(3,27) = 4.51, p<0.01, respectively), and a significant interaction Direction × Time-interval (F(2,18) = 6.73, p<0.01). Pair-wise Tukey’s comparisons confirmed higher E for the flexion movement as compared to the extension movement (p<0.01, also see Figure 3 and Figure 6), and higher E over the more flexed intervals (FL3 and EX3) as compared to the less flexed intervals (FL1 and EX1; and FL2 and EX2) (p<0.001).
4. Discussion
Two specific questions have been formulated in the Introduction: “Does the motion of a finger in flexion and in extension bring about symmetrical changes in forces produced by enslaved fingers?” and “Are quantitative indices of enslaving similar over the range of flexion and extension motion of the instructed finger?” Both questions received negative answers in the experiments. In particular, enslaved forces were larger when the task finger moved into flexion than when it moved into extension. These findings look opposite to those reported recently in a study of isometric tasks in children (Shim, Oliveira, Hsu, Huang, Park, & Clark, in press). However, note that the cited study by Shim and colleagues used maximal isometric force production into flexion and extension, while in our study the task finger never moved into extension beyond the straight position (0°) and no maximal exertion was required. Another important finding is that the index of enslaving was not constant over the range of finger motion; it increased towards more flexed positions. These findings were confirmed over a wide range of task finger speeds.
4.1. Central and peripheral mechanisms of finger inter-dependence
There have been arguments in favor of both peripheral and central (neural) origins of the lack of finger independence. The anatomical design of the extrinsic flexors and the presence of passive connective tissue links between fingers have been invoked as peripheral factors that potentially contribute to enslaving (Kilbreath & Gandevia, 1994; Leijnse et al., 1993). An important role of neural factors has been supported in experimental studies that showed substantial overlaps of finger projections in the primary motor cortex of primates (Schieber, 1991; Schieber & Hibbard, 1993), effects similar to enslaving observed in experiments with motor imagery (Li, Latash, & Zatsiorsky, 2004), studies of slow brain potentials (Slobounov, Johnston, Chiang, & Ray, 2002a,b), and by neural network modeling works (Goodman, Latash, Li, & Zatsiorsky, 2003; Gao et al. 2003).
Some of the observations of our study are more compatible with a dominant role of neural factors in enslaving. In particular, both muscle and connective tissues are known to have viscoelastic properties. Such connections between the task finger and other fingers (Leijnse, 1997; Leijnse, Walbeehm, Sonneveld, Hovius, & Kauer, 1997) may be expected to lead to velocity-dependence of forces transmitted to the slave fingers. In our experiments, such dependence was not observed (Figure 6). The indirect observation tentatively points at another important factor that defines the magnitude of enslaving effects, likely a factor at the level of neural signals to muscles and muscle compartments serving different fingers.
Data in Figure 3 suggest a hysteresis-like effect. Such curves usually manifest viscous properties of the system, which seem to contradict a conclusion drawn in the previous paragraph that the system does not show viscous properties (see Zatsiorsky, 1997). However, this contradiction is seeming since Figure 3 shows dependences between motion of one finger and forces produced by the remaining fingers of the hand.
4.2. Differences among the fingers
In line with a number of earlier reports (Kinoshita et al., 1996; Li et al., 1998; Zatsiorsky et al., 2000; Lang & Schieber, 2004), action by the index finger was associated with the lowest indices of enslaving (Table 1 and Figure 6 and Figure 7). In addition, motion of this finger was associated with the smallest modulation of the enslaved force. This may be causally related to the well documented better independent action of the index finger across a variety of tasks (Hager-Ross & Schieber, 2000; Reilly & Hammond, 2000; Zatsiorsky et al., 2000; Shinohara, Latash, & Zatsiorsky, 2003; Lang & Schieber, 2004).
The highest indices of enslaving were observed in the neighboring fingers corroborating the so-called proximity hypothesis (Zatsiorsky et al., 2000). According to this hypothesis, the strongest lack of individuation is observed in immediate neighbors of a task finger. We would also like to note that in our experiments the immediate neighbors were much more likely to show substantial modulation of the enslaved force over the range of motion of the task finger.
Variations in the amount of enslaving across conditions apparently had no major effect on the ability of the subjects to perform the explicit kinematic task accurately. At least, changes in the speed of movement were associated with substantial changes in the index of kinematic accuracy (Figure 4) while there were no comparable changes in enslaved forces (Figure 6). In contrast, enslaving effects differed significantly across task fingers while the index of kinematic variability did not (Figure 4 and Figure 5).
4.3. Implications for studies of multi-digit coordination
The results of this study have potential implication for studies of finger coordination. In particular, the phenomenon of enslaving has frequently been assumed to lead to positive co-variation among finger forces independently of the task. This assumption has been based on observations of close to linear changes in finger forces in one-finger tasks during both maximal (Li et al., 1998) and submaximal force production (Latash et al., 2001). This assumption has led to analysis of finger coordination using a different set of variables, finger modes that are assumed to be manipulated by the central nervous system independently of each other (Danion et al., 2003b).
A number of studies used the method of uncontrolled manifold (UCM) analysis (Scholz & Schöner, 1999; reviewed in Latash et al., 2002c) in the space of finger modes to discover and quantify multi-finger synergies stabilizing such variables as the total force and the total moment of force (Scholz et al., 2002; Zhang, Zatsiorsky, & Latash, 2006). This analysis assumes that the controller organizes in the space of finger modes sub-spaces (UCMs) corresponding to desired magnitudes of potentially important performance variables and then allows relatively large variability across trials to these sub-spaces while restricting variability orthogonal to these sub-spaces.
Our current results cast doubt on the assumption that finger modes corresponding to linear dependences among finger forces can indeed be used over a range of dynamic tasks, i.e. the tasks involving not only force production but also finger movements, since enslaving seems to be both range and direction of motion dependent. Interaction among the fingers seems to be much more complex and less linear (Goodman, Latash, & Zatsiorsky, 2004) than it has been commonly assumed. In particular, some of the differences described for indices of multi-finger synergies during flexion force increase and decrease (Shim, Olafsdottir, Zatsiorsky, & Latash, 2005) as well as over different force ranges (Shim, Park, Zatsiorsky, & Latash, 2006) may be due to the differences in the enslaving effects demonstrated in the current study. Studies of multi-digit synergies involving fast movements and force production should consider the complex relations between indices of finger inter-dependence and action characteristics.
Acknowledgements
This study was supported in part by NIH grants AG-018751, AR-048563, and NS-35032.
Footnotes
Publisher's Disclaimer: This is a PDF file of an unedited manuscript that has been accepted for publication. As a service to our customers we are providing this early version of the manuscript. The manuscript will undergo copyediting, typesetting, and review of the resulting proof before it is published in its final citable form. Please note that during the production process errors may be discovered which could affect the content, and all legal disclaimers that apply to the journal pertain.
PsycINFO classification: 2330
References
- Danion F, Latash ML, Li S. Finger interactions studied with transcranial magnetic stimulation during multi-finger force production tasks. Clinical Neurophysiology. 2003a;114:1445–1455. doi: 10.1016/s1388-2457(03)00105-6. [DOI] [PubMed] [Google Scholar]
- Danion F, Schöner G, Latash ML, Li S, Scholz JP, Zatsiorsky VM. A force mode hypothesis for finger interaction during multi-finger force production tasks. Biological Cybernetics. 2003b;88:91–98. doi: 10.1007/s00422-002-0336-z. [DOI] [PubMed] [Google Scholar]
- Gao F, Li S, Li ZM, Latash ML, Zatsiorsky VM. Matrix analyses of interaction among fingers in static force production tasks. Biological Cybernetics. 2003;89:407–414. doi: 10.1007/s00422-003-0420-z. [DOI] [PubMed] [Google Scholar]
- Goodman SR, Latash ML, Li S, Zatsiorsky VM. Analysis of a network for finger interaction during two-hand multi-finger force production tasks. Journal of Applied Biomechanics. 2003;19:295–309. [Google Scholar]
- Goodman SR, Latash ML, Zatsiorsky VM. Indices of non-linearity in finger force interaction. Biological Cybernetics. 2004;90:264–271. doi: 10.1007/s00422-004-0466-6. [DOI] [PubMed] [Google Scholar]
- Häger-Ross C, Schieber MH. Quantifying the independence of human finger movement: comparisons if digits, hands, and movement frequencies. Journal of Neuroscience. 2000;22:8542–8550. doi: 10.1523/JNEUROSCI.20-22-08542.2000. [DOI] [PMC free article] [PubMed] [Google Scholar]
- Kilbreath SL, Gandevia SC. Limited independent flexion of the thumb and fingers in human subjects. Journal of Physiology. 1994;479:487–497. doi: 10.1113/jphysiol.1994.sp020312. [DOI] [PMC free article] [PubMed] [Google Scholar]
- Kinoshita H, Murase T, Bandou T. Grip posture and forces during holding cylindrical objects with circular grips. Ergonomics. 1996;39:1163–1176. doi: 10.1080/00140139608964536. [DOI] [PubMed] [Google Scholar]
- Lang CE, Schieber MH. Reduced muscle selectivity during individuated finger movements in humans after damage to the motor cortex or corticospinal tract. Jounal of Neurophysiology. 2003;91:1722–1733. doi: 10.1152/jn.00805.2003. [DOI] [PubMed] [Google Scholar]
- Lang CE, Schieber MH. Human finger independence: limitations due to passive mechanical coupling versus active neuromuscular control. Jounal of Neurophysiology. 2004;92:2802–2810. doi: 10.1152/jn.00480.2004. [DOI] [PubMed] [Google Scholar]
- Latash ML, Scholz JF, Danion F, Schöner G. Structure of motor variability in marginally redundant multi-finger force production tasks. Experimental Brain Research. 2001;141:153–165. doi: 10.1007/s002210100861. [DOI] [PubMed] [Google Scholar]
- Latash ML, Li S, Danion F, Zatsiorsky VM. Central mechanisms of finger interaction during one- and two-hand force production at distal and proximal phalanges. Brain Research. 2002a;924:198–208. doi: 10.1016/s0006-8993(01)03234-6. [DOI] [PubMed] [Google Scholar]
- Latash ML, Scholz JF, Danion F, Schöner G. Finger coordination during discrete and oscillatory force production tasks. Experimental Brain Research. 2002b;146:419–432. doi: 10.1007/s00221-002-1196-4. [DOI] [PubMed] [Google Scholar]
- Latash ML, Scholz JP, Schöner G. Motor control strategies revealed in the structure of motor variability. Exercise and Sport Science Reviews. 2002c;30:26–31. doi: 10.1097/00003677-200201000-00006. [DOI] [PubMed] [Google Scholar]
- Latash ML, Scholz JP, Schöner G. Toward a new theory of motor synergies. Motor Control. 2007;11:275–307. doi: 10.1123/mcj.11.3.276. [DOI] [PubMed] [Google Scholar]
- Li S, Latash ML, Zatsiorsky VM. Effects of motor imagery on finger force responses to transcranial magnetic stimulation. Cognitive Brain Research. 2004;20:273–280. doi: 10.1016/j.cogbrainres.2004.03.003. [DOI] [PubMed] [Google Scholar]
- Li ZM, Latash ML, Zatsiorsky VM. Force sharing among finger as a model of the redundancy problem. Experimental Brain Research. 1998;119:276–286. doi: 10.1007/s002210050343. [DOI] [PubMed] [Google Scholar]
- Li ZM, Dun S, Harkness DA, Brininger TL. Motion enslaving among multiple fingers of human hand. Motor Control. 2004;8:1–15. doi: 10.1123/mcj.8.1.1. [DOI] [PubMed] [Google Scholar]
- Leijnse JN. Measuring anatomic connections in the deep flexor of the musician's hand: theoretical analysis, clinical examples. Journal of Biomechanics. 1997;30:873–882. doi: 10.1016/s0021-9290(97)00045-6. [DOI] [PubMed] [Google Scholar]
- Leijnse JN, Snijders CJ, Bonte JE, Landsmeer JM, Kalker JJ, Van Der Meulen JC, Sonneveld GJ, Hovius SE. The hand of the musician: the kinematics of the bidigital finger system with anatomical restrictions. Journal of Biomechanics. 1993;10:1169–1179. doi: 10.1016/0021-9290(93)90065-m. [DOI] [PubMed] [Google Scholar]
- Leijnse JN, Walbeehm ET, Sonneveld GJ, Hovius SE, Kauer JM. Connections between the tendons of the musculus flexor digitorum profundus involving the synovial sheaths in the carpal tunnel. Acta Anatomica (Basel) 1997;160:112–122. doi: 10.1159/000148003. [DOI] [PubMed] [Google Scholar]
- Reilly KT, Hammond GR. Independence of force production by digits of the human hand. Neuroscience Letters. 2000;290:53–56. doi: 10.1016/s0304-3940(00)01328-8. [DOI] [PubMed] [Google Scholar]
- Schieber MH. Individuated finger movements of rhesus monkeys: a means of quantifying the independence of the digits. Jounal of Neurophysiology. 1991;65:1381–1391. doi: 10.1152/jn.1991.65.6.1381. [DOI] [PubMed] [Google Scholar]
- Schieber MH. Somatotopic gradients in the distributed organization of the human primary motor cortex hand area: evidence from small infarcts. Experimental Brain Research. 1999;128:139–148. doi: 10.1007/s002210050829. [DOI] [PubMed] [Google Scholar]
- Schieber MH, Hibbard LS. How somatotopic is the motor cortex hand area? Science. 1993;261:489–492. doi: 10.1126/science.8332915. [DOI] [PubMed] [Google Scholar]
- Schieber MH, Santello M. Hand function: peripheral and central constraints on performance. J Appl Physiol. 2004;96:2293–2300. doi: 10.1152/japplphysiol.01063.2003. [DOI] [PubMed] [Google Scholar]
- Scholz JP, Danion F, Latash ML, Schöner G. Understanding finger coordination through analysis of the structure of force variability. Biological Cybernetics. 2002;86:29–39. doi: 10.1007/s004220100279. [DOI] [PubMed] [Google Scholar]
- Scholz JP, Schöner G. The uncontrolled manifold concept: Identifying control variables for a functional task. Experimental Brain Research. 1999;126:289–306. doi: 10.1007/s002210050738. [DOI] [PubMed] [Google Scholar]
- Shim JK, Latash ML, Zatsiorsky VM. The human central nervous system need time to organize task-specific covariation of finger forces. Neuroscience Letters. 2003;35:372–374. doi: 10.1016/j.neulet.2003.08.079. [DOI] [PubMed] [Google Scholar]
- Shim JK, Latash ML, Zatsiorsky VM. Finger coordination during moment production on a mechanically fixed object. Experimental Brain Research. 2004;157:457–467. doi: 10.1007/s00221-004-1859-4. [DOI] [PMC free article] [PubMed] [Google Scholar]
- Shim JK, Olafsdottir H, Zatsiorsky VM, Latash ML. The emergence and disappearance of multi-digit synergies during force production tasks. Experimental Brain Research. 2005;164:260–270. doi: 10.1007/s00221-005-2248-3. [DOI] [PMC free article] [PubMed] [Google Scholar]
- Shim JK, Oliveira MA, Hsu J, Huang J, Park J, Clark JE. Hand digit control in children: Age-related changes in hand digit force interactions during maximum flexion and extension force production tasks. Experimental Brain Research. 2007 doi: 10.1007/s00221-006-0629-x. in press. [DOI] [PubMed] [Google Scholar]
- Shim JK, Park J, Zatsiorsky VM, Latash ML. Adjustments of prehension synergies in response to self-triggered and experimenter-triggered load and torque perturbations. Experimental Brain Research. 2006;175:641–653. doi: 10.1007/s00221-006-0583-7. [DOI] [PMC free article] [PubMed] [Google Scholar]
- Shinohara M, Latash ML, Zatsiorsky VM. Age effects on force production by the intrinsic and extrinsic hand muscles and finger interaction during maximal contraction tasks. Journal of Applie Physiology. 2003;95:1361–1369. doi: 10.1152/japplphysiol.00070.2003. [DOI] [PubMed] [Google Scholar]
- Slobounov S, Johnston J, Chiang H, Ray WJ. Motor-related cortical potentials accompanying enslaving effect in single versus combination of fingers force production tasks. Clinical Neurophysiology. 2002a;113:1444–1453. doi: 10.1016/s1388-2457(02)00195-5. [DOI] [PubMed] [Google Scholar]
- Slobounov S, Johnston J, Chiang H, Ray WJ. The role of submaximal force production in the enslaving phenomenon. Brain Research. 2002b;954:212–219. doi: 10.1016/s0006-8993(02)03288-2. [DOI] [PubMed] [Google Scholar]
- Zatsiorsky VM. On muscle and joint viscosity. Motor Control. 1997;1:299–309. [Google Scholar]
- Zatsiorsky VM, Li ZM, Latash ML. Coordinated force production in multi-finger tasks: Finger interaction and neural network modeling. Biological Cybernetics. 1998;79:139–150. doi: 10.1007/s004220050466. [DOI] [PubMed] [Google Scholar]
- Zatsiorsky VM, Li ZM, Latash ML. Enslaving effects in multi-finger force production. Experimental Brain Research. 2000;131:187–195. doi: 10.1007/s002219900261. [DOI] [PubMed] [Google Scholar]
- Zhang W, Zatsiorsky VM, Latash ML. Accurate production of time-varying patterns of the moment of force in multi-finger tasks. Experimental Brain Research. 2006;175:68–82. doi: 10.1007/s00221-006-0521-8. [DOI] [PMC free article] [PubMed] [Google Scholar]