

Abstract
Rationale and Objectives
Needle biopsy is currently the only way to confirm prostate cancer. To increase prostate cancer diagnostic rate, needles are expected to be deployed at suspicious cancer locations. High contrast MR imaging provides a powerful tool for detecting suspicious cancerous tissues. To do this, MR appearances of cancerous tissue should be characterized and learned from a sufficient number of prostate MR images with known cancer information. However, ground-truth cancer information is only available in histological images. Therefore, it is necessary to warp ground-truth cancerous regions in histological images to MR images by a registration procedure. The objective of this paper is to develop a registration technique for aligning histological and MR images of the same prostate.
Material and Methods
Five pairs of histological and T2-weighted MR images of radical prostatectomy specimens are collected. For each pair, registration is guided by two sets of correspondences that can be reliably established on prostate boundaries and internal salient blob-like structures of histological and MR images.
Results
Our developed registration method can accurately register histological and MR images. It yields results comparable to manual registration, in terms of landmark distance and volume overlap. It also outperforms both affine registration and boundary-guided registration methods.
Conclusions
We have developed a novel method for deformable registration of histological and MR images of the same prostate. Besides the collection of ground-truth cancer information in MR images, the method has other potential applications. An automatic, accurate registration of histological and MR images actually builds a bridge between in vivo anatomical information and ex vivo pathological information, which is valuable for various clinical studies.
Index Terms: Prostate cancer, Histological image, MR image, Biopsy, Deformable registration
1. Introduction
Prostate cancer is classified as an adenocarcinoma, or glandular cancer, that begins when normal semen-secreting prostate gland cells mutate into cancer cells. Pathological analysis shows the regular glands of the normal prostate are replaced by irregular glands and clumps of cells for prostate cancer [1]. From the radiologists’ perspective, the variations at the cell level lead to changes of signal intensity in in vivo medical images, e.g., magnetic resonance (MR) and ultrasound images. Since MR images provide better contrast between prostate cancer and normal tissue in the peripheral zone [2, 3], some researchers proposed to use endorectal or whole body coil MR images for image-based prostate cancer identification [2, 3]. Recently, with the progress of pattern recognition theory, some algorithms [4, 5] have been designed to automatically identify cancerous tissue using image features extracted from MR images.
In our study towards the early diagnosis of prostate cancer, we proposed a computer-aided biopsy system, which aims to increase the diagnosis accuracy of prostate biopsy using population-based statistical information [6] as well as patient-specific image information. As shown in Fig. 1, our proposed biopsy system consists of three modules, respectively for image-based biopsy optimization, atlas-based biopsy optimization, and integration and application of optimized biopsy strategies. In the atlas-based biopsy optimization module, biopsy needles are deployed at the locations where the statistical atlas of prostate cancer distribution exhibits higher cancer incidence. In the image-based biopsy optimization module, biopsy needles are deployed at the locations where the tissue appearances are similar to those of cancerous tissue. To achieve this objective, an automatic image analysis method is expected for labeling the suspicious cancerous tissue by learning the MR signatures of cancerous tissue from a sufficient number of prostate MR image samples where ground-truth cancer has been identified. However, since the ground-truth cancer information is only available in the histological images, it is necessary to warp the confirmed cancerous regions in histological images to MR images, in order to collect ground-truth cancer information in MR images. Fig. 2 shows an example of warping a ground-truth cancerous region from the histological image to the MR image of the same prostate. The dark pink region in Fig. 2(a) indicates ground-truth cancerous region in the histological image, and the green region in Fig. 2(c) denotes the warped ground-truth cancerous region in the MR image.
Figure 1.

Schematic description of our proposed computer-aided biopsy system. ➀ Generate optimal biopsy strategy based on patient-specific image information. ➁ Generate optimal biopsy strategy based on population-based statistical information. ➂ Integrate the two biopsy strategies and apply them to an individual patient.
Figure 2.

An example of warping a ground-truth cancerous region from the histological image to the MR image of the same prostate. (a) Prostate histological image, where the dark pink region denotes ground-truth cancer labeled by a pathologist. (b) Prostate T2-weighted MR image. (c) Prostate T2-weighted MR image with manually warped cancer ground truth as indicated by a green region.
Currently, the warping of ground-truth cancerous regions is generally accomplished by human experts, i.e., manually labeling cancerous regions in MR images by referring to cancer locations in the corresponding histological images [4, 7]. However, this process is very tedious and time-consuming, particularly for labeling a large number of samples. Also, manual labeling is often irreproducible and thus subject to inter-rater and intra-rater inconsistency. Therefore, in this paper, we propose a method to register histological images with MR images of the same prostate. It is worth noting that the application of this method is far beyond the collection of ground-truth cancer information, since an accurate co-registration of prostate histological and MR images actually builds a bridge between in vivo anatomical information and ex vivo pathological information, which is valuable for various clinical applications [8, 9].
Considering various distortion and cutting artifacts in histological images and also fundamentally different nature of histological and MR images, our registration method is guided by the common features that can be reliably identified in both histological and MR images, i.e., two types of automatically identified landmarks locating on prostate boundaries and salient internal anatomical regions, which are simply named as boundary landmarks and internal landmarks, respectively, in this paper. Importantly, by using the internal landmarks commonly available in both histological and MR images, the registration of anatomical structures inside the prostate can be successfully completed, since the selected internal landmarks provide salient regional information to establish correct correspondences within the prostate capsule. Given the definitions of the similarities between boundary landmarks and between internal landmarks, an overall similarity function is proposed to integrate the similarities between automatically detected corresponding landmarks and the smoothness constraints on the transformation between histological and MR images. By optimizing this overall similarity function, the correspondences between selected landmarks as well as the transformation between histological and MR images can be simultaneously obtained.
It is worth to noting that our registration framework is similar as [10], which aims to non-rigidly match landmarks based on their spatial relations. However, besides the spatial information, we incorporate the geometric and image characteristics of landmarks into the registration framework, which facilitates the accurate registration of prostate histological and MR images.
The remainder of this paper is organized as follows. In Section 2, the previous studies on the registration of histological and MR images are briefly reviewed. In Section 3, the details of our registration method are described. Afterwards, a set of experiments are presented in Section 4 to validate the accuracy of our proposed registration method, and to demonstrate its applications in warping ground-truth cancerous regions to MR images. The conclusion and future direction of this study is provided in Section 5.
2. Related Work
In the recent two decades, medical image registration has become a hot research area, with various applications in longitudinal study [11, 12], population-based disease study [13], image information fusion [14], and image guided intervention [15]. Multimodality registration is one of the most interesting topics, since it paves the way to construct a comprehensive understanding of anatomical or pathological structure by integrating information gained from different imaging modalities. However, although multimodality image registration methods have been extensively investigated [16–18], the studies dealing with the registration of histological images are very limited, probably due to the more complicated and diverse nature of histological images. Among the limited number of works, Taylor et al [19] proposed a method to register a set of whole mount prostate histological images with 3D B-mode ultrasound images. In this method, manually outlined prostate surfaces in both histological images and ultrasound images are aligned using a 3-D correlation algorithm. The correspondences established on prostate surfaces are further propagated to the interior of prostate glands for comparing the sizes and the spatial locations of tumors identified in histological data and 3D ultrasound images. Jacobs et al [20] proposed a method for the co-registration and warping of magnetic resonance images (MRI) to histological sections. This method consists of a modified surface-based registration algorithm followed by an automated warping approach using nonlinear thin plate splines to compensate for the distortions between the data sets. In the registration method proposed by Schormann et al [21], the brain histological volume is firstly reconstructed by aligning a set of histological slices. Then, the reconstructed histological volume is transformed to the MR image space using a principal axes transformation. In order to account for differences in the morphology of individuals, a fast full multigrid method is used to determine 3D nonlinear deformation. In [22], d’Aische et al proposed an algorithm to capture non-rigid transformation between digital images of histological slides and digital flat-bed scanned images of cryotomed sections of the larynx. This method measures image similarity using a mutual information criterion, and avoids spurious deformations due to noise by constraining the estimated deformation field with a linear elastic regularization term. In Wachowiak et al’s work [18], the abdominal histological sections are registered with ultrasound images using a swarm optimization method. This work mainly focuses on the optimization method for multimodality registration, while the similarity between histological sections and ultrasound images is defined by normalized mutual information. Bardinet et al [23] proposed to co-register the histological, optical, and MR data of the human brain simultaneously by using mutual information. In their work, a reference volume constructed from photographs of the frozen brain is used to align each histological section and further register the histological volume with post mortem MR image.
The aforementioned methods can be categorized into two classes. The first class of methods focuses on registering the boundaries of anatomical structures [19, 20]. For these methods, although organ contours can be perfectly aligned, it is not guaranteed that internal structures are also accurately registered. The second class of methods focuses on registering images by maximizing the overall similarity of two images, such as using mutual information [18, 21–23]. These registration methods use the image information from the interior of the anatomical structures. However, they might be misled by various distortions and cutting artifacts in the histological images, since patches with low structural content often lead to morphologically inconsistent local registrations [24].
3. Methods
In order to overcome the limitations of the previous methods, we propose to register prostate histological and MR images using two types of automatically identified landmarks, which locate on prostate boundaries and salient internal anatomical regions, respectively. These two kinds of landmarks are named as boundary landmarks and internal landmarks, respectively, in the remainder of this paper. Compared to the first class of previous methods [19, 20], which are only guided by the aligned boundaries of anatomical structures, our method is able to successfully register the anatomical structures inside the prostate, by using the detected blob-like internal landmarks commonly available in both histological and MR images. On the other hand, the limitation of the second class of previous methods [18, 21, 22], i.e., mis-registration due to distortion and cutting artifacts of histological images, can be potentially avoided as the local patches around detected landmarks have salient structure information for correspondence matching. Considering the different properties of the two types of landmarks, the similarity between boundary landmarks is defined by geometric features, while the similarity between internal landmarks is defined as local normalized mutual information. By optimizing an overall similarity function that integrates the similarities between landmarks and the smoothness constraints on the estimated transformation between histological and MR images, the correspondences between the landmarks and importantly the dense transformation between histological and MR images can be simultaneously obtained.
In the remainder of this section, sections 3.1 and 3.2 will describe the detection and the similarity definition of boundary landmarks and internal landmarks, respectively. The overall similarity function that integrates the similarities between landmarks and the spatial constraints on transformations will be presented in Section 3.3.
3.1 Boundary Landmarks
Boundary landmarks detection
Since the organ boundaries are usually important for registration, the points located on the prostate boundaries are selected as the first type of landmarks to be used for helping register histological and MR images. In our study, the prostate capsules are first segmented from histological and MR images. Then, a triangular mesh surface is generated for each prostate boundary using a marching cubes algorithm [25], with the vertices of the surface selected as the boundary landmarks.
Similarity definition of boundary landmarks
As each boundary landmark is actually a vertex of the surface, its spatial relations with vertices in the neighborhood can be used to describe the geometric properties around the boundary landmark. In particular, an affine-invariant attribute vector [26] is used to characterize the geometric anatomy around each boundary landmark. Assuming xi is a boundary landmark under study, its geometric attribute is defined as the volume of the tetrahedron formed by xi and its neighboring vertices (c.f. Fig. 3). While the volume of the tetrahedron formed by the immediate neighbors reflects local shape information, the volumes of the tetrahedrons formed by the 2nd or higher level neighbors represent more global geometric properties around xi For each boundary landmark xi, the volumes calculated from different neighborhood layers are stacked into an attribute vector F(xi), which characterizes the geometric features of xi from a local to a global fashion. F(xi) can be further made affine-invariant as F̄(xi), by normalizing it across the whole surface [26]. By using this attribute vector, the similarity between two boundary landmarks xi and yj, respectively in histological and MR images, can be defined by an Euclidean distance between their normalized attribute vectors [26], i.e.,
Figure 3.

Geometric attributes of a boundary landmark. For a boundary landmark xi, its geometric attributes are defined by the volumes of the tetrahedrons formed by vertices xi and its neighbors nbrl,0(xi), nbrl,m1(xi), and nbrl,m2(xi). Here, m1 = ⌊SIl(xi)/3⌋ and m2 = ⌊SIl(xi)×2/3⌋, (⌊·⌋ defines the floor function) where SIl(xi) is the number of vertices contained by l-th neighborhood layer of xi
| (1) |
3.2 Internal Landmarks
Compared to the boundary landmarks, it is relatively difficult to define the landmarks within the prostate capsules, since the same anatomical structures might have different appearances or shapes in the histological and MR images. In our study, inspired by the fact that clinicians usually register histological and MR images by matching the internal blob-like structures (c.f. Fig. 4), i.e., gland tissues containing fluid, these blob-like structures which are commonly available in both histological and MR images are used as the second type of landmarks, i.e., internal landmarks, to guide the image registration.
Figure 4.

Corresponding blob-like structures in prostate histological and MR images. (a) Prostate histological image. (b) Prostate MR images. Red arrows point to the corresponding blob-like structures commonly available in histological and MR images.
There are two major challenges in detecting internal landmarks, i.e., detecting blob-like structures from histological and MR images. First, the sizes of blob-like structures are highly variable within prostate images. According to scale-space theory [27], local structures only exist as meaningful entities over a certain range of scale. Therefore, the selection of appropriate scales to detect blobs of different sizes becomes a challenging problem. Second, due to the enlargement or shrinkage of gland tissues during the cutting procedure, the size of the same blob can be different in histological and MR images. Toward the establishment of correct correspondences between internal landmarks, it is necessary to define a scale invariant similarity metric according to the sizes of blob-like structures. Therefore, besides the spatial location, the size of blob-like structure plays an important role for the detection and matching of internal landmarks.
Accordingly, we employ a scale-space analysis method to simultaneously detect the spatial locations and the sizes of salient blob-like structures in histological and MR images. Using the automatically detected size information, a scale-invariant metric is thus defined to evaluate the similarity between corresponding internal landmarks.
In the remainder of this section, we will first introduce Lindeberg’s work [28], which aims to detect salient image features with automatic scale selection. This work is regarded as the theoretical foundation of our proposed method. Afterwards, the detection of internal landmarks and the definition of the similarity between internal landmarks will be introduced one by one.
Salient structure detection with automatic scale selection
As argued before, objects in the world appear in different ways depending on the scale of observation. However, the selection of appropriate scale to detect salient structure is not a trivial problem, since raw image data usually doesn’t contain explicit information about what image structures should be regarded as salient or what scales are appropriate for treating “salient” structures. In [28], Lindeberg proposed a systematic framework to detect salient features with automatic appropriate scale selection by studying the evolution properties over scales of normalized differential descriptors.
In this systematic framework, the scale-space representation is firstly constructed by convoluting the original signal (or image) with Gaussian functions of different sizes. Given a 3D image f(x, y, z), its scale-space can be represented as:
| (2) |
where . Gaussian function is selected here as a convolution kernel, since it is stated as the unique kernel for generating a scale-space within the class of linear transformations [29–31].
In analogy with the common fact that a maximal response of differential descriptors over the spatial space usually indicates the spatial location of a salient structure, a maximal response over scale space indicates the scale at which the local structure is most salient. To make the response of differential descriptors scale invariant, Lindeberg [28] proposed a normalized derivative operator as defined next,
| (3) |
This normalized derivative operator can be applied to construct any differential descriptor. For instance, using this normalized derivative operator, the normalized gradient of L(x, y, z; s) is calculated as,
| (4) |
By using a scale compensation factor s, the normalized gradient becomes scale invariant, which facilitates the comparison of gradients calculated from different scales.
Following this principle, the detection of salient local structure with automatic scale selection can be accomplished by searching for local peak responses of a specific differential descriptor over scale space. In this way, the spatial location as well as the scale of the salient local structure can be simultaneously obtained.
Internal landmarks detection
Based on Lindeberg’s systematic framework [28], we propose a method to detect the spatial locations and the sizes of blob-like structures, which are considered as the internal landmarks to guide the registration of prostate histological and MR images in this study. As shown in Fig. 5, our method consists of three steps. First, a scale-space representation is constructed for a 3D histological or MR image according to Equation (2). Second, the Laplacian of this scale-space function L(x, y, z; s) is calculated. In particular, by following the idea of normalized differential descriptors [28] described above, we calculate the normalized Laplacian, defined as , for scale-invariant comparison. Finally, the local peak responses of Laplacian over scale space are considered as the candidates of salient blob-like structures, with the corresponding locations and scales indicating the locations as well as the sizes of these blob-like structures. The detailed relationship between normalized Laplacian responses and the properties of blob-like structures are mathematically derived next.
Figure 5.
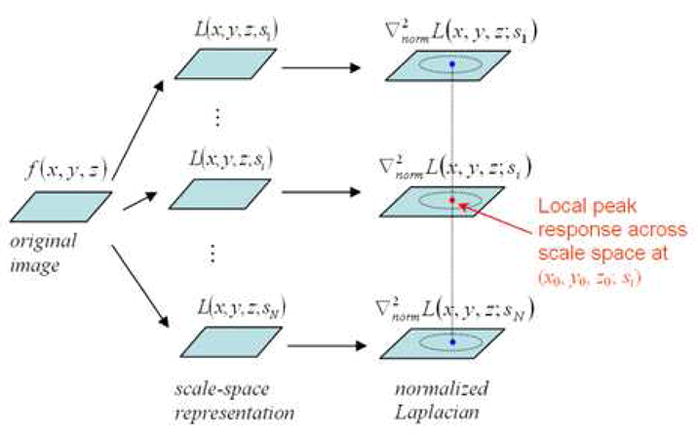
Schematic explanation of the scale-space analysis method. The local peak responses of normalized Laplacian describe important properties of blob-like structures and are used for selecting the candidates of internal landmarks.
Assuming an ideal blob locates at (x0, y0, z0) with the size , it can be modeled by a Gaussian function as:
| (5) |
The scale-space representation of this blob f can be thus obtained as:
| (6) |
At any scale s, the normalized Laplacian of L(x, y, z; s) reaches its maximum at the location (x0, y0, z0), i.e.,
| (7) |
The maximum of Q(s) across scales is calculated by differentiating Q(s) with respect to s,
| (8) |
As Equation (8) equals to zero when s = s0 the normalized Laplacian achieves its maximum at (x0, y0, z0; s0) in the scale-space, which indicates a blob detected with center (x0, y0, z0) and size . In other words, if we detect a peak at a location (x0, y0, z0) with scale s0, it indicates that there might exist a blob centered at (x0, y0, z0) with the size of .
After finding the local maxima in normalized Laplacian maps across different scales, the centers of blob-like structures are detected and used as candidates for internal landmarks. The expected internal landmarks are further determined as follows. First, as the value of Laplacian indicates the saliency of the blob structure, the local maxima in the normalized Laplacian map are thresholded, to ensure the detection of salient blob-like structures. (In this study, the detected candidates with Laplacian less than 50 are discarded.) Second, average intensity within each detected blob-like structure is computed. Since prostate glands appear as bright blobs in histological and MR images, dark blobs are excluded from candidates set. Third, the extremely-flat blobs are discarded, to avoid the selection of blobs on the boundaries of prostate capsule. Fig. 6 gives an example of detected internal landmarks, along with their corresponding scales represented by the sizes of circles, in both histological and MR images.
Figure 6.

Detection of internal landmarks. The internal landmarks are detected from prostate histological image (a) and MR image (b), respectively. The blue/red dots denote the centers of the detected blob-like structures and the sizes of the circles indicate the salient scales of the blob-like structures.
Similarity definition of internal landmarks
Once the internal landmarks are automatically detected, it is necessary to define the similarity between internal landmarks in histological and MR images, in order to determine the correspondences between them. Since the registration of prostate histological and MR images is actually a multimodality registration problem, the similarity between two internal landmarks in histological and MR images is defined by normalized mutual information (NMI) [32], which is robust to size changes of images. However, the evaluation of NMI in our study has four differences compared to traditional NMI-based registration methods.
First, according to the investigation in [24], two structureless image patches might have high mutual information even if they are statistically independent. To avoid this problem, in our method, NMI is evaluated only in the local spherical patches around the internal landmarks under comparison, as the image patches around internal landmarks are generally highly structural.
Second, since the sizes of corresponding blobs can be different in histological and MR images due to distortion and cutting artifact, the sizes of local spherical patches around each internal landmark are normalized according to the detected sizes of the internal landmarks. In this way, the similarity between internal landmarks in histological and MR images becomes scale-invariant.
Third, in order to capture rich image information around each internal landmark for determining its corresponding landmarks in the other modality image, NMI calculated from multiple local patches with different sizes around landmarks are integrated to measure the similarity between internal landmarks.
Last, the local spherical patches of two internal landmarks under comparison are allowed to be rotated to achieve maximal NMI. The maximal NMI’s are used to define the similarity.
In summary, assuming two internal landmarks u and v have respective scales su and sv, their similarity can be mathematically defined as:
| (9) |
where V(u, R) denotes a spherical local patch around the landmark u with the radius R. T(V; s, Δθ) is the transformation operator with a scaling factor s and a rotation factor Δθ. The variable i is the size factor of the local patch where NMI is calculated, and N is the total number of multiple local patches used. NMI{·,·}denotes the normalized mutual information between two same-sized spherical volume images. (Δθ = π/8 and N = 3 in this study)
3.3 Overall Similarity Function
After defining the similarity between same-type landmarks in the above, we can design an overall similarity function to integrate the similarities between same-type landmarks and the smoothness constraints on the estimated transformation between histological and MR images. By maximizing this overall similarity function, the correspondences between same-type landmarks and the dense transformation between histological and MR images can be simultaneously obtained.
Assuming the automatically detected boundary landmarks and internal landmarks are {xi|i = 1· · ·I} and {uj|j = 1· · ·J} in MR image, and {yk|k = 1· · ·K} and {vl|l = 1· · ·L} in histological image. The correspondences between the boundary and the internal landmarks are respectively described by two fuzzy correspondence matrixes A and B [10]:
subject to
| (10) |
and
subject to
| (11) |
It is worth noting that aik and bjl have real values between 0 and 1, which denote the fuzzy correspondences between landmarks [10]. Also, an extra row (i.e., {a(I+1)k} or {b(J+1)l}) and an extra column (i.e., {a(I+1)k} or {b(J+1)l}) are added to each correspondence matrix (i.e., A or B) for handling the outliers. If a landmark cannot find its correspondence, it is regarded as an outlier and the extra entry of this landmark will be set as 1.
The transformation between histological and MR images are represented by a general function h, which can be modeled by various function basis, e.g., multiquadratic [33], thin-plate spline [34], radial basis [35, 36], or B-spline [37, 38]. (In this study, we choose thin-plate spline as the transformation basis.)
Given the definitions of correspondences matrixes and transformation function, the overall similarity function can be defined as:
| (12) |
Here, matrixes A and B are the fuzzy correspondences matrixes subject to Equations (10) and (11), and h denotes the transformation between histological and MR images. The two terms in the first square bracket denote the similarity between landmarks, where S(·,·) and M (·,·) are the similarity between boundary landmarks and the similarity between internal landmarks, as defined in Equations (1) and (9), respectively. The three terms in the second square bracket jointly place smoothness constraints on the transformation h. D(·,·) denotes the Euclidean istance between two points, and ||W(h)||2 is a smoothness measurement of h. In our study, since thin plate spline is selected to model the transformation h, the smoothing term is the “bending energy” of the transformation h, i.e.,
| (13) |
The four terms in the third square bracket are used to direct the correspondences matrixes A and B converging to binary [39]. With a higher τ, the correspondences are forced to be more fuzzy and become a factor in “convexifying” the objective function. While τ is gradually reduced to zero, the fuzzy correspondences become binary [10].
Compared to Chui’s work [10], which aims to non-rigidly match landmarks based on their spatial relations, our registration framework incorporates the geometric and image features of landmarks. The importance of integrating image similarity for correspondence detection is also demonstrated in [36], when registering diffusion tensor images of individual brains.
The overall similarity function can be maximized by an alternating optimization algorithm [10] that successively updates the correspondences matrixes A and B, and the transformation function h. First, with the fixed transformation h, the correspondence matrixes between landmarks are updated by maximizing the terms in the first and the third square bracket of Equation (12). The updated correspondence matrixes are regarded as the temporary correspondences between landmarks. Second, with the fixed temporary correspondence matrixes A and B, the transformation function h is updated by maximizing the terms in the second square bracket of Equation (12). The two steps are alternatively repeated until there are no update of the correspondence matrixes A and B. It is worth to noting that λ in Equation (12) decreases with the progress of iterations, which means less and less smoothness constraints are placed on the transformation between histological and MR image. In this way, a few sharp transitions of deformation are allowed in local regions with cutting artifacts.
By maximizing Equation (12), the correspondences between same-type landmarks and the transformation between histological and MR images are simultaneously estimated. The correspondences established between internal landmarks after maximizing the overall similarity function are shown in Fig. 7.
Figure 7.

Correspondences between internal landmarks. The correspondences between internal landmarks in histological image (a) and MR images (b) are shown by color crosses. Crosses with the same color denote the corresponding internal landmarks.
4. Results
In this section, a set of experiments are presented to validate the performance of our proposed registration method. For comparison, three different registration methods are tested in every experiment. The three registration methods are: (1) Method 1, which is an affine registration algorithm, called FLIRT [40], using global mutual information as similarity definition; (2) Method 2, which only uses boundary landmarks to guide the registration; (3) Method 3, i.e., our proposed method. (In generating the experimental results, the parameters in Equation (12) are α = 0.5, β = 0.5. λ, τ and ξ are three dynamic parameters that are initially set as 1 and decrease to 0.05 with the progress of iterations.)
4.1 Data Preparation
Five pairs of histological and T2-weighted MR images of radical prostatectomy specimen are used as the validation dataset. The data preparation is the same as the procedure reported in [7]. Firstly, the prostate glands are embedded in 2% agar (30 mM NaCl) at 50 °C and cooled to 4 °C to solidify agar in a small Plexiglas box. The prostate gland is then placed on a phased array endorectal coil for imaging with a 4T MRI (GE Systems). A 6-cm field of view is used for imaging the specimens. Next, the histological slices are obtained by using a rotary knife to cut serial sections of the embedded gland starting at its square face. (To facilitate the cut procedure, the prostate gland is quartered.) Each section is 4 μm thick and the interval between neighboring sections is 1.5mm. The 4 μm thick histological sections are scanned using a whole slide scanner. Finally, the four quarters of each slice are manually aligned using Adobe Photoshop. MR and histological images are resampled to be 256×256×64 with the voxel size 0.15mm×0.15mm×0.75mm.
4.2 Experiments to Register Anatomical Structures of Prostates
In both histological and MR images, prostate glands are manually delineated by an expert. (It is worth to noting that the prostate glands can also be delineated by automatic segmentation methods, e.g., morphological operators and deformable models, which make the whole registration procedure fully automatic.) By registering the histological and MR images using a registration algorithm, the prostate gland in the histological image can be warped to the MR image space. The accuracies of different registration methods are compared by calculating the volume overlay error and the average surface distance between prostate glands in warped histological images and MR images. As shown in Tables 1 and 2, by using our proposed method, the average distance between prostate capsules is 0.68mm and the average volume overlay error is 6.08%, which is better than those achieved by the FLIRT method. It is worth noting that, in terms of average distances and volume overlay errors, which are used to mainly evaluate the boundary registration error, the results achieved by our method are similar to those obtained by the method using only boundary landmarks. However, our method produces more accurate registration for internal structures of prostate, which is demonstrated next.
Table 1.
Average distances between the prostate capsule surfaces in MR images and in warped histological images. Method 1: mutual information based affine registration method. Method 2: method using only boundary landmarks. Method 3: the proposed method.
| Method 1 (mm) | Method 2 (mm) | Method 3 (mm) | |
|---|---|---|---|
| Subject 1 | 0.92 | 0.66 | 0.62 |
| Subject 2 | 1.02 | 0.78 | 0.83 |
| Subject 3 | 0.97 | 0.61 | 0.61 |
| Subject 4 | 0.95 | 0.65 | 0.63 |
| Subject 5 | 1.03 | 0.70 | 0.72 |
| Mean | 0.98 | 0.68 | 0.68 |
Table 2.
Volume overlay error between the prostate glands in MR images and in warped histological images. Method 1: mutual information based affine registration method. Method 2: method using only boundary landmarks. Method 3: the proposed method.
| Method 1 | Method 2 | Method 3 | |
|---|---|---|---|
| Subject 1 | 8.6% | 5.8% | 5.1% |
| Subject 2 | 9.3% | 6.8% | 7.2% |
| Subject 3 | 7.5% | 5.3% | 5.3% |
| Subject 4 | 8.1% | 5.0% | 5.3% |
| Subject 5 | 9.3% | 7.0% | 7.7% |
| Mean | 8.6% | 6.0% | 6.1% |
Registration accuracy is further evaluated by using anatomical landmarks inside the prostate capsules. In this experiment, the corresponding anatomical landmarks in histological and MR images are manually defined by an expert. By registering the histological and MR images, the correspondences can be automatically established for any points in the histological and MR images, including the manually defined landmarks. In Table 3, the average distances between the manually-labeled corresponding landmarks and the algorithm-labeled corresponding landmarks are presented to compare the performance of the aforementioned three registration methods. Using our registration method, the average distances is 0.82 mm, which is better than the results by the registration method using only boundary landmarks and the FLIRT registration method. Fig. 8 visually demonstrates the performance of three different registration algorithms, which indicates that our method produced the best results in establishing correspondences for landmarks. This experiment demonstrates the importance of using internal landmarks to guide the deformable registration.
Table 3.
Average distances between manually- and automatically-labeled corresponding landmarks. Method 1: mutual information based affine registration method. Method 2: method using only boundary landmarks. Method 3: the proposed method.
| Method 1 (mm) | Method 2 (mm) | Method 3 (mm) | |
|---|---|---|---|
| Subject 1 | 1.31 | 1.03 | 0.77 |
| Subject 2 | 1.81 | 1.05 | 0.97 |
| Subject 3 | 1.25 | 0.97 | 0.76 |
| Subject 4 | 1.43 | 1.09 | 0.81 |
| Subject 5 | 1.53 | 1.03 | 0.87 |
| Mean | 1.47 | 1.03 | 0.82 |
Figure 8.

Comparison of warping histological images to match with MR images by three different registration methods. Two red points and a red region in (a) denote the manually labeled landmarks and cancerous region in an MR image, respectively. For comparison, those red points and the boundary of cancerous region are repeatedly displayed in three warped histological images (b–d) by three registration methods, i.e., Methods 1, 2, and 3, respectively. The blue points in each of three warped histological images (b–d) are the warped landmarks manually labeled in original histological image, as correspondences to those red landmarks in MR image. The dark region in each warped histological image denotes the warped version of the manually labeled cancerous region in the histological image.
4.3 Experiments to Warp Ground-truth Cancerous Region
As argued in Section 1, the objective of our study is to warp ground-truth cancer information from prostate histological images to MR images. Using a registration method, the ground-truth cancer information in the histological image can be automatically warped to the MR image, therefore automatically labeling the cancerous regions in MR images. In this experiment, to evaluate the performance of different registration methods in labeling cancerous regions, cancerous regions in both histological image and MR image are firstly manually labeled by an expert. Then, we can compute the overlay percentage of manually labeled cancerous regions with automatically labeled cancerous regions in MR images. Fig. 8 visually demonstrates the performance of three different registration algorithms in warping ground-truth cancer information of histological image to MR image. Our method produced the best results in automatically labeling cancerous regions in MR images. The quantitative comparisons on 5 prostate subjects are summarized in Table 4. Our method achieves the volume overlay percentage between manually- and automatically-labeled cancerous regions at the level of 79.1%, which is the best among all of three registration methods.
Table 4.
Volume overlay percentage between manually- and automatically-labeled cancerous regions. Method 1: mutual information based affine registration method. Method 2: method using only boundary landmarks. Method 3: the proposed method.
| Method 1 | Method 2 | Method 3 | |
|---|---|---|---|
| Max | 82.9% | 87.5% | 88.3% |
| Min | 55.9% | 60.4% | 64.1% |
| Average | 71.6% | 75.5% | 79.1% |
5. Conclusion and Future work
In this paper, a novel method for the registration of prostate histological and MR images has been proposed. Instead of matching only the prostate boundaries or evaluating the similarity in the entire images, our method uses the automatically detected boundary landmarks and internal landmarks to guide the deformable registration of histological and MR images, therefore offering the robustness to various distortions and cutting artifacts in histological images. In particular, the boundary landmarks are determined by analyzing the geometry of the surface of prostate capsule, and the similarity between the boundary landmarks in histological and MR images is calculated by the corresponding geometric features. The internal landmarks are determined by using a scale-space analysis method, which provides the saliency, location, and size of the local blob-like structure. The similarity between two internal landmarks in histological and MR images is determined by normalized mutual information calculated from the local neighborhoods around the internal landmarks under comparison. Finally, the correspondences among the automatically detected landmarks and the dense transformation between histological and MR images are simultaneously determined by maximizing an overall similarity function, which integrates the similarities between landmarks and the smoothness constraints on the estimated transformation between histological and MR images.
Experimental results have shown that our proposed method can register anatomical landmarks within prostate capsules at a relatively accurate rate. Also, it can automatically label cancerous regions in MR image by using the cancerous regions reliably detected in histological images, thus facilitating us to learn the signature of cancerous tissues in MR images from a sufficient number of samples in the future. This is important for achieving image-based optimal biopsy using patient-specific information. Moreover, although the method is particularly designed for our computer-aided biopsy system, it could be actually applied to various prostate related clinical studies, since the registration of histological images and MR images builds a bridge between micro-structural information (histological images) and macro-structural information (MR images). It paves the way to the identification of geometric and texture features of microscopically defined prostate structures in prostate MR images.
The future work of this study lies in three aspects. First, due to the limitation of the available datasets, our proposed method is only validated using ex-vivo MR images. Although the appearances of prostates might be different in ex-vivo and in-vivo MR images, we expect our method can achieve similar registration accuracy on in-vivo MR images, since boundaries and internal gland structures of prostates are visible in high-resolution in-vivo MR images as well. We plan to validate our method using in-vivo MR images in the future. Actually, there is another potential way to register histological and in-vivo MR images, which consists of two steps: (1) register histological and ex-vivo MR images, and (2) register ex-vivo MR and in-vivo MR images. Based on the assumption that ex-vivo and in-vivo MR images of the same patient share similar appearance, they are easily to be registered. In this way, the histological image can be eventually well registered with the in-vivo MR image. The study of the histological and in-vivo MR images registration is one of the important tasks of our future work. Second, the experiments presented in this paper are based on manual segmentation of prostates. However, prostate boundaries can actually be delineated from the histological and MR images automatically. As histological and ex-vivo MR images have relatively simple background, prostate boundaries can be automatically delineated by thresholding and morphological operators. For in-vivo MR images that have more complicated background, we plan to extend our proposed method [41] which has been successfully used for the segmentation of prostate ultrasound images. Third, considering the fact that cancerous regions commonly available in both histological and MR images provide another important clue for the registration, a joint registration and cancer identification framework, which aims to increase the performance of both registration and cancer identification in MR images, is under investigation.
Footnotes
Publisher's Disclaimer: This is a PDF file of an unedited manuscript that has been accepted for publication. As a service to our customers we are providing this early version of the manuscript. The manuscript will undergo copyediting, typesetting, and review of the resulting proof before it is published in its final citable form. Please note that during the production process errors may be discovered which could affect the content, and all legal disclaimers that apply to the journal pertain.
References
- 1.Christens-Barry WA, Partin AW. Quantitative Grading of Tissue and Nuclei in Prostate Cancer for Prognosis Prediction. Johns Hopkins Apl Technical Digest. 1997;18:226–233. [Google Scholar]
- 2.Rifkin M, Zerhouni E, Gatsonis C, Quint L, Paushter D, Epstein J, Hamper U, Walsh P, McNeil B. Comparison of magnetic resonance imaging and ultrasonography in staging early prostate cancer. The New England Journal of Medicine. 1990;323:621–626. doi: 10.1056/NEJM199009063231001. [DOI] [PubMed] [Google Scholar]
- 3.Ikonen S, Kaerkkaeinen P, Kivisaari L, Salo JO, Taari K, Vehmas T, Tervahartiala P, Rannikko S. Magnetic Resonance Imaging of Clinically Localized Prostatic Cancer. JOURNAL OF UROLOGY. 1998;159:915–919. [PubMed] [Google Scholar]
- 4.Madabhushi A, Feldman M, Metaxas DN, Chute D, Tomaszewski J. A Novel Stochastic Combination of 3D Texture Features for Automated Segmentation of Prostatic Adenocarcinoma from High Resolution MRI. presented at MICCAI; 2003. [Google Scholar]
- 5.Chan I, Wells W, Mulkern RV, Haker S, Zhang J, Zou KH, Maier SE, Tempany CM. Detection of prostate cancer by integration of line-scan diffusion, T2-mapping and T2-weighted magnetic resonance imaging; a multichannel statistical classifier. Med Phys. 2003;30:2390–8. doi: 10.1118/1.1593633. [DOI] [PubMed] [Google Scholar]
- 6.Zhan Y, Shen D, Zeng J, Sun L, Fichtinger G, Moul J, Davatzikos C. Targeted Prostate Biopsy Using Statistical Image Analysis. IEEE Trans Med Imaging. doi: 10.1109/TMI.2006.891497. In Press. [DOI] [PubMed] [Google Scholar]
- 7.Madabhushi A, Feldman MD, Metaxas DN, Tomaszeweski J, Chute D. Automated Detection of Prostatic Adenocarcinoma From High-Resolution Ex Vivo MRI. IEEE TRANSACTIONS ON MEDICAL IMAGING. 2005;24:1611–1625. doi: 10.1109/TMI.2005.859208. [DOI] [PubMed] [Google Scholar]
- 8.Fix A, Stitzel S, Ridder G, Switzer R. MK-801 neurotoxicity in cupric silver-stained sections: Lesion reconstruction by 3-dimensional computer image analysis. Toxicol Pathol. 2000;28 doi: 10.1177/019262330002800110. [DOI] [PubMed] [Google Scholar]
- 9.Moskalik A, Rubin M, Wojno K. Analysis of three-dimensional Doppler ultrasonographic quantitative measures for the discrimination of prostate cancer. J Ultrasound Med. 2001;20:713–722. doi: 10.7863/jum.2001.20.7.713. [DOI] [PubMed] [Google Scholar]
- 10.Chui H, Rangarajan A. A new point matching algorithm for non-rigid registration. Computer Vision and Image Understanding. 2003;89:114–141. [Google Scholar]
- 11.Thompson PM, Mega MS, Woods RP, Zoumalan CI, Lindshield CJ, Blanton RE, Moussai J, Holmes CJ, Cummings JL, Toga AW. Cortical Change in Alzheimer’s Disease Detected with a Disease-specific Population-based Brain Atlas. Cerebral Cortex. 2001;11:1–16. doi: 10.1093/cercor/11.1.1. [DOI] [PubMed] [Google Scholar]
- 12.Shen D. 4D Image Warping For Measurement of Longitudinal Brain Changes. presented at Proceedings of the IEEE International Symposium on Biomedical Imaging; Arlington, Va. 2004. [Google Scholar]
- 13.Fan Y, Shen D, Davatzikos C. Classification of Structural Images via High-Dimensional Image Warping, Robust Feature Extraction, and SVM. presented at MICCAI, Palm Springs; California, USA. 2005. [DOI] [PubMed] [Google Scholar]
- 14.Rouet JM, Jacq JJ, Roux C. Genetic Algorithms for a Robust 3-D MR-CT Registration. IEEE TRANSACTIONS ON INFORMATION TECHNOLOGY IN BIOMEDICINE. 2000;4:126–136. doi: 10.1109/4233.845205. [DOI] [PubMed] [Google Scholar]
- 15.Hill DLG, Hawkes DJ, Gleeson MJ, Cox TCS. Accurate Frameless Registration of MR and CT Images of the Head: Applications in Planning Surgery and Radiation Therapy. RADIOLOGY. 1994;191:447–454. doi: 10.1148/radiology.191.2.8153319. [DOI] [PubMed] [Google Scholar]
- 16.Maes F, Collignon A, Vandermeulen D, Marchal G, Suetens P. Multimodality Image Registration by Maximization of Mutual Information. IEEE Trans on Medical Imaging. 1997;16:187–198. doi: 10.1109/42.563664. [DOI] [PubMed] [Google Scholar]
- 17.Collignon A, Vandermeulen D, Suetens P, Marchal G. 3D multimodality medical image registration using feature space clustering. In: Ayache N, editor. Lecture Notes in Computer Science: Computer Vision, Virtual Reality, and Robotics in Medicine. Vol. 905. Berlin, Germany: Springer-Verlag; 1995. p. 195204. [Google Scholar]
- 18.Wachowiak MPS, Zheng R, Zurada Y, Elmaghraby JMAS. An Approach to Multimodal Biomedical Image Registration Utilizing Particle Swarm Optimization. IEEE TRANSACTIONS ON EVOLUTIONARY COMPUTATION. 2004;8:289–301. [Google Scholar]
- 19.Taylor L, Porter B, Nadasdy G, di Sant’Agnese P, Pasternack D, Wu Z, Baggs R, Rubens D, Parker K. Three-dimensional registration of prostate images from histology and ultrasound. Ultrasound Med Biol. 2004;30:161–168. doi: 10.1016/j.ultrasmedbio.2003.10.005. [DOI] [PubMed] [Google Scholar]
- 20.Jacobs M, Windham J, Soltanian-Zadeh H, Peck D, Knight R. Registration and warping of magnetic resonance images to histological sections. Medical Physics. 1999;26:1568–1578. doi: 10.1118/1.598671. [DOI] [PubMed] [Google Scholar]
- 21.Schormann T, Zilles K. Three-dimensional linear and nonlinear transformations: An integration of light microscopical and MRI data. Human Brain Mapping. 1998;6:339–347. doi: 10.1002/(SICI)1097-0193(1998)6:5/6<339::AID-HBM3>3.0.CO;2-Q. [DOI] [PMC free article] [PubMed] [Google Scholar]
- 22.d’Aische AdB, Craene MD, Geets X, Gregoire V, Macq B, Warfield SK. Efficient multi-modal dense field non-rigid registration: alignment of histological and section images. Medical Image Analysis. 2004;9:538–546. doi: 10.1016/j.media.2005.04.003. [DOI] [PubMed] [Google Scholar]
- 23.Bardinet E, Ourselin S, Dormont D, Malandain G, Tande D, Parain K, Ayache N, Yelnik J. Co-registration of histological, optical and MR data of the human brain. presented at Medical Image Computing and Computer-Assisted Intervention; Tokey, Japan. 2002. [Google Scholar]
- 24.Andronache A, Cattin P, Szekely G. Adaptive Subdivision for Hierarchical Non-rigid Registration of Multi-modal Images Using Mutual Information. presented at MICCAI 2005; 2005. [DOI] [PubMed] [Google Scholar]
- 25.Lorensen WE, Cline HE. Marching cubes: A high resolution 3D surface reconstruction algorithm. Comp Graphics. 1987;21 [Google Scholar]
- 26.Shen D, Herskovits EH, Davatzikos C. An adaptive-focus statistical shape model for segmentation and shape modeling of 3D brain structures. IEEE Transactions on Medical Imaging. 2001;20:257–270. doi: 10.1109/42.921475. [DOI] [PubMed] [Google Scholar]
- 27.Witkin A. Scale-space filtering: A new approach to multi-scale description. presented at IEEE International Conference on Acoustics, Speech, and Signal Processing; West Germany. 1984. [Google Scholar]
- 28.Lindeberg T. Feature detection with automatic scale selection. International Journal of Computer Vision. 1998;30:77–116. [Google Scholar]
- 29.Lindeberg T. Scale-Space for Discrete Signals. IEEE TRANSACTIONS ON PATTERN ANALYSIS AND MACHINE INTELLIGENCE. 1990;12:234–254. [Google Scholar]
- 30.Pauwels EJVG, Fiddelaers LJ, Moons PT. An Extended Class of Scale-Invariant and Recursive Scale Space Filters. IEEE TRANSACTIONS ON PATTERN ANALYSIS AND MACHINE INTELLIGENCE. 1995;17:691–701. [Google Scholar]
- 31.Lindeberg T. Scale-space theory: A basic tool for analysing structures at different scales. Journal of Applied Statistics. 1994;21 [Google Scholar]
- 32.Studholme CH, Hawkes DLGDJ. An overlap invariant entropy measure of 3D medical image alignment. Pattern Recognition. 1999;32:71–86. [Google Scholar]
- 33.Hardy R. Theory and applications of the multiquadric-biharmonic method. 20 Years of discovery 1968–1988. Computers & Mathematics with Applications. 1990;19:163–208. [Google Scholar]
- 34.Bookstein FL. Principal Warps: Thin-Plate Splines and the Decomposition of Deformations. IEEE Trans on Pattern Analysis and Machine Intelligence. 1989;11:567–585. [Google Scholar]
- 35.Arad N, Reisfeld D. Image Warping Using Few Anchor Points and Radial Functions. Computer Graphics Forum. 1995;14:35–46. [Google Scholar]
- 36.Davatzikos C, Abraham F, Biros G, Verma R. Correspondence Detection in Diffusion Tensor Images. presented at ISBI; Washington, DC. 2006. [Google Scholar]
- 37.Xie Z, Farin GE. Image Registration Using Hierarchical B-Splines. IEEE TRANSACTIONS ON VISUALIZATION AND COMPUTER GRAPHICS. 2004;10:85–94. doi: 10.1109/TVCG.2004.1260760. [DOI] [PubMed] [Google Scholar]
- 38.Rueckert D, Sonoda LI, Hayes C, Hill DLG, Leach MO, Hawkes DJ. Non-rigid registration using free-form deformations: Application to breast MR images. IEEE Transactions on Medical Imaging. 1999;18:712–721. doi: 10.1109/42.796284. [DOI] [PubMed] [Google Scholar]
- 39.Yang J, Blum RS, Williams JP, Sun Y, Xu C. Non-rigid Image Registration Using Geometric Features and Local Salient Region Features. presented at IEEE Computer Society Conference on Computer Vision and Pattern Recognition; New York, NY. 2006. [Google Scholar]
- 40.Jenkinson M, Bannister PR, Brady JM, Smith SM. Improved optimisation for the robust and accurate linear registration and motion correction of brain images. NeuroImage. 2002;17:825–841. doi: 10.1016/s1053-8119(02)91132-8. [DOI] [PubMed] [Google Scholar]
- 41.Zhan Y, Shen D. Deformable Segmentation of 3D Ultrasound Prostate Images Using Statistical Texture Matching Method. IEEE Trans Med Imaging. 2006;25 doi: 10.1109/TMI.2005.862744. [DOI] [PubMed] [Google Scholar]