

Abstract
Simple low MW chelates of Gd3+ such as those currently used in clinical MR imaging are considered too insensitive for most molecular imaging applications. Here, we evaluated the detection limit of a molecularly targeted, low MW Gd3+-based, T1 agent in a model where the receptor concentration was precisely known. The data demonstrate that receptors clustered together to form a microdomain of high local concentration can be imaged successfully even when the bulk concentration of the receptor is quite low. A GdDO3A-peptide identified by phage display to target the anti-FLAG antibody was synthesized, purified and characterized. T1 weighted MR images were compared with the agent bound to antibody in bulk solution and with the agent bound to the antibody localized on agarose beads. Fluorescence competition binding assays show that the agent has a high binding affinity (KD = 150 nM) for the antibody while the fully bound relaxivity of the GdDO3A-peptide:anti-FLAG antibody in solution was a relatively modest 17 mM−1s−1. The agent:antibody complex was MR silent at concentrations below ~9 µM but was detectable down to 4 µM bulk concentrations when presented to antibody clustered together on the surface of agarose beads. These results provided an estimate of the detection limits for other T1-based agents with higher fully bound relaxivities or multimeric structures bound to clustered receptor molecules. The results demonstrate that the sensitivity of molecularly-targeted contrast agents depends on the local microdomain concentration of the target protein and the molecular relaxivity of the bound complex. A model is presented which predicts that for a molecularly targeted agent consisting of a single Gd3+ complex with bound relaxivity of 100 mM−1s−1 or, more reasonably, four tethered Gd3+ complexes each having a bound relaxivity of 25 mM−1s−1, the detection limit of a protein microdomain is ~690 nM at 9.4T. These experimental and extrapolated detection limits are both well below current literature estimates and suggests that detection of low MW molecularly targeted T1 agents is not an unrealistic goal.
Keywords: targeted MRI contrast agents, gadolinium, anti-FLAG antibody, microdomain
1. Introduction
MRI contrast agents are valuable tools in medical diagnostics [1,2]. Gadolinium (Gd3+) complexes are a widely used class of agents that enhance the T1 (spin-lattice) and T2 (spin-spin) relaxation rates of water protons by efficient inner-sphere relaxation followed by rapid exchange of inner-sphere water molecules with bulk water [1–3]. The MR image obtained using classical MRI contrast agents essentially reflects the distribution of the agent in different tissues or organs [1,2]. There is a great deal of interest in enhancing the utility of these tools in medicine and research through the development of molecularly-targeted MRI contrast agents. One example might be a chimeric molecule comprised of a contrast agent tethered to a molecule capable of binding to a specific protein or other biomolecular target with high affinity and specificity [4–17]. For example, we previously reported that a peptide selected from a phage display library to bind the yeast Gal80 protein can be linked to GdDOTA to create a reagent capable of imaging Gal80 protein in vitro [18,19]. The resulting conjugate was referred to as a DO3A-peptide conjugate because one of the carboxylates participates in an amide bond and the targeted T1 agent was referred to as the GdDO3A-peptide complex. Similar experiments have also been reported using less specific targeting agents that bind with serum albumin [1,2,20,21].
However, while these earlier experiments demonstrate the feasibility of developing molecularly-targeted Gd3+ agents, they also highlight the limitations imposed by the insensitivity of MR. For example, in the Gal80 imaging report, significant contrast enhancement over that of the bulk solution could be achieved only at protein concentrations above 10 µM. This requirement for a relatively high target molecule concentration to produce detectable water contrast would appear to rule out the development of Gd3+-based MRI contrast agents targeted at all but the most abundant proteins. However, it could be argued that the bulk concentration of the biomolecular target is not the issue, but rather it is the local concentration in the region to be imaged. In other words, if one is imaging a sample that is highly heterogeneous and the sample contains “microdomains” of high local target molecule concentration, which means the small portion of a sample voxel of high local target concentration, then it may be possible to discriminate the presence of the target in these microdomains even though the concentration of the target molecule is low when considered in the context of the bulk solution. Of course, biological samples are highly heterogeneous and contain many such microdomains. It is possible that cell surface receptors overexpressed on the surface of tumors might be present at a sufficiently high local concentration to be imaged by simple, low MW targeted Gd3+-containing reagents if their binding affinity and specificity were sufficient to allow enough of them to be clustered in such a microdomain.
The lower detection limit of T1-agents in idealized receptor-binding cell surface models has been estimated to be ~102-103 paramagnetic chelates per receptor [1]. Assuming something on the order of 104-105 receptors per cell, this translates to local concentrations of 1–100 µM Gd3+ as a minimum requirement [15]. While not unreasonable in theory, the detection limit of a low MW targeted agent has not, to the best of our knowledge, been quantitatively tested in a simple model system. Most studies reporting quantitative detection levels of T1 agents are based upon binding of a chelate to a soluble protein, total Gd3+ taken into cells, or Gd3+-loaded nanoparticles with an affinity for cells [1, 15, 22, 23]. For example, the limit of detection for simple Gd3+-chelates in cells has been reported to range from 107-108 Gd3+-chelates per cell [15, 22] which, for a cell diameter of 5 µm, corresponds to concentrations ranging from 130 µM to 1.3 mM. Molecular epitopes have been successfully targeted using ~250 nm diameter nanoparticles that contain > 90,000 Gd3+ chelates/particle [23] although this report did not indicate the concentration of the receptors that could be detected. Although the concentration of the nanoparticles at the estimated detection limit was reported as 113 pM, this corresponds to a Gd3+ concentration of 10 µM. In this report, we describe a simple model system to test the lower limit of detection of a simple, low molecular weight T1 agent targeted to a protein microdomain using a GdDO3A-peptide chimera (GdDO3A-FLAG) that binds tightly and specifically to a particular monoclonal antibody (mouse anti-FLAG). As anticipated, this MR reporter molecule was capable of detecting antibody in solution only when the antibody and peptide concentrations were above ~10 µM. However, with the antibody is immobilized on the surface of agarose beads to form an antibody microdomain (Fig. 1), the detection limit dropped ~2.5-fold. This observation is important because it may allow imaging of protein microdomains such as clusters of receptor molecules by molecularly-targeted GdDO3A-peptide conjugates even though the bulk concentration of the agent is well below its usual detection limit. This model system supports the idea that useful MRI contrast agents can be created that specifically target biomolecules clustered into microdomains of high local concentration.
FIG. 1.
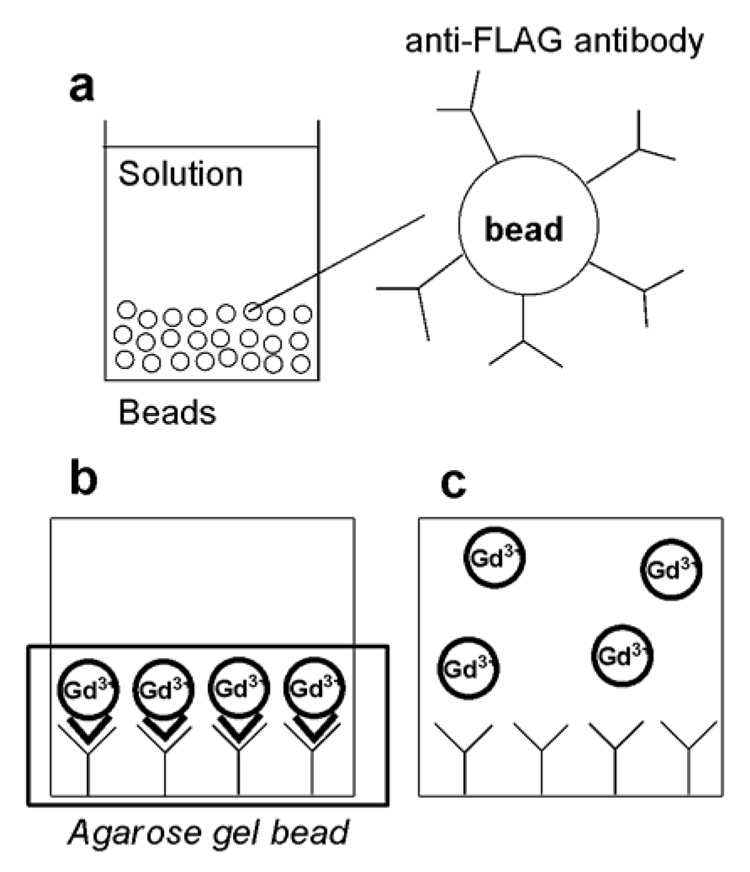
Schematic representation of the model. (a) Anti-FLAG® M2-Agarose Affinity Gel beads are used as a model of highly concentrated cell surface receptors. (b) Upon addition of a GdDO3A-FLAG conjugate, the probe concentrates onto the antibody surface. (c) Addition of non-specific GdDOTA as a control.
2. MATERIALS AND METHODS
2.1 Materials
1,4,7,10-tetraazacyclododecane-1,4,7-tris(acetic acid)-10-acetic acid mono (N-hydroxysuccinimidyl ester) (DOTA-NHS ester) and 1,4,7,10-tetraazacyclododecane-1,4,7,10-tetraacetic acid (DOTA) were purchased from Macrocyclics (Dallas, TX, USA). 5-(and-6)-Carboxyfluorescein, succinimidyl ester (5(6)-FAM, SE) was purchased from Invitrogen Corp. (Eugene, OR, USA). ANTI-FLAG® M2-Agarose Affinity Gel, Monoclonal anti-FLAG® (A2220; ~0.6 mg/mL resin binding capacity equivalent to ca. 12 µM), antibody produced in mouse (F3165), and FLAG® peptide (F3290) were purchased from Sigma-Aldrich Co. (St. Louis, MO, USA). Streptavidin Agarose was purchased from Invitrogen Corp. (Carlsbad, CA, USA). ImmunoPure® Immobilized Protein A Plus was purchased from PIERCE (Rockford, IL, USA). All other reagents were purchased from either Sigma-Aldrich Inc. (St. Louis, MO, USA) or Fisher Scientific (Pittsburgh, PA, USA) or EMD Chemicals Inc. (Gibbstown, NJ, USA) or SynPep Co. (Dublin, CA, USA) or Novabiochem (San Diego, CA, USA). All reagents and solvents were used without further purification unless otherwise noted. Capillary tubes (KIMAX-51®, 1.5 − 1.8 mm × 90 mm) were purchased from KIMBLE GLASS, Inc. The 384-well, microtiter plates with 120 µl well capacity (MICROTEST™ 384-well 120 µl Assay Plate, clear, TC surface sterile) were purchased from FALCON® (Becton Dickinson Labware, France).
2.2 Analytical Instrumentation
Mass spectra were measured using a Voyager-DE™ PRO Biospectrometry Workstation (Applied Biosystems) (matrix-assisted laser desorption/ionization time-of-flight (MALDI-TOF)). HPLC purification was performed on a reverse-phase column (VyDAC C18, 22 mm × 250 mm, 10 µm) fitted on a Waters® BREEZE™ System. Fluorescence polarization studies were performed with a BEACON® 2000 (Panvera). MR images were obtained either using a 200 MHz (4.7T) Varian™ horizontal-bore animal imaging or a 400 MHz (9.4 T) vertical-bore Varian™ microimaging system. Temperature was maintained during MR imaging using a computer-controlled thermostated air-flow heater from SAI, Inc, New York. Solution T1’s were measured using a Maran Ultra NMR relaxometer operating at 23 MHz (Oxford Instruments Molecular Biotools, Austin, TX). ICP-MS spectra were measured with a Perkin-Elmer Sciex Elan 6100 DRC inductively coupled plasma mass spectrometer (ICP-MS) (PerkinElmer Inc.).
2.3 Synthesis
Synthesis of DO3A-FLAG peptide. The 12-mer peptide FLAG® peptide (N-Asp-Tyr-Lys-Asp-Asp-Asp-Asp-Lys-C) conjugated to a linker peptide (N-Ser-Gly-Ser-Gly-C) was synthesized using a Symphony® automated peptide synthesizer (Protein Technologies, Inc., Tucson, AZ, USA) and standard Fmoc solid-phase synthetic procedures. The solid support was a Rink Amide MBHA resin (0.58 mmol/g) and the peptide was prepared on a 0.1 mmol scale. The peptide was characterized by mass spectrometry (MALDI-TOF+) before the peptide-resin was reacted with DOTA-NHS ester. After the last amino acid in the sequence was attached, the Fmoc group was deprotected and the free amino group was reacted with DOTA-NHS ester using the following procedure. The resin (100 µmol), washed with N,N-dimethylformamide (DMF), was treated with 1.5 eq DOTA-NHS ester and 15 eq N,N-diisopropylethylamine (DIEA) in DMF (2 ml) overnight. The resin was then washed with DMF followed by methanol. A cleavage mixture (1 ml/100 mg of the resin) consisting of trifluoroacetic acid (TFA) (95%), triisopropylsilane (2.5%) and water (2.5%) was added to the resin and the mixture was stirred for 3 hr at room temperature. The solution was filtered off and the resin was washed with TFA (1 ml × 2). The combined TFA solutions were concentrated to 1 ml by a stream of air and the product was precipitated using cold ether (40 ml). The peptide pellet was washed three times with cold ether and dried under reduced pressure. The crude product was purified by reverse-phase HPLC (retention time of 38 min) using an eluent linear gradient starting with H2O, 0.1% TFA that increased to 10% acetonitrile, 0.1% TFA over 50 min at a flow rate of 10.0 mL/min. The column effluent was monitored at 220 nm. This resulted in 99.1 mg (59 µmol) of purified DO3A-FLAG peptide conjugate (59% yield). MALDI-MS: m/z calcd for C67H104N19O32 (M + H)+ 1686.7, found 1686.7.
Synthesis of GdDO3A-FLAG. The DO3A-FLAG peptide conjugate (45 mg, 27 µmol) and GdCl3·6H2O (11 mg, 29 µmol) were mixed in 3 ml 1M HEPES buffer (pH 7.4) overnight at room temperature, centrifuged to remove small amounts of precipitated Gd(OH)3 and purified by reverse-phase HPLC. The mixture was loaded onto the column and washed with H2O containing 0.1% TFA for 15 min to completely remove any free Gd3+. The peptide Gd3+ complex was eluted using a linear gradient of H2O containing 0.1% TFA (100%) gradually changing to acetonitrile containing 0.1% TFA (20%) over a period of 35 min at a flow rate of 10 ml/min and using UV detection at 220 nm. This HPLC purification gave 1 (47 mg, 26 µmol, 96% yield). MALDI-MS: m/z calcd for C67H101GdN19O32 (M + H)+ 1841.6, found 1841.6.
Synthesis of FLAG-fluorescein (FLAG-FL). FLAG-FL was prepared using the same procedure as described for DO3A-FLAG chelator using 20 µmol FLAG-peptide resin, 15 mg 5(6)-FAM, SE (30 µmol), and 300 µmol DIEA, yielding 5.2 mg of FLAG-FL (3.1 µmol, 16% yield). HPLC purification: retention time, 43 min; eluent, a 15 min H2O, 0.1% TFA, then a 35 min linear gradient, from 0% to 15% solvent B (solvent A, H2O, 0.1% TFA; solvent B, acetonitrile, 0.1% TFA); flow rate: 10.0 ml/min; 254 nm detection. MALDI-MS: m/z calcd for C72H88N15O31 (M + H)+ 1658.6, found 1659.1.
Synthesis of GdDOTA. GdDOTA was prepared using literature procedures [14,24,25]. DOTA (1g, 2.47 mmol) was dissolved in distilled water (30 ml) and 0.1 M NaOH was added until the pH reached 7.0. An equal molar amount of an aqueous solution of GdCl3·H2O (965 mg, 2.60 mmol) was then added slowly, while a pH of 7 was maintained by further addition of 0.1 M NaOH. The solution was stirred at 80°C overnight. The resulting mixture was filtered to remove any precipitated Gd(OH)3 and the filtrate was concentrated. The residue was dissolved in distilled water (10 ml) and precipitated by addition of acetone to give GdDOTA (1.34 g, 2.31 mmol, 94%) as a colorless solid. MALDI-MS: m/z calcd for C16H25GdN4NaO8 (M + H)+ 582.1, found 582.4; m/z calcd for C16H24GdN4Na2O8 (M + Na)+ 604.1, found 604.3.
2.4 Fluorescence Polarization Assays
Various amounts of anti-FLAG M2 antibody (0, 0.01, 0.05, 0.1, 0.5, 1, 2, and 5 µM), 1 µM of BSA, and 2.5 nM FLAG-FL in 100 µl of TBS buffer (50 mM Tris, 150 mM NaCl, pH 7.4) were incubated at room temperature for 1 hr. The fluorescence polarization values of samples were measured at 24°C, and fitted to Eq. [1], where mP is the measured units of millipolarization of the sample, mPmax is the maximum mP, mP0 is the millipolarization without anti-FLAG M2 antibody, and c is the free anti- FLAG M2 antibody concentration. The free anti-FLAG M2 antibody concentration is nearly equal to the concentration of added anti-FLAG M2 antibody because the concentration of anti-FLAG M2 antibody is sufficiently high.
| [1] |
Competition binding studies involved titrating a competing peptide into a sample containing 2.5 nM of 2 with 100 nM anti-FLAG M2 antibody in a final volume of 100 µl of TBS buffer with 1 µM BSA. The solution was equilibrated at room temperature for 1 hr. Dissociation of 2 from the anti-FLAG M2 antibody was monitored by fluorescence polarization spectroscopy at 25°C. The resulting signal was plotted versus log [GdDO3A-FLAG ] or [FLAG peptide] concentration and the data was fit by nonlinear regression to a 1:1 competitive binding model, Eq. [2]. The amounts of added 1 or FLAG-peptide were 0.00068, 0.0068, 0.034, 0.068, 0.34, 0.68, 3.4, 6.8, 34, 68 µM or 0.001, 0.01, 0.05, 0.1, 0.5, 1.0, 5.0, 10, 50, 100 µM, respectively. From these curves IC50 values were determined (Fig. 3bc).
| [2] |
FIG. 3.
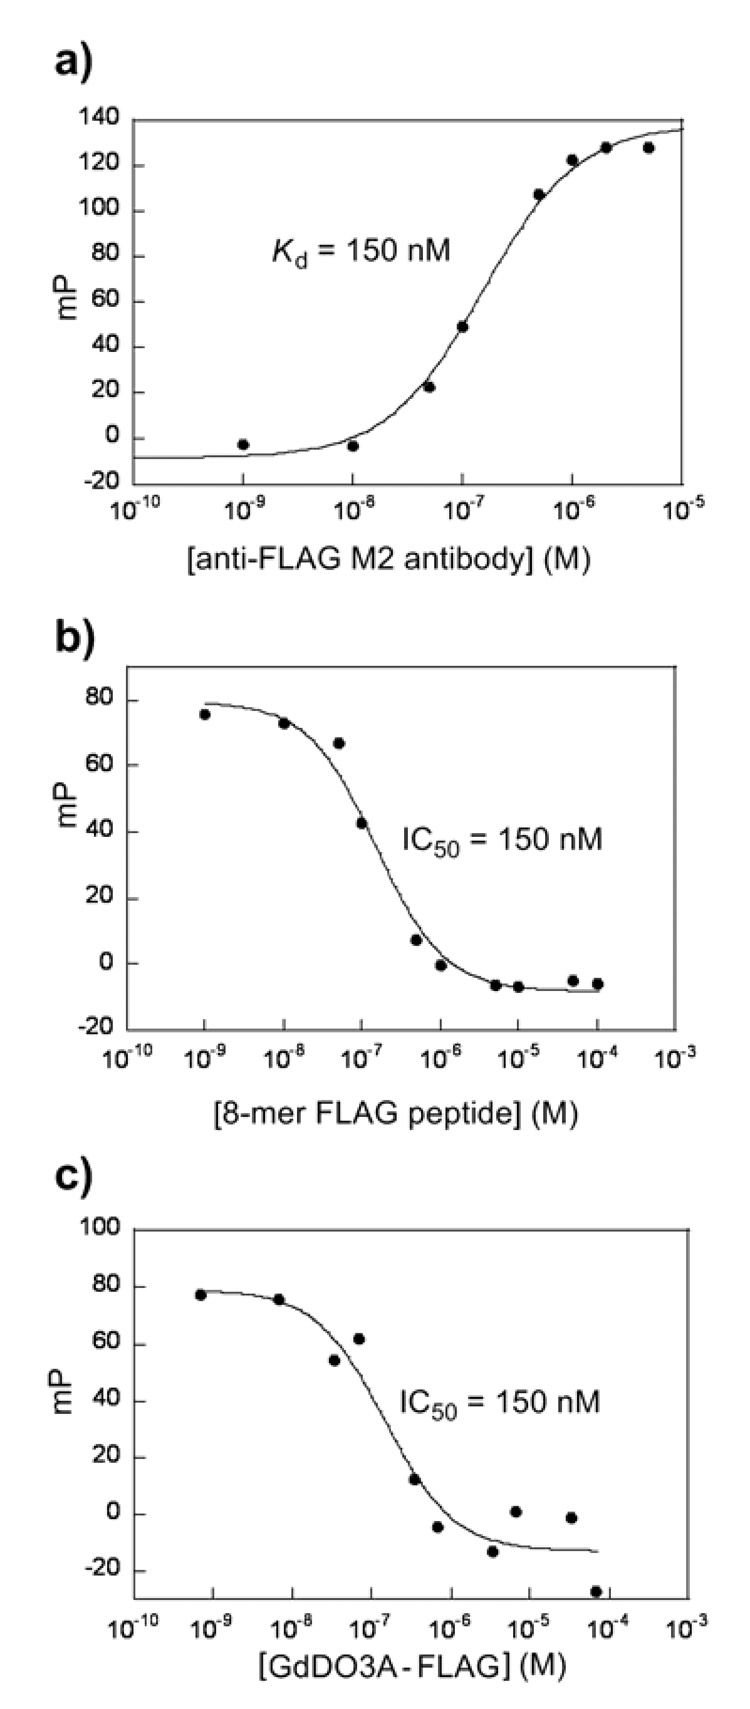
Fluorescence polarization assay of determination of the apparent dissociation constant Kd of FLAG-FL with anti-FLAG M2 antibody (a), and competition binding curves for 8-mer FLAG peptide (b) and FLAG-GdDO3A (c). The curve for the determination of Kd (a) with 2.5 nM FLAG-FL in TBS buffer at 24°C upon the addition of increasing amounts of anti-FLAG M2 antibody: 0, 0.01, 0.05, 0.1, 0.5, 1.0, 2.0, and 5.0 µM. Competition binding experiments were done at 24 °C by titrating 8-mer FLAG peptide (b) (0.001, 0.01, 0.05, 0.1, 0.5, 1, 5, 10, 50, and 100 µM) or the GdDO3A-FLAG (c) (0.00068, 0.0068, 0.034, 0.068, 0.34, 0.68, 3.4, 6.8, 34, and 68 µM) into a solution containing 2.5 nM FLAG-FL with 100 nM anti-FLAG M2 antibody in a final volume of 100 µl of TBS buffer containing 1 µM of BSA. The data were fit by nonlinear regression to a 1:1 binding competitive model. The fitted curve in (a) corresponds to Kd of 150 nM and the competition binding data of (b) and (c) correspond to IC50 values of 150 nM and 150 nM, respectively.
2.5 T1 measurements
The T1 of aqueous solutions of GdDO3A-FLAG was evaluated at 23 MHz and 25°C by using an inversion-recovery pulse sequence. The r1 relaxivity, r1 (mM−1s−1), of GdDO3A-FLAG was determined from the slope of the plot of 1/T1 vs [1] (0, 0.085, 0.17, 0.255, and 0.34 mM) in TBS buffer (200 µl, 50 mM Tris, 150 mM NaCl, pH 7.4). The T1 relaxation times of GdDO3A-FLAG (22 µM) in the presence of various concentrations of anti-FLAG M2 antibody were measured at 25°C in PBS buffer (pH 7.4). The concentration of anti-FLAG M2 antibody was varied from 0 and 23 µM. The 1/T1p values were calculated from Eq. [3].
| [3] |
where 1/T1obs (s−1) is the observed longitudinal relaxation rate of water protons in the presence of Gd3+, and 1/T1dia (s−1) is the diamagnetic longitudinal relaxation rate of water protons in the absence of Gd3+ (1/T1dia of PBS buffer = 0.28 s−1).
2.6 Detection limits (DL) in solutions and gels
All MR images were measured in TBS buffer (50 mM Tris, 150 mM NaCl, pH 7.4) at 25°C. The detection limit of the GdDO3A-FLAG solution was calculated from the intensities of MR images of samples with 0, 3.4, 6.8, 14, 20, 27, or 34 µM GdDO3A-FLAG as determined by ICP-MS. The detection limit of GdDO3A-FLAG while bound to the anti-FLAG® M2-agarose affinity gel was also calculated from the intensities of MR images in the gel layer. The gel was washed with TBS buffer five times before addition of GdDO3A-FLAG. 50 µL portions of anti-FLAG® M2-agarose affinity gel beads were added to separate Eppendorf tubes followed by addition of either 200, 300, 400, 500 or 600 µL of 0.68 µM GdDO3A-FLAG to five tubes and 500 µL of 6.8 µM 1 to a sixth tube (to insure full occupancy of all antibody binding sites). These mixtures were equilibrated for 1 hr at room temperature before the gels were washed 3X with TBS buffer and transferred to capillary tubes for imaging. MR images were collected in axial slices either through the agarose gel bead phase or the solution phase using a 400 MHz (9.4 T) vertical-bore Varian Inova system at 25°C (TR/TE = 300 ms/8.4 ms, FOV = 20 × 20 mm, slice thickness = 2 mm, 128 × 128 matrix). The final concentrations of GdDO3A-FLAG in the anti-FLAG® M2-agarose affinity gel beads as determined by ICP-MS were 1.8, 2.2, 2.4, 3.5, 3.5 and 6.4 µM.
The MR intensities of GdDO3A-FLAG in TBS buffer (60 µl, 50 mM Tris, 150 mM NaCl, pH 7.4) or on the anti-FLAG® M2-agarose affinity gel beads in TBS buffer showed a linear relationship with the concentration of GdDO3A-FLAG in the range from 3.4 × 10⁻⁶ M to 3.4 × 10⁻⁵ M (r2 = 0.94) or from 2.2 × 10⁻⁶ M to 6.4 × 10⁻⁶ M (r2 = 0.94), respectively. The criterion is that the signal be greater than or equal to three times the standard deviation (σ) of the noise level [26,27]. This criterion results in the following condition:
| [4] |
where N is the magnitude of the signal in the region of interest of the MR images.
| [5] |
where CGd (M) is the concentration of GdDO3A-FLAG in TBS buffer or on the anti-FLAG® M2-agarose affinity gel layer as determined by ICP-MS, NGd is the MR signal intensity after addition of GdDO3A-FLAG, N0 is the MR signal intensity without addition of GdDO3A-FLAG, and the standard deviation (σ) was determined from the signal intensity without addition of GdDO3A-FLAG.
2.7 Imaging of capillary tubes
MR images of capillary tubes were collected in axial slices either through the anti-FLAG® M2-agarose affinity gel layer or through the supernatant solution above the gel. The gel beads were washed with TBS buffer (50 mM Tris, 150 mM NaCl, pH 7.4) five times before addition of GdDO3A-FLAG at concentrations ranging from 0, 0.1, 0.3, 0.7, 3.4, or 6.8 µM (1 mL of each solution was added to 30 µL of anti-FLAG® M2-agarose affinity gel). The mixture was allowed to equilibrate in an Eppendorf tube for 1hr at room temperature before transferring the gel and the solution to capillary tubes.
2.8 Imaging of wells (sections cut from a 384-well microtiter plate, 120 µL well capacity)
Previously washed anti-FLAG® M2-agarose affinity gel beads (ca. 30 µl) were added to each of the 3 × 5 wells followed by addition of 70 µL of solution containing 0, 0.7, 3.4, 6.8, or 13.6 µM GdDO3A-FLAG. Duplicate samples were prepared in 2 lanes. In the third lane of a 3 × 5 well plate, identical concentrations of GdDOTA (0, 0.7, 3.4, 6.8, or 13.6 µM; 70 µl each) were substituted for GdDO3A-FLAG. The sample was allowed to equilibrate overnight at 4°C without mixing. The MR images were collected in coronal slices to show the agarose gel bead phase and the solution phase at the same imaging slice at 4.7 T. In separate experiments, gels with streptavidin (ca. 50 µl), anti-FLAG® antibody (ca. 50 µl) or ImmunoPure® Immobilized Protein A (ca. 50 µl) were added to each row and either GdDO3A-FLAG, GdDOTA (50 µL of a 6.8 µM solution in TBS buffer) or TBS buffer (50 µl) was layered gently above each gel. The samples were allowed to equilibrate overnight at 4°C without mixing before MR imaging was performed at 9.4 T and 25°C.
3. RESULTS
3.1 Characterization of GdDO3A-FLAG and FLAG-FL
The FLAG octapeptide (N-Asp-Tyr-Lys-Asp-Asp-Asp-Asp-Lys-C) binds to anti-FLAG M2 antibody with high affinity and has been used for purification of epitope tagged proteins [28]. A linker moiety (N-Ser-Gly-Ser-Gly-C) was attached to the N-terminus of the FLAG octapeptide using an automated peptide synthesizer and standard Fmoc solid-phase peptide synthesis methods and DOTA was conjugated to the N-terminal serine residue of this 12-mer peptide by using 1,4,7,10-tetraazacyclododecane-1,4,7-tris(acetic acid)-10-acetic acid mono(N-hydroxysuccinimidyl ester) (DOTA-NHS ester). This yields a single amide linkage between one of the DOTA carboxyl groups and the N-terminal serine residue of the extended FLAG peptide. This product is referred to as DO3A-FLAG to indicate it is no longer a full-fledged DOTA chelator but rather a derivative of DO3A. Loading of DO3A-FLAG with Gd3+ was achieved by addition of GdCl3 to the peptide (Fig. 2). Fluorescein-labeled 12-mer FLAG peptide (FLAG-FL in Fig. 2) was also synthesized using the same methodology with 5-(and-6)-carboxyfluorescein, succinimidyl ester (5(6)-FAM, SE). To ensure that conjugation of GdDO3A to the 12-mer peptide did not compromise binding to anti-FLAG antibody, competitive binding experiments between FLAG-FL bound to anti-FLAG antibody against either GdDO3A-FLAG or the commercially available FLAG peptide (8-mer) were performed. A fluorescence polarization titration gave an apparent dissociation constant Kd value of 1.5 × 10⁻⁷ M for FLAG-FL binding to anti-FLAG M2 antibody (Fig. 3a). Analysis of competitive binding data gave identical IC50 values (1.5 × 10⁻⁷ M) for both the 8-mer FLAG peptide and GdDO3A-FLAG binding to the anti-FLAG antibody (Fig. 3bc). This indicates that the GdDO3A and FL moieties do not substantially alter the binding interaction compared to the parent 8-mer FLAG peptide.
FIG. 2.

Chemical structure of the GdDO3A-FLAG peptide conjugate, and the FLAG-FL conjugate.
3.2 T1 Measurements of the GdDO3A-FLAG conjugate
The water proton relaxivity of GdDO3A-FLAG in TBS buffer (50 mM Tris, 150 mM NaCl, pH 7.4) was 10.7 mM−1s−1 (23 MHz, 25°C), similar to that of a previously studied GdDO3A-linked peptide [18]. The paramagnetic relaxation rate (1/T1p) of a solution containing 22µM GdDO3A-FLAG in PBS buffer (pH 7.4) increased upon addition of anti-FLAG M2 antibody, reaching a maximum enhancement (ε*) of ~1.6 after addition of ½ equivalent of antibody (Fig. 4). This gradual increase in r1 relaxivity is due to slowing of molecular rotation (τR) as the low molecular weight GdDO3A-FLAG binds to the large anti-FLAG antibody [1,2]. However, the increase in relaxivity seen here is relatively small (~60%) compared with other systems studied previously (1,20,22). This may result from a combination of two factors; 1) the GdDO3A end of the conjugate may experience considerable motional freedom when bound to the anti-FLAG antibody due to the flexibility of the -Ser-Gly-Ser-Gly- linker sequence that was added to limit disruption of the peptide binding affinity and 2) the GdDO3A-peptide linkage introduces one amide bond into the Gd3+ coordination sphere and this is known to slow water exchange [31]. Hence, it is possible that the relaxivity of this system is limited by water exchange (kex−1>T1M) when bound at the antibody surface. This water exchange restriction could also be due to steric problems associated with the way that the Gd chelate binds to the protein. Interestingly, the relaxivity of the GdDO3A-FLAG decreased slightly from the 0.5 equivalent point (1:2 ratio of Anti-FLAG M2 antibody to the GdDO3A-FLAG agent) with addition of additional antibody up to 1 equivalent (1:1 ratio of Anti-FLAG M2 antibody to the GdDO3A-FLAG agent, Fig 4). The antibody is a Y-shaped molecule which consist of two identical Fab domains, forming arms, and one Fc domain, forming the stem. Antigen molecules (i.e., the FLAG-GdDO3A conjugates) bind to the complimentarity-determining regions (CDRs), which are highly variable regions located at the ends of each arm. This suggests that the bound GdDO3A-FLAG conjugate experiences more motional freedom when only one antibody binding site is occupied by the MR probe.
FIG. 4.

Relative enhancement (ε*) of the paramagnetic longitudinal relaxation rate 1/T1p of water protons for 22 µM solution of GdDO3A-FLAG in the presence of various concentrations of anti-FLAG M2 antibody. The antibody concentration was varied from 0 to 23 µM.
3.3 MR experiments in capillary tubes
Here, the anti-FLAG® M2-agarose affinity gel beads were used as a model of protein immobilized in a microdomain. Agarose gel beads (ca. 30 µl) were incubated for 1 h with various concentrations of GdDO3A-FLAG (1 ml) and later placed into individual capillary tubes. After the beads gradually settled to the bottom of the capillary tubes by gravity, they were visibly distinguishable from the solution phase. Axial T1-weighted MR images, collected at the level of the agarose gel beads phase (Fig. 5), showed intensity increases with increasing concentrations of GdDO3A-FLAG (Fig. 6, solid circles). To visualize a plane of high density Gd in a voxel, an elongated voxel was used (2 mm) and run the plane through the entire length of that voxel so that water in the edges of the voxel can adequately access the Gd. MR images collected under identical conditions but without agarose gel beads showed the contribution of free, unbound GdDO3A-FLAG to the total MR signal intensity (Fig. 6, squares). Here, differences in MR image intensities (compared to buffer alone) were not evident below ~0.3 µM GdDO3A-FLAG in TBS buffer alone but increased gradually with increasing concentrations of GdDO3A-FLAG between 0.3 and 6.8 µM. T1-weighted MR images of anti-FLAG® M2-agarose affinity gel beads were also collected on samples containing various concentrations of GdDO3A-FLAG in TBS buffer but in the presence of 400 µM 8-mer FLAG peptide as a competitor in binding to the anti-FLAG antibody. In this case, the changes in MR intensity of the agarose gel bead layers paralleled those of the free solution phase in the absence of beads (Fig. 6, triangles compared to squares). This demonstrates that 400 µM 8-mer FLAG peptide effectively competes with GdDO3A-FLAG at all concentrations examined here (Fig. 6) and that the intensities of unbound GdDO3A-FLAG in the gel layer are identical to that in the aqueous layer. Thus, the increase in MR signal intensity even at 0.1 µM GdDO3A-FLAG (Fig. 6, circles) arises from specific binding of GdDO3A-FLAG to anti-FLAG antibody on the agarose gel beads. From data such as these, one can estimate the detection limit of GdDO3A-FLAG in TBS buffer and GdDO3A-FLAG when bound to the anti-FLAG antibody on agarose gel beads. These limits were 9.0 µM (= 9.0 pmol/mm3) and 4.0 µM (= 4.0 pmol/mm3), respectively, when using a conservative contrast-to-noise ratio of 3.0 (3σ). These detection limits will be influenced to some extent by other factors as well including image spatial resolution and other pulse sequence parameters. It is important to note that our detection limit estimates do not presume to translate directly to the larger voxels of the current clinical systems.
FIG. 5.

MR images of Anti-FLAG® M2-Agarose Affinity Gel beads with GdDO3A-FLAG solutions in capillary tubes. The agarose gel beads were incubated with various concentrations of GdDO3A-FLAG (0, 0.1, 0.3, 0.7, 3.4, or 6.8 µM), and the agarose gel beads and solutions were placed in capillary tubes for imaging. Seven capillary tubes were position in an approximate circle (a capillary at the center was surrounded by six capillary tubes). The capillary tube at the center contains only water while the six capillary tubes surrounding the central tube contain agarose gel beads with various concentrations of GdDO3A-FLAG solutions (6.8*, 3.4, 0.7, 0.3, 0.1, and 0 µM, clockwise). T1-weighted MR images (TR/TE = 300 ms/8.5 ms, FOV = 15 × 15 mm, slice thickness = 2 mm, matrix = 128 × 128; voxel dimensions = 117 µm × 117 µm × 2 mm, an elongated voxel) were collected axially through the agarose gel bead layer of seven capillary tubes.
FIG. 6.

The relative MRI signal intensities showing the accumulation of GdDO3A-FLAG on Anti-FLAG® M2-Agarose Affinity Gel beads in capillary tubes. Agarose gels were incubated with increasing amounts of GdDO3A-FLAG(0, 0.1, 0.3, 0.7, 3.4, or 6.8µM) for 1 hr at room temperature and mildly agitated without (circles) or with (triangles) 8-mer FLAG peptide (400 µM) as a competitor in binding to the anti-FLAG antibody (TR/TE = 300 ms/8.4 ms, FOV = 20 × 20 mm, matrix = 128 × 128; voxel dimensions = 0.16 mm × 0.16 mm × 2 mm, an elongated voxel). The data shown as solid circles were measured from the images of Fig. 5. The various concentrations of GdDO3A-FLAG solutions (0, 0.1, 0.3, 0.7, 3.4, or 6.8 µM) without agarose gel beads in capillary tubes were also measured (squares) (TR/TE = 300 ms/8.4 ms, FOV = 30 × 30 mm, matrix = 128 × 128; voxel dimensions = 0.23 mm × 0.23 mm × 2 mm, an elongated voxel). All voxel counts for ROIs ≥ 24.
3.4 MRI experiments in small well plates
To visualize the accumulation of GdDO3A-FLAG on anti-FLAG® M2-agarose affinity gel surfaces, T1-weighted MR images of the agarose gel layer and the solutions above the gel layer were imaged simultaneously in 3 × 5 wells at 4.7 T (Fig. 7ab). Localization of GdDO3A-FLAG at the solution-gel interface is easily seen (Fig. 7a) in comparison to the control samples where GdDOTA was substituted for GdDO3A-FLAG (Fig. 7b). The MR intensities of the supernatant above each gel layer did not exhibit significant differences for solution concentrations of GdDO3A-FLAG initially at 0.7–6.8 µM but did increase once the total bulk solution content of GdDO3A-FLAG exceeded the total number of antibody binding sites, 13.6 µM in this example. This illustrates that essentially all GdDO3A-FLAG that was initially in the solution phase concentrated on the anti-FLAG agarose gel bead surface. Interestingly, the MR signal intensity of the gel surfaces could be distinguished even when the bulk solution concentration of GdDO3A-FLAG was as low as ~1 µM.
FIG. 7.

a,b: T1-weighted axial images (TR/TE = 400 ms/11 ms, FOV = 40 × 40 mm, slice thickness = 2 mm, matrix = 128 × 128) of 3 × 5 wells. Anti-FLAG® M2-Agarose Affinity Gel beads (ca. 50 µl) were added to each well and various concentrations (0, 0.7, 3.4, 6.8, 13.6 µM (left to right)) of GdDO3A-FLAG peptide in TBS buffer was layered above each gel surface (a). Duplicate samples of GdDO3A-FLAG peptide were prepared in two rows. The various concentrations (0, 0.7, 3.4, 6.8, 13.6 µM (left to right)) of GdDOTA in TBS buffer was added to the remaining row (b). c: T1-weighted axial images (TR/TE = 400 ms/8.5 ms, FOV = 30 × 30 mm, matrix = 128 × 128; voxel dimensions = 0.23 mm × 0.23 mm × 2 mm, an elongated voxel) of 3 × 3 wells through the agarose gel bead phase. Rows S, F, P are Streptavidin agarose affinity gel beads (ca. 80 µl), anti-FLAG M2 agarose affinity gel beads (ca. 80 µl), and protein A agarose affinity gel beads (ca. 80 µl) respectively (up to down), and columns 1, 2, 3 are 6.8 µM GdDO3A-FLAG peptide (50 µl), 6.8 µM GdDOTA (50 µl), and TBS buffer (50 µl) respectively (left to right). The samples were incubated at 4°C overnight before collection of the imaging data. d: T1-weighted coronal images (inversion recovery spin echo sequence, 9.4T, TR = 6.5 s, TI = 500 ms, TE = 8.5 ms, FOV = 30 × 30 mm, matrix = 128 × 128; voxel dimensions = 0.23 mm × 0.23 mm × 2 mm, an elongated voxel) of the middle row of the 3 × 3 well used in (c).
To examine the specificity of this binding interaction, imaging experiments were also performed in 3x3 well plates with each horizontal row containing either streptavidin agarose affinity beads (top row, Fig. 7c), anti-FLAG M2 agarose affinity gel beads (middle row, Fig. 7c), or protein A agarose affinity gel beads (bottom row, Fig. 7c). Each vertical well column in this experiment contained either 6.8 µM GdDO3A-FLAG, GdDOTA or TBS buffer (columns 1, 2 & 3, Fig. 7c). The images shown in Fig. 7c were collected just below the solution-gel interface layer of each sample (arrow in Fig. 7d). Although each antibody-labeled agarose gel showed differences in MR intensities reflecting differences in the viscosity of each gel, the only well that showed significant contrast above background controls was the well containing the antibody specific for GdDO3A-FLAG. This demonstrates that molecularly-targeted Gd3+ agents can detect protein microdomains at local concentrations well below the concentration required for bulk solution measurements. The estimated “local concentration” of GdDO3A-FLAG bound at the bright gel surface was ~ 12 µM (the bright layer shown in Fig. 7d and bright square shown in Fig. 7c had contrast-to-noise figures ≥ 18).
4. DISCUSSION
Images of samples containing a simple Gd3+-peptide conjugate that binds with high affinity to an antibody and demonstrated that accumulation of this agent on an agarose surface containing antibody microdomains allows one to reliably detect such binding events at concentrations well below 10 µM. Our intent was to create a simple model which would allow us to test the sensitivity limits of a targeted Gd3+-based T1 agent for molecular imaging of cell surface receptors. Accumulation of GdDO3A-FLAG in the microdomain was evident by clear contrast differences between the microdomain phase and the solution phase even without washing excess excess conjugate from the samples. The detection limit of the GdDO3A-FLAG in TBS buffer at 9.4T and while bound to anti-FLAG agarose gel beads were 9±3 µM (= 9±3 pmol/mm3) and 4±1 µM (= 4±1 pmol/mm3), respectively, as defined for a fixed contrast-to-noise ratio of 3 (3σ). These conservative detection limits are somewhat lower in comparison to those reported previously based upon images collected on cells containing various Gd3+ complexes at 10–100 µM (0.017 – 0.17 fmol/cell) and 2.35 T [15]. It worth noting that the present model detects the equilibrium state of bound Gd3+-peptide complex in a microdomain of immobilized protein and that the amount of accumulated complex in the voxels with these microdomains is highly dependent on the concentration of the clustered target biomolecules in those microdomains and the affinity of the target protein for the Gd3+ agent but much less dependent on the bulk solution concentration of the agent. The limits reported here also depend to some extent on the imaging parameters for collection of the image data and perhaps even the MRI system hardware. However, one can safely conclude that Gd3+ complexes in the low µM range are needed to discriminate contrast differences in T1-weighted MR images using relatively standard imaging pulse sequences and parameters.
Analytically, one can define the detection limit in terms of the smallest difference in T1’s (of medium versus medium plus agent) necessary to produce significant image contrast (equation 6). This, in turn, is proportional to [Gd3+]DL times the relaxivity (r1) of the agent.
| [6] |
If one fixes (T1P−1)DL to the value determined experimentally, one can easily predict the lower detection limit of other Gd3+-based agents that might have even higher fully bound relaxivity values. The curve in Figure 8 shows this prediction in graphical form for a contrast-to-noise fixed at 3 as the spectroscopic detection limit guide line (Equation 4 and Equation 5), similar to the β criterion suggested by Ahrens et al. in their T1 contrast enhancement model [30]. This relationship predicts that a targeted probe containing a single Gd3+ complex having a relaxivity of 100 mM−1 s−1 at 0.47 T (23 MHz) (a lofty goal - likely impossible to achieve) or as few as four Gd3+ complexes each having a relaxivity of 25 mM−1 s−1 (a realistic value), should easily detect protein microdomains at local concentrations on the order of 690 nM. The shape of this curve is also interesting because it illustrates that it will be difficult to reach detection limits below 0.6 µM (in terms of total Gd3+ concentration) regardless of the magnitude of relaxivity. In fact, data such as these show that it may be much more important to optimize the binding interaction between the targeted agent and the protein than spending time trying to develop an agent with an unrealistically high relaxivity value. The current model provides useful guidelines for the detection of targeted Gd3+-based MR agents to cell surface receptors that may be biomarkers indicative of particular disease states. One such family of receptors that is abundant enough in current cell lines is the VEGFR-2 (vascular endothelial growth factor receptor) which may be present on cell surfaces by as much as 2 × 10⁵ per cell (PAE/KDR cell line, Sibtech, Inc.). If targeted and saturated with the proper agent, this receptor concentration translates to between 1 to 3 µM of [Gd3+] in compact cells, which may be detectable with targeted Gd-based T1 agents with relaxivity of at least 25 mM−1s−1. The overexpression of such receptors on the surface of tumor vasculature cells has been the focus of numerous cancer cell engineering attempts including the HEK293 cell line that can express up to 2 × 10⁶ receptors per cell [28]. This cell receptor concentration corresponds to about 25 to 30 µM. Therefore, by extrapolation, this HEK cell line may be discriminated upon by MRI using a high affinity targeted Gd3+-agent with a relaxivity of only 2.5 to 3 mM−1s−1. A targeted Gd3+-agent with a higher relaxivity (ca. 10 mM−1s−1) would allow for detection of receptors in this cell line even with 20% receptor saturation (~5 µM). These are idealized extrapolations of controlled hypothetical cases involving receptor-overexpressing transfected cell lines (VEGFR-2 and HEK) as compared to the in vivo setting, which could allow for deviations from this model behavior and may be deemed premature. Numerous positive or negative contributions from internalization, receptor binding, recycling, as well as complex microenvironmental and stromal effects could arise in living systems and must be addressed for each different protocol. Overall, our results and extrapolations suggest that MRI detection of low MW targeted T1 agents at the micromolar concentration range is not an unrealistic goal.
FIG 8.
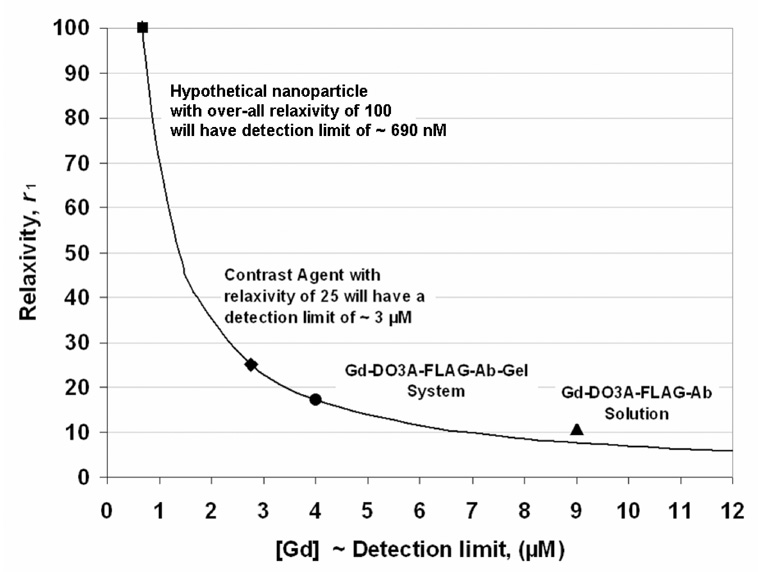
Plot of agent relaxivity versus the detection limit based upon Equation 6. The (T1P−1)DL = 0.069 s−1 of the GdDO3A-FLAG peptide bound to Anti-FLAG gel beads (i.e., the product,GdDO3A-FLAG-Ab- Gel system, with relaxivity, r1 = 17.2 mM−1s−1), and the [Gd] at the detection limit (~ 4 µM)) was held constant for the curve. This constant corresponds to the smallest difference in T1 that the MRI can discriminate at these imaging conditions. This curve corresponds to a sensitivity, i.e., a ΔT10 requirement, of 514 ms at T0 = 3000 ms or 65 ms at T0 =1000 ms. The corresponding r1 at the detection limits for GdDO3A-FLAG-Ab-Gel system (circle), GdDO3A-FLAG-Ab in solution (triangle; (T1P−1)DL = 0.096 s−1 ), hypothetical target particles/agents with r1 of 100 mM−1s−1 (square) and 25 mM−1s−1 (diamond) are shown.
ACKNOWLEDGEMENTS
This research was supported in part by grants from the National Institutes of Health (CA-115531, DK-058398 and RR-02584) and the Robert A. Welch Foundation (AT-584). Kenjiro Hanaoka was the recipient of Research Fellowships of the Japan Society for the Promotion of Science for Young Scientists. We thank Peng Yu for valuable suggestions for the affinity gel experiments, Susan Li for synthesis of the peptide, and Matthew Merritt for spectrometer assistance.
Footnotes
Publisher's Disclaimer: This is a PDF file of an unedited manuscript that has been accepted for publication. As a service to our customers we are providing this early version of the manuscript. The manuscript will undergo copyediting, typesetting, and review of the resulting proof before it is published in its final citable form. Please note that during the production process errors may be discovered which could affect the content, and all legal disclaimers that apply to the journal pertain.
References
- 1.Tóth É, Helm L, Merbach AE. The chemistry of contrast agents in medical magnetic resonance imaging. In: Merbach AE, Tóth É, editors. Relaxivity of gadolinium(III) complexes: theory and mechanism. Chichester: John Wiley & Sons; 2001. pp. 45–119. [Google Scholar]
- 2.Caravan P, Ellison JJ, McMurry TJ, Lauffer RB. Gadolinium(III) chelates as MRI contrast agents: structure, dynamics, and applications. Chem Rev. 1999;99:2293–2352. doi: 10.1021/cr980440x. [DOI] [PubMed] [Google Scholar]
- 3.Aime S, Botta M, Fasano M, Terreno E. Prototropic and water-exchange processes in aqueous solutions of Gd(III) chelates. Acc Chem Res. 1999;32:941–949. [Google Scholar]
- 4.Sipkins DA, Cheresh DA, Kazemi MR, Nevin LM, Bednarski MD, Li KCP. Detection of tumor angiogenesis in vivo by αvβ3-targeted magnetic resonance imaging. Nat Med. 1998;4:623–626. doi: 10.1038/nm0598-623. [DOI] [PubMed] [Google Scholar]
- 5.Tiefenauer LX, Kühne G, Andres RY. Antibody-magnetite nanoparticles: in vitro characterization of a potential tumor-specific contrast agent for magnetic resonance imaging. Bioconjugate Chem. 1993;4:347–352. doi: 10.1021/bc00023a007. [DOI] [PubMed] [Google Scholar]
- 6.Marecos E, Weissleder R, Bogdanov A., Jr Antibody-mediated versus nontargeted delivery in a human small cell lung carcinoma model. Bioconjugate Chem. 1998;9:184–191. doi: 10.1021/bc970146w. [DOI] [PubMed] [Google Scholar]
- 7.Benedetto S, Pulito R, Crich SG, Tarone G, Aime S, Silengo L, Hamm J. Quantification of the expression level of integrin receptor βvβ3in cell lines and MR imaging with antibody-coated iron oxide particles. Magn Reson Med. 2006;56:711–716. doi: 10.1002/mrm.21023. [DOI] [PubMed] [Google Scholar]
- 8.Huh YM, Jun Y, Song HT, Kim S, Choi J, Lee JH, Yoon S, Kim KS, Shin JS, Suh JS, Cheon J. In vivo magnetic resonance detection of cancer by using multifunctional magnetic nanocrystals. J Am Chem Soc. 2005;127:12387–12391. doi: 10.1021/ja052337c. [DOI] [PubMed] [Google Scholar]
- 9.Weinmann HJ, Ebert W, Misselwitz B, Schmitt-Willich H. Tissue-specific MR contrast agents. Eur J Radiol. 2003;46:33–44. doi: 10.1016/s0720-048x(02)00332-7. [DOI] [PubMed] [Google Scholar]
- 10.Shahbazi-Gahrouei D, Williams M, Rizvi S, Allen BJ. In vivo studies of Gd-DTPA-monoclonal antibody and Gd-porphyrins: potential magnetic resonance imaging contrast agents for melanoma. Magn Reson Imaging. 2001;14:169–174. doi: 10.1002/jmri.1168. [DOI] [PubMed] [Google Scholar]
- 11.Konda SD, Aref M, Brechbiel M, Wiener EC. Development of a tumor-targeting MR contrast agent using the high-affinity folate receptor: work in progress. Invest Radiol. 2000;35:50–57. doi: 10.1097/00004424-200001000-00006. [DOI] [PubMed] [Google Scholar]
- 12.Montet X, Weissleder R, Josephson L. Imaging pancreatic cancer with a peptide-nanoparticle conjugate targeted to normal pancreas. Bioconjugate Chem. 2006;17:905–911. doi: 10.1021/bc060035+. [DOI] [PubMed] [Google Scholar]
- 13.Högemann D, Josephson L, Weissleder R, Basilion JP. Improvement of MRI probes to allow efficient detection of gene expression. Bioconjugate Chem. 2000;11:941–946. doi: 10.1021/bc000079x. [DOI] [PubMed] [Google Scholar]
- 14.Anelli PL, Bertini I, Fragai M, Lattuada L, Luchinat C, Parigi G. Sulfonamide-functionalized gadolinium DTPA complexes as possible contrast agents for MRI: a relaxometric investigation. Eur J Inorg Chem. 2000:625–630. [Google Scholar]
- 15.Wolf M, Hull WE, Mier W, Heiland S, Bauder-Wüst U, Kinscherf R, Haberkorn U, Eisenhut M. Polyamine-substituted gadolinium chelates: a new class of intracellular contrast agents for magnetic resonance imaging of tumors. J Med Chem. 2007;50:139–148. doi: 10.1021/jm061003a. [DOI] [PubMed] [Google Scholar]
- 16.Leuschner C, Kumar CSSR, Hansel W, Soboyejo W, Zhou J, Hormes J. LHRH-conjugated magnetic iron oxide nanoparticles for detection of breast cancer metastases. Breast Cancer Res Treat. 2006;99:163–176. doi: 10.1007/s10549-006-9199-7. [DOI] [PubMed] [Google Scholar]
- 17.Lee JH, Huh YM, Jun Y, Seo J, Jang J, Song HT, Kim S, Cho EJ, Yoon HG, Suh JS, Cheon J. Artificially engineered magnetic nanoparticles for ultra-sensitive molecular imaging. Nat Med. 2007;13:95–99. doi: 10.1038/nm1467. [DOI] [PubMed] [Google Scholar]
- 18.De León-Rodríguez LM, Ortiz A, Weiner AL, Zhang S, Kovacs Z, Kodadek T, Sherry AD. Magnetic resonance imaging detects a specific peptide-protein binding event. J Am Chem Soc. 2002;124:3514–3515. doi: 10.1021/ja025511v. [DOI] [PubMed] [Google Scholar]
- 19.De León-Rodríguez LM, Kovacs Z, Dieckmann GR, Sherry AD. Solid-phase synthesis of DOTA-peptides. Chem Eur J. 2004;10:1149–1149. doi: 10.1002/chem.200305389. [DOI] [PubMed] [Google Scholar]
- 20.Eldredge HB, Spiller M, Chasse JM, Greenwood MT, Caravan P. Species dependence on plasma protein binding and relaxivity of the gadolinium-based MRI contrast agent MS-325. Invest Radiol. 2006;41:229–243. doi: 10.1097/01.rli.0000199293.86956.48. [DOI] [PubMed] [Google Scholar]
- 21.Zhang Z, Greenfield MT, Spiller M, McMurry TJ, Lauffer RB, Caravan P. Multilocus binding increases the relaxivity of protein-bound MRI contrast agents. Angew Chem Int Ed. 2005;44:6766–6769. doi: 10.1002/anie.200502245. [DOI] [PubMed] [Google Scholar]
- 22.Aime S, Barge A, Cabella C, Geninatti Critch S, Gianolio E. Targeting Cells with MR Imaging Probes Based on Paramagnetic Gd(III) Chelates. Curr Pharmaceut Biotech. 2004;5:509–518. doi: 10.2174/1389201043376580. [DOI] [PubMed] [Google Scholar]
- 23.Morawski AM, Winter PM, Crowder KC, Caruthers SD, Fuhrhop RW, Scott MJ, Robertson JD, Abendschein DR, Lanza GM, Wickline SA. Targeted Nanoparticles for Quantitative Imaging of Sparse Molecular Epitopes with MRI. Mag. Res. Med. 2004:480–486. doi: 10.1002/mrm.20010. [DOI] [PubMed] [Google Scholar]
- 24.Hardcastle KI, Botta M, Fasano M, Digilio G. Experimental evidence for a second coordination sphere water molecule in the hydration structure of YbDTPA – insights for a re-assessment of the relaxivity data of GdDTPA. Eur J Inorg Chem. 2000:971–977. [Google Scholar]
- 25.Louie AY, Hüber MM, Ahrens ET, Rothbächer U, Moats R, Jacobs RE, Fraser SE, Meade TJ. In vivo visualization of gene expression using magnetic resonance imaging. Nat Biotechnol. 2000;18:321–325. doi: 10.1038/73780. [DOI] [PubMed] [Google Scholar]
- 26.Bennun L, Greaves ED, Blostein JJ. New procedure for intensity and detection limit determination in spectral trace analysis: application for trace mercury by TXRF. X-ray Spectrom. 2002;31:289–295. [Google Scholar]
- 27.Liang SC, Wang H, Zhang ZM, Zhang X, Zhang HS. Spectrofluorimetric determination of cycteine by 5-maleimidyl-2-(m-methylphenyl)benzoxazole. Spectrochim Acta, Part A. 2002;58:2605–2611. doi: 10.1016/s1386-1425(02)00003-3. [DOI] [PubMed] [Google Scholar]
- 28.Yonezawa M, Doi N, Kawahashi Y, Higashinakagawa T, Yanagawa H. DNA display for in vitro selection of diverse peptide libraries. Nucleic Acids Res. 2003;31:e118. doi: 10.1093/nar/gng119. [DOI] [PMC free article] [PubMed] [Google Scholar]
- 29.Backer Marina V, Gaynutdinov TI, Patel V, Bandyopadhyaya AK, Thirumamagal BTS, Tjarks W, Barth RF, Claffey K, Backer JM. Vascular endothelial growth factor selectively targets boronated dendrimers to tumor vasculature. Molecular cancer therapeutics. 2005;4(9):1423–1429. doi: 10.1158/1535-7163.MCT-05-0161. [DOI] [PubMed] [Google Scholar]
- 30.Ahrens ET, Rothbacher U, Jacobs RE, Fraser SE. A model for MRI contrast Enhancement using T1 agents. Proc. Natl. Acad. Sci. USA. 1998;95:8443–8448. doi: 10.1073/pnas.95.15.8443. [DOI] [PMC free article] [PubMed] [Google Scholar]
- 31.Powell DH, Ni Dhubhghaill OM, Pubanz D, Helm L, Lebedev YS, Schlaepfer W, Merbach AE. High-pressure NMR kinetics. Part 74. Structural and Dynamic Parameters Obtained from 17O NMR, EPR, and NMRD Studies of Monomeric and Dimeric Gd3+ Complexes of Interest in Magnetic Resonance Imaging: An Integrated and Theoretically Self-Consistent Approach. J. Amer. Chem. Soc. 1996;118:9333–9346. [Google Scholar]