

Abstract
We present a mathematical model of the blood-stage dynamics of mixed Plasmodium vivax–Plasmodium falciparum malaria infections in humans. The model reproduces features of such infections found in nature and suggests several phenomena that may merit clinical attention, including the potential recrudescence of a long-standing, low-level P. falciparum infection following a P. vivax infection or relapse and the capacity of an existing P. vivax infection to reduce the peak parasitemia of a P. falciparum superinfection. We simulate the administration of anti-malarial drugs, and illustrate some potential complications in treating mixed-species malaria infections. Notably, our model indicates that when a mixed-species infection is misdiagnosed as a single-species P. vivax infection, treatment for P. vivax can lead to a surge in P. falciparum parasitemia.
Plasmodium vivax and P. falciparum are the most widespread and commonly studied of the four species that cause human malaria. Dual infections are common and frequently recorded in field surveys, but there has been little research on the within-host interactions or clinical impacts of coinfecting species. Cohen1 reviewed prevalence surveys and concluded that in general, fewer mixed-species infections are observed than would be expected from the prevalences of the constituent species. Richie2 reviewed prevalence surveys and concluded that there is no general pattern in the frequencies of mixed-species infections in humans. Our reviews of more recent cross-sectional studies3,4 found that lower-than-expected frequencies of dual P. vivax-P. falciparum infections correspond to higher overall malaria prevalence, and, in general, that the frequencies of mixed-species Plasmodium infections detected in humans may depend upon the particular combinations of Plasmodium species present. We have also found mixed-species Plasmodium infections common in vector Anopheles species.5
Longitudinal studies of mixed-species infections are extremely rare. Several neurosyphilis malariatherapy charts published by Boyd and Kitchen6,7 suggest that P. falciparum suppressed P. vivax parasitemia in these patients. Interspecies inhibition was also suggested by other such studies.8–11 Shute12 reported that P. vivax often failed to thrive if inoculated simultaneously with P. falciparum, but could reach patent levels if inoculated a few days before P. falciparum. More recently, clinical studies13,14 have found high rates of P. vivax infection following treatment of patients previously assumed to be infected only with P. falciparum. Studies with non-human malarias have also suggested interspecific suppression.15–19
The pathologic consequences of mixed-species infections are of particular interest to clinicians. Jeffrey20 noted that prior infection with P. ovale could alter the clinical course of subsequent P. falciparum infection. Other studies have noted relationships between mixed-species infections and enlarged spleen size,10 decreased spleen size,1 and depressed immune response.21 Black and others22 suggested that P. malariae infections reduce the severity of subsequent P. falciparum infections, and that individuals concurrently infected with both species have fewer clinical symptoms than those infected with P. falciparum alone. Similar conclusions have been reported for P. vivax and P. falciparum.23–26, but see 27,28 The work of Black and others inspired us to develop a mathematical model of P. malariae-P. falciparum within-host dynamics.29 With that model, in addition to reproducing known features of those infections, we found that an existing P. malariae infection can reduce the peak parasitemia of a subsequent P. falciparum superinfection by as much as 50%. Here we address the dynamics of a more common and clinically significant mixed-species malaria infection—one with P. vivax and P. falciparum—and investigate several of its clinically important features.
METHODS
We adapt our model of mixed P. malariae-P. falciparum infections29 to the more clinically common dual infection with P. vivax and P. falciparum. Unless stated otherwise, the structure and assumptions of the adapted model are as described in detail elsewhere.29 Briefly, the model is a set of five nonlinear ordinary differential equations:
The dynamic variables V and F represent per-microliter densities of P. vivax and P. falciparum asexual forms, respectively. I represents the per-microliter density of the effectors of the non-specific immune response, and J and K represent those of the effectors of the species-specific immune responses raised by V and F, respectively.
a and b represent the asexual-form replication rates for P. vivax and P. falciparum, respectively. Although the P. vivax multiplication rate may vary from 12 to 24 merozoites per merozoite,30 we follow the more recent authority of Garnham31 and assume that an average P. vivax merozoite produces 13 merozoites every 2 days. If considered as a continuous (asynchronous) process of exponential growth, this fixes a = (ln13)/2 = 1.28. If an average P. falciparum merozoite produces 16 merozoites every 2 days,32 b = (ln16)/2 = 1.39.
g is the gametocyte conversion rate, at which P. vivax and P. falciparum asexual forms differentiate to sexual, transmissible forms. In previous work33,34 we examined a range of values for g consistent with the rates observed for P. falciparum.35,36 Given our observations in those studies, and because there is not sufficient empirical evidence to suggest otherwise, here we adopt g = 0.04 for both P. vivax and P. falciparum.
qs is the specific-immunity decay rate, at which the specific immune effectors senesce. Specific immune effector life-spans vary from hours for cytokines to years for memory B cells.37 Here we follow our previous convention33,38 and arbitrarily set qs = 0.01, implying an effector half-life of 70 days.
qn is the non-specific-immunity deactivation rate at which the non-specific immune effectors become quiescent. Macrophages are longer-lived than B or T cells;37 thus, for the time-scale of this system, we are more concerned with the deactivation than the senescence of macrophages. Antia and Koella39 approximate the half-life of activated macrophages at one day; for convenience we set qn = (ln2)/1.1 = 0.6, implying a half-life of 1.1 days.
cs and cn are the specific and non-specific capture/removal rates, respectively, at which the specific and non-specific immune effectors eliminate parasites from the circulation. ss and sn are the specific- and non-specific-immunity proliferation rates, respectively, at which the specific and non-specific immune effectors are generated. Since cs, cn, ss, and sn are mathematical abstractions rather than known biological rates, we examined model output over a wide range of values, varying each of these parameters from 0.0001 to 1,000 by orders of magnitude.
x and y correspond biologically to the degree to which epitopes are shared between species, and thus to the ability of specific immune effectors generated against one species to cross-react with the other species. We assume here that the degree of specific-immunity cross-reactivity translates directly into the rate of parasite removal, and that 0 ≤ x, y < 1 (since it is unlikely that effectors generated against one parasite would recognize another parasite with higher affinity). Although elsewhere29 we explored conditions under which x ≠ y, here we assume x = y. Table 1 summarizes the variables and parameters considered in the model.
Table 1.
Summary of model variables and parameters
| Variable | Density represented | |
|---|---|---|
| V | Asexual blood-form density of Plasmodium vivax | |
| F | Asexual blood-form density of P. falciparum | |
| I | Density of non-specific immune effectors | |
| J | Density of P. vivax-specific immune effectors | |
| K | Density of P. falciparum-specific immune effectors | |
| Parameter | Rate represented | Value or range |
|
| ||
| A | Asexual blood-form replication rate of P. vivax | 1.28 |
| B | Asexual blood-form replication rate of P. falciparum | 1.39 |
| G | Gametocyte conversion rate | 0.04 |
| qs | Specific immunity decay rate | 0.01 |
| qn | Non-specific immunity deactivation rate | 0.6 |
| cs | Specific immunity capture/removal rate | 0.0001–1,000 |
| cn | Non-specific immunity capture/removal rate | 0.0001–1,000 |
| ss | Specific immunity proliferation rate | 0.0001–1,000 |
| sn | Non-specific immunity proliferation rate | 0.0001–1,000 |
| X | Cross-reactivity rate of P. falciparum-specific effectors | 0–1 |
| Y | Cross-reactivity rate of P. vivax-specific effectors | 0–1 |
The model was analyzed using two basic approaches. Equilibria were determined and analyzed using Mathematica 3.0 (Wolfram Research, Champaign IL); analytic solutions for P. vivax-P. falciparum infections are identical to those described elsewhere,29 except for the substitution of V for M. To observe the dynamics of the model over time, we integrated the system of equations, using fourth-order Runge-Kutta methods in the C programming language, with time intervals of 1/32 day over 365 days, and tested its behavior over a wide range of parameter space. For computer runs, we set initial merozoite densities at 0.01 parasites/μl of blood and initial I, J, and K densities at 0.00001/μl. Super-infection was approximated by maintaining the parasite density of the delayed parasite = 0 until a pre-determined time-delay was reached. Runs in which the parasitemia of either or both species exceeded 1,000,000/μl were considered fatal40 and discarded from analyses.
The administration of antimalarials was approximated by assuming a parasite killing rate consistent with published ranges of the parasite reduction ratios (PRRs, the fraction of parasites reduced per asexual life cycle).41 Since parasite growth was assumed to be asynchronous, a continuous PRR (k) was calculated from published values based on a 48-hr observation. To investigate conditions of drug-sensitive and drug-resistant P. falciparum, we tested treatment of mixed infections with both (I) quinine (to treat P. falciparum) and (II) a mefloquine/primaquine combination (to treat P. vivax in areas of P. vivax chloroquine resistance, or P. vivax cases with suspected mixed infection with chloroquine-resistant P. falciparum). For both quinine and mefloquine, PRR = 10–103;41 for PRR = 10, k = −1.45; PRR = 100, k = −2.30; PRR = 1,000, k = −3.45. Drug resistance was approximated by restricting drug action on the resistant parasite to the period of time before antimalarial (in this case, mefloquine) concentration decreased below the minimum parasiticidal concentration (MPC). We followed the example of White41 and used MPCresistant = 1,000 ng/ml of serum. Thus, given an initial serum concentration of mefloquine of 2,000 ng/ml, mefloquine will remain active for approximately 14 days, equivalent to its terminal elimination half-life.42 Plasmodium vivax relapse was approximated by resetting V = 0.01 at 16 days following quinine treatment and at 41 days following mefloquine/primaquine treatment, as extrapolated from the time at which P. vivax appears in the blood following treatment.14
RESULTS
Equilibria
Equilibrium analyses are presented in detail elsewhere.29 As in mixed P. malariae-P. falciparum infections, there are 4 stable equilibria (V*, F*, I*, J*, K*) for this system of equations: 1) the trivial equilibrium, at which all parasites have been eliminated and no immune effectors are present; 2) an equilibrium at which P. falciparum has been eliminated by the immune response and only P. vivax remains in the blood; 3) an equilibrium at which P. vivax has been eliminated by the immune response and only P. falciparum remains in the blood; and 4) an equilibrium at which both species coexist in the host. The equilibrium asexual-form parasitemias of P. vivax (V*) and P. falciparum (F*) can be readily expressed as functions of two products of immune-response rate coefficients, cnsn and csss.
For species coexistence (equilibrium 4), with the parameter values given above, it is necessary that for V* > 0, cnsn/csss < 676.4 – 736.4x, and for F* > 0, cnsn/csss > 676.4y − 736.4. Since y is always < 1, the second statement is always true, and species coexistence depends on whether the conditions of the first statement are met; note that x < 0.9185 (as cn, sn, cs, and ss are > 0). Most patterns of system equilibria closely resemble those in the P. malariae-P. falciparum model, but with the important difference that P. vivax can persist in coinfections at values of the ratio (cnsn)/(csss) that are up to 11 times greater than the maximum values at which P. malariae can persist. This capacity of P. vivax to persist under conditions of higher non-specific immunity indicates the importance of asexual replication rates in determining species survival within mixed-species infections.29
Dynamics: simultaneous infection
The intuitive nature of the 4 equilibria belies the complex patterns of dynamics that precede system equilibration. Under the assumptions noted above, when both species persist in the blood (i.e., when the conditions for equilibrium 4 are met), simultaneously-initiated infections exhibit several similarities over the entire range of tested parameters. First, following their initial appearance in the blood, both the P. falciparum and P. vivax populations reach maximum peaks within 13–24 days. For each species, this initial peak represents its highest asexual-form density of the infection, and for each it is followed by a sharp decrease to a parasitemia as much as 5 orders of magnitude below the initial peak. Peak heights follow the patterns described elsewhere.29
Following the initial peak, the behavior of the system becomes quite complicated and varies with parameter values. If specific immunity is greater than non-specific immunity, i.e., if csss > cnsn, the P. vivax and P. falciparum populations generally synchronize, entering cyclical patterns in which their peak values appear at approximately identical time points during the course of the infection (Figure 1A). If csss < cnsn, the species densities oscillate out-of-phase (Figure 1B). Increasing the cross-reactivities of specific immune responses (i.e., increasing x and y) generally dampens oscillations, lowering the peak—since each parasite must overcome a stronger immune response—and raising the trough parasitemias. Higher cross-reactivities also reduce the frequencies of oscillation of P. falciparum and P. vivax densities, since species succession is slower when the suppressed parasite must overcome cross-reactive specific immune effectors generated by the peak parasite. A comparison of P. vivax-P. falciparum and P. malariae-P. falciparum mixed infections indicates that greater values of a (the asexual form replication rate; P. vivax > P. malariae) produce both higher secondary peaks and higher oscillation frequencies of the coinfecting species.
Figure 1.
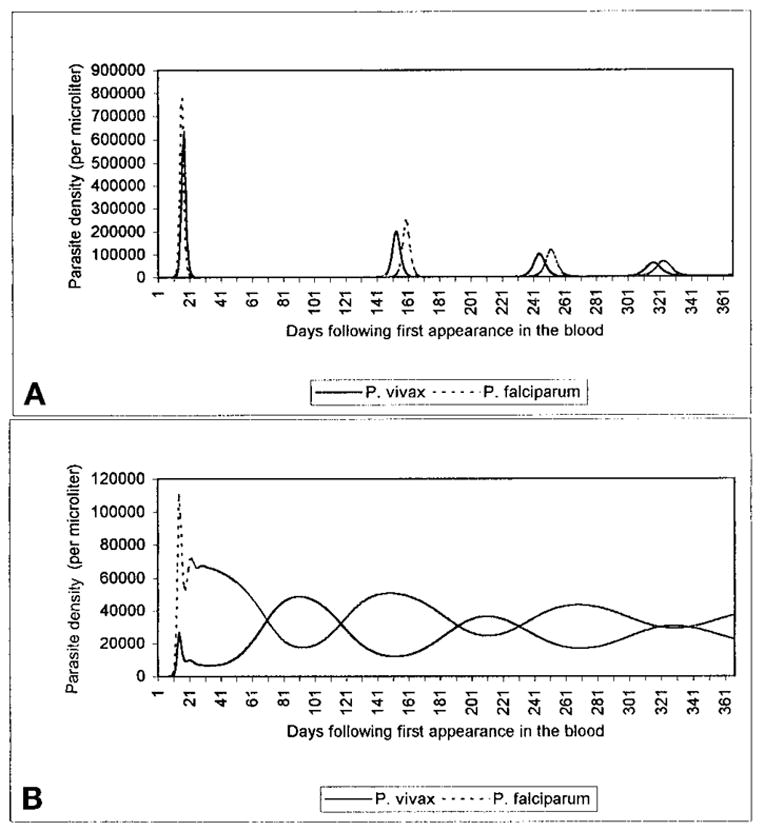
Dynamic patterns of Plasmodium vivax and P. falciparum populations in untreated mixed infections. As detailed in the text, particular ranges of parameters lead to patterns in which the two species oscillate nearly in phase with each other, with long periods in which both parasites may appear absent from the blood (A). Other ranges lead to out-of-phase oscillatory patterns, in which one species’ peak corresponds to the other’s trough (B). In A, x = y = 0, cs = 0.001, cn = 0.0001, ss = sn = 0.001; in B, x = y = 0, cs = 0.0001, cn = 0.01, ss = sn = 0.001.
Dynamics: Superinfection
Parasite dynamics following a superinfection of one species by the other vary with the timing of the superinfection. If P. vivax superinfects P. falciparum early in the infection, appearing in the blood during the period of an initial peak P. falciparum parasitemia (1 to 13–24 days), peak P. vivax parasitemia is lower than its peak when the species appear in the blood simultaneously. In contrast, if P. vivax superinfects a P. falciparum infection that has equilibrated at a lower density, P. vivax attains a higher peak parasitemia than under conditions of simultaneous appearance, and produces a secondary peak in P. falciparum density (Figure 2). The same phenomenon occurs when P. falciparum superinfects a low-level P. vivax infection. Finally, if P. vivax appears in the blood at least 1–2 days before P. falciparum, it can attain a peak parasitemia up to 4 times higher than when the species appear simultaneously, and can reduce the peak P. falciparum parasitemia by up to 28%. An example is given in Figure 3.
Figure 2.

Population dynamics of a mixed Plasmodium vivax-P. falciparum infection, in which P. vivax first appears in the blood (from relapse or superinfection) 150 days after the appearance of P. falciparum. P. falciparum stabilizes at approximately 11,600 parasites/μl prior to the appearance of P. vivax, falls to nearly sub-detectable levels following the appearance of P. vivax, then recrudesces to levels nearly three times (32,900 parasites/μl) its level prior to the appearance of P. vivax. Here, x = y = 0, cs = 0.001, cn = 0.01, ss = sn = 0.001.
Figure 3.
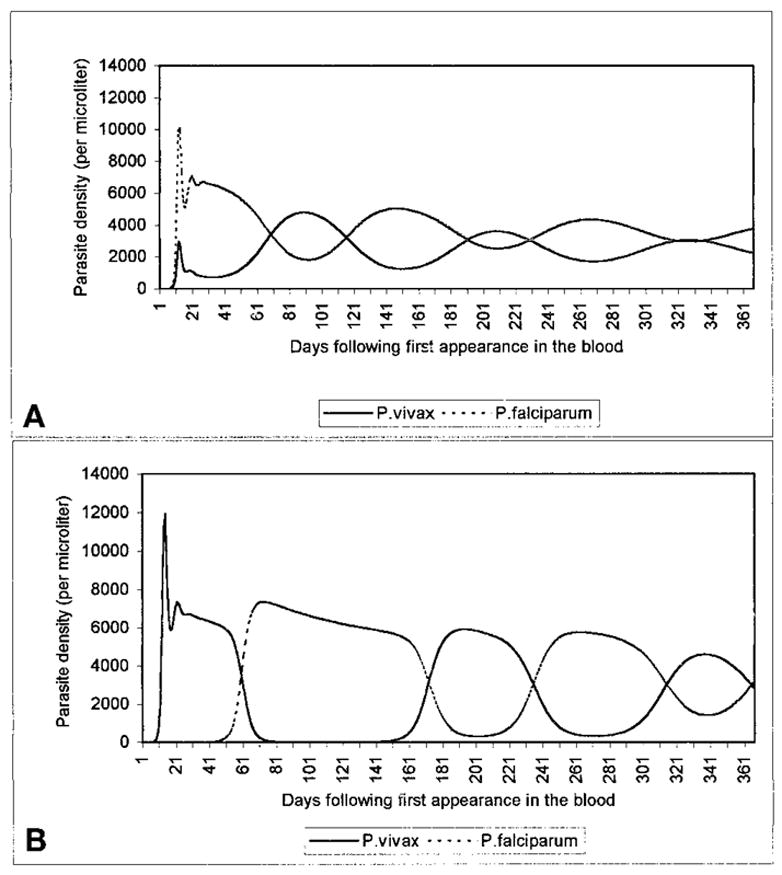
Population dynamics of a mixed Plasmodium vivax-P. falciparum infection, given a simultaneous appearance of the species (A), and a 10-day delay in P. falciparum appearance (B). As detailed in the text, an existing P. vivax infection can reduce peak levels of a subsequent P. falciparum superinfection (here from 10,100 to 7,400 parasites/μl). Here x = y = 0, cs = 0.001, cn = 0.001, ss = 0.001, sn = 0.1.
Note that the pre-erythrocytic stage of P. falciparum lasts 5.5–7 days, and that of P. vivax 6–8 days.43 Thus, on average, P. vivax sporozoites must be inoculated approximately a day before P. falciparum if the 2 are to appear simultaneously in the blood. Thus, all values refer to simultaneous blood appearance, not inoculation; simultaneous inoculation was approximated by delaying the appearance of P. vivax in the blood by 0.75 days.
Dynamics: drug treatment
Antimalarial treatment led to rapid decreases in parasitemia; as expected, the parasite clearance time was directly related to parasitemia at the time of antimalarial administration. Treatment with quinine led to elimination of both parasites, followed later by a relapse of P. vivax, first patent approximately 21 days after quinine administration (see Methods). In cases with mefloquine-resistant P. falciparum, treatment with mefloquine/primaquine led to the elimination of P. vivax and a rapid decrease in P. falciparum, followed by a P. falciparum recrudescence that began approximately 14 days after drug administration, but failed to reach patency (> 10 parasites/μl) for up to 40 days thereafter. Under conditions of both relapse and recrudescence, the surviving parasite exhibited a resurgence in parasitemia, to levels higher than those immediately preceding drug administration. Under conditions of low specific, and high non-specific immunity, this second peak was occasionally found to surpass the initial peak, although it was not possible to obtain the exact range of values at which this phenomenon occurs. Figure 4 shows examples of treatment with quinine and mefloquine/primaquine.
Figure 4.

A simulation of the effects of drug treatment in 2 patients with long-standing mixed-species infections, who arrive at a clinic after a month of intermittent fevers. Both patients are treated immediately, as follows: A, high Plasmodium vivax parasitemia relative to P. falciparum (35,000 versus 10,000 parasites/μl) leads to misdiagnosis as a single-species P. vivax infection. The patient is treated with mefloquine and primaquine on day 30 of the infection. P. vivax is eliminated, but mefloquine-resistant P. falciparum recrudesces once mefloquine concentration decreases below the minimum parasiticidal concentration for this resistant strain. B, high P. falciparum parasitemia relative to P. vivax (6,575 versus 720 parasites/μl) leads to misdiagnosis as a single-species P. falciparum infection. The patient is treated with quinine on day 30 of the infection. Both P. falciparum and P. vivax blood forms are eliminated but there is a relapse from P. vivax hypnozoites, following the elimination of quinine from the blood. In A, x = y = 0, cs = 0.001, cn = 0.01, ss = 0.001, sn = 0.001. In B, x = y = 0, cs = 0.001, cn = 0.001, ss = 0.001, sn = 0.01. In both A and B, drugs are given on day 30, parasite reduction ratio = 100.
DISCUSSION
Our model of P. vivax-P. falciparum blood-stage dynamics both approximates familiar observations and predicts some unexpected phenomena. A comparison of model output to the limited clinical data on mixed infections reveals several similarities. The nearly simultaneous initial peak parasitemias and subsequent alternating peaks correspond to observations by Boyd and Kitchen6,7 (Figure 5), while the finding that P. vivax attains much higher parasitemia when inoculated before (versus after or at the same time as) P. falciparum echoes that of Shute,12 noted above. Our model explains such interspecific suppression in terms of non-specific immunity, under which immune effectors raised by one species can act against the other. Thus, in reaching high asexual-form densities, P. falciparum generates a non-specific response that suppresses P. vivax. Plasmodium falciparum then remains at a high density until specific anti-P. falciparum responses combine with non-specific immunity to diminish P. falciparum sufficiently to allow a resurgence of P. vivax, which in turn stimulates a non-specific response that suppresses P. falciparum.
Figure 5.
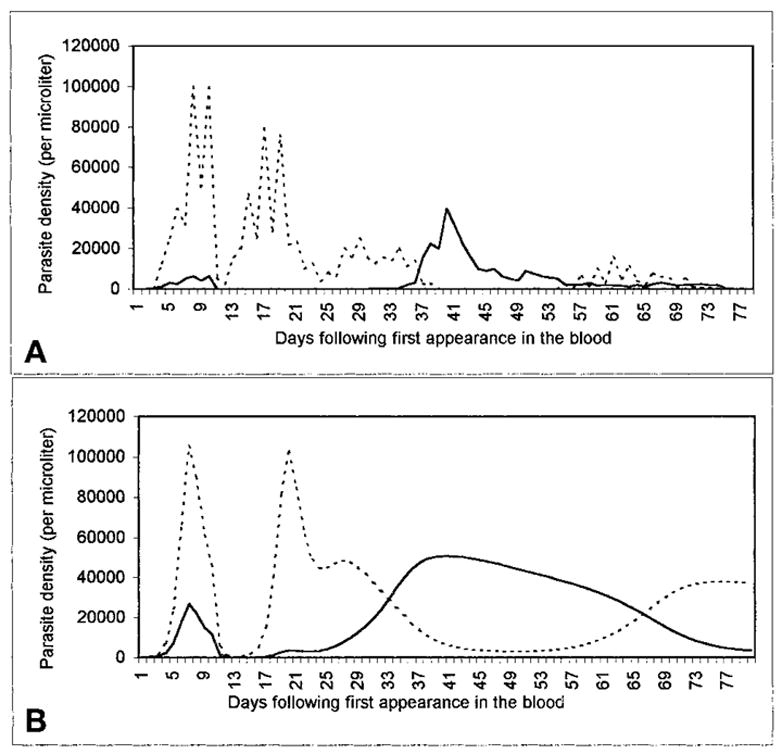
A, an infection-history curve from the malariatherapy treatment of a neurosyphilis patient, case 271–1126 (Boyd and Kitchen7). The vertical axis shows asexual-form parasitemia from microscopy-based estimates; the horizontal axis shows days. The time course of P. vivax (solid line) and P. falciparum (dotted line) parasitemia is shown following the inoculation of a patient (8 days earlier) by the feeding of a cage of Anopheles stephensi that had fed 28 days before on a patient infectious for P. falciparum and 21 days before on a patient infectious for P. vivax. The estimated detection threshold is 10 parasitized erythrocytes/μl. 10.5-grain doses of quinine were administered on days 8 and 9. B, a similar dynamic pattern from our model, incorporating treatment on day 8 with subcurative quinine (for which the minimum parasiticidal concentration [MPC]falciparum is reached in 2 days, the MPCvivax in 4). Here, x = y = 0, cs = 0.001, cn = 0.0001, ss = 0.0005, sn = 0.1.
Some results are less intuitive, notably that P. vivax superinfection of an existing P. falciparum infection leads to subsequent increases in P. falciparum parasitemia. In this situation, the non-specific and cross-specific immune responses generated by P. vivax initially lead to a reduction in P. falciparum density; the density of P. falciparum-specific immune effectors (K) decreases as a result, although after a time-lag. Thus, when P. vivax density eventually decreases, and P. falciparum recrudesces, there is a lower P. falciparum-specific-immune response present to suppress it; consequently, it attains a higher parasitemia than that immediately before the P. vivax superinfection. This possibility is particularly important in mixed infections involving P. vivax, since P. vivax can reappear in the blood following either a new inoculation or a relapse from liver hypnozoites; the potential for a P. falciparum resurgence triggered by a P. vivax relapse indicates an unexpected hazard of malaria infections that might be considered benign. Stable low-level P. falciparum parasitemia may suggest the familiar concept of pre-munition; our model indicates that a disruption might lead to a resurgence in parasitemia, perhaps with clinical consequences.
Plasmodium malariae superinfection can produce the same general effect, although it is much less pronounced. Due to the greater asexual-form multiplication rate of P. vivax, immunity raised by P. vivax causes P. falciparum density to decrease further than does P. malariae in a comparable mixed infection, but, as a consequence (due to the decrease in specific immunity), to increase to a higher subsequent peak. An interesting practical consequence is that in addition to the other challenges of detecting and differentiating the species, the likelihood of detecting P. falciparum in a mixed P. falciparum-P. malariae infection may be reduced, and the prevalence of mixed infections under-reported. More generally, the likelihood of detecting any of the species in a mixed-species infection may depend not only on methodology and the characteristics of each species, but on the relative timing of inoculation with each species.
In contrast to the deleterious side effects of P. vivax superinfection, we found that an existing P. vivax infection could substantially reduce the peak parasitemia of a P. falciparum superinfection, provided that P. vivax appeared in the blood at least 1–2 days before P. falciparum. This parallels our findings with mixed P. malariae-P. falciparum infections: if P. malariae entered the blood at least 12 days before P. falciparum, its peak parasitemia was up to 500 times higher than in the case of simultaneous appearance, and peak P. falciparum levels were reduced by up to 50%.29
Many factors confound the relationship between parasitemia and disease,41 but there is generally a loose positive correlation between circulating parasite load and clinical status.44 It seems likely that one primary factor that lowers the correlation is that only a fraction of P. falciparum parasites appear in the peripheral circulation, and that total parasite density (as considered in our model) is more closely correlated. Thus, overall our model suggests that P. vivax-P. falciparum interactions in mixed infections can have profound clinical effects in both uncomplicated malaria (perhaps by maintaining P. falciparum densities below fever threshold) and severe cases. This suggestion is supported by the clinical findings of Luxemburger and others,26 who reported that severe malaria was 4.2 times more common in patients with only P. falciparum infections than in those with mixed P. falciparum-P. vivax infections. Maitland and others24 have proposed that the protective potential of P. vivax may be so strong that α-thalassemias are positively selected in a population by predisposing individuals to P. vivax infections and thereby protecting them against P. falciparum. Our model indicates that the interspecific interactions may be quite complicated, with the timing of the species infections determining whether P. vivax ameliorates or exacerbates subsequent P. falciparum infection.
Perhaps the most intriguing results for clinicians concern drug treatment. In our model, the interval from drug treatment to P. falciparum recrudescence is generally longer than to P. vivax relapse; treatment usually diminishes P. falciparum parasitemia to a level below that of an initial post-hepatic merozoite cohort, and thus it takes longer to recrudesce to patent levels. This also suggests that some P. vivax relapses might actually be recrudescences, especially in drug-resistant cases. Numerous reports have documented P. vivax relapse following drug treatment for what was presumed to be a single-species P. falciparum infection.13,14,45,46 The interval between treatment and relapse depends on the half-life of the drug administered. For example, Looareesuwan and others47 found that 33–40% of patients treated with different anti-P. falciparum artemether regimens exhibited P. vivax relapse within a 28-day period, while none of those treated with mefloquine (with a half-life nearly 30 times that of quinine)42 relapsed during the same follow-up period. More importantly, if one of the parasites in a mixed infection is resistant to the antimalarial, it may surge in density after the other parasite is removed (Figure 4).
The possibility that recrudescence may follow drug treatment emphasizes the clinical importance of accurate, specific diagnoses. Recent studies have pointed to highly relevant limitations of traditional microscopy-based detection techniques.48,49 For example, through acridine-orange staining, nested polymerase chain reaction, and microtiter-plate hybridization techniques, Zhou and others50 demonstrated that up to one-third of infections diagnosed in patients on the Thailand-Myanmar border by Giemsastain microscopy as single-species P. falciparum and two-thirds of those diagnosed as single-species P. vivax were mixed-species infections. Our model suggests that such diagnostic discrepancies may have severe clinical consequences.
Although we have focused on mixed-species infections, this result may also be applicable to single-species, mixed-phenotype infections. Indeed, an extension of our model suggests that in a mixed-phenotype (drug-resistant and drug-susceptible) P. falciparum infection, treatment with an ineffective drug leads to higher densities of the resistant parasite, and by doing so might aid the spread of resistance. Such interactions await further theoretical and empirical investigation.
Although our model incorporates human immune responses as the critical media of parasite interaction, we have neglected a number of complexities that merit further attention. First, P. vivax might reduce P. falciparum parasitemia by initiating fever. Indeed, the pyrogenic threshold of P. vivax is much lower than that of P. falciparum (150–200 versus 1,500–10,000 parasites/μl).51,52 In our model, even under conditions of simultaneous appearance in the blood, in which P. falciparum growth greatly exceeded that of P. vivax, P. vivax usually reached its pyrogenic density first. Second, since P. malariae prefers mature erythrocytes and P. falciparum appears to prefer younger cells,53,54 in our previous model we did not consider red blood cell competition as an important factor. However, since P. vivax selectively invades reticulocytes, red blood cell competition (as well as P. falciparum-induced dyserythropoesis)55 may be an important factor in mixed P. vivax-P. falciparum infections, as may interspecific competition for nutrients in the bloodstream. Third, if interspecific cross-immunity does exist, it is possible that it is anti-immune rather than anti-parasite. Our study does not eliminate the possibility of an anti-immune cross-protection, but suggests that it is possible for protection to be gained by anti-parasite effects alone. Fourth, continuous parasite growth is only an approximation; P. vivax in particular can be highly synchronous.51 An integration of our model with models of parasite synchronization,56 and of antigenic variation57 would be of great interest. Finally, although we have focussed on the clinically important aspects of mixed infections, we have focussed on asexual blood forms and have not explicitly considered gametocytes, the dynamics of which are clearly critical to species interactions, including their geographic and seasonal distributions.
Acknowledgments
We gratefully acknowledge the support of the Maurice Pechet Foundation, and the contributions of W. H. Bossert, N. J. White, S. Looareesuwan, S. Supavej, B. C. Sorkin, two anonymous reviewers, the Countway and Mayr Libraries at Harvard University, and the libraries of Mahidol University, Faculty of Tropical Medicine, and United States Army Research Institute (Bangkok, Thailand).
Financial support: Daniel P. Mason is supported by a Henry Luce Scholarship. F. Ellis McKenzie is supported by a National Research Service Award from the National Institutes of Health.
References
- 1.Cohen JE. Heterologous immunity in human malaria. Q Rev Biol. 1973;48:467–489. doi: 10.1086/407705. [DOI] [PubMed] [Google Scholar]
- 2.Richie TL. Interactions between malaria parasites infecting the same vertebrate host. Parasitology. 1988;96:607–639. doi: 10.1017/s0031182000080227. [DOI] [PubMed] [Google Scholar]
- 3.McKenzie FE, Bossert WH. Mixed-species Plasmodium infections of humans. J Parasitol. 1997;83:583–600. [PMC free article] [PubMed] [Google Scholar]
- 4.McKenzie FE, Bossert WH. Multi-species Plasmodium infections of humans. J Parasitol. 1999;85:12–18. [PMC free article] [PubMed] [Google Scholar]
- 5.McKenzie FE, Bossert WH. Mixed-species Plasmodium infections of Anopheles (Diptera: Culicidae) J Med Entomol. 1997;34:417–425. doi: 10.1093/jmedent/34.4.417. [DOI] [PMC free article] [PubMed] [Google Scholar]
- 6.Boyd MF, Kitchen SF. Simultaneous inoculation with Plasmodium vivax and Plasmodium falciparum. Am J Trop Med. 1937;17:855–861. [Google Scholar]
- 7.Boyd MF, Kitchen SF. Vernal vivax activity in persons simultaneously inoculated with Plasmodium vivax and Plasmodium falciparum. Am J Trop Med. 1938;18:505–514. [Google Scholar]
- 8.Wenyon CM. Protozoology: A Manual for Medical Men, Veterinarians, Zoologists. London: Balliere, Tindall, and Cox; 1926. [Google Scholar]
- 9.James SP. Some general results of a study of induced malaria in England. Trans R Soc Trop Med Hyg. 1931;24:477–525. [Google Scholar]
- 10.Morishita K. Notes on mixed malarial infection, with special reference to antagonism among different species of malarial parasites, and their segregation by the use of special drugs. J Formos Med Assoc. 1931;3:68–70. [Google Scholar]
- 11.Mayne B, Young MD. Antagonism between species of malaria parasites in induced mixed infections. Public Health Rep. 1938;53:1289–1291. [Google Scholar]
- 12.Shute PG. Latency and long-term relapses in benign tertian malaria. Trans R Soc Trop Med Hyg. 1946;40:189–200. doi: 10.1016/0035-9203(46)90056-9. [DOI] [PubMed] [Google Scholar]
- 13.Meek SR, Doberstyn EB, Gauzere BA, Thanapanich C, Nordlander E, Phuphaisan S. Treatment of falciparum malaria with quinine and tetracycline or combined mefloquine, sulfadoxine, pyrimethamine on the Thai-Kampuchean border. Am J Trop Med Hyg. 1986;35:246–250. doi: 10.4269/ajtmh.1986.35.246. [DOI] [PubMed] [Google Scholar]
- 14.Looareesuwan S, White NJ, Chittamas S, Bunnag D, Harinasuta T. High rate of Plasmodium vivax relapse following treatment of falciparum malaria in Thailand. Lancet. 1987;2:1052–1055. doi: 10.1016/s0140-6736(87)91479-6. [DOI] [PubMed] [Google Scholar]
- 15.Garnham PCC, Lainson R, Gundars AE. Some observations on malaria parasites in a chimpanzee, with particular reference to the persistence of Plasmodium reichenowi and P. vivax. Ann Soc Med Trop Belg. 1956;36:813–821. [PubMed] [Google Scholar]
- 16.Prakash S, Chakrabarti SC. The isolation and description of Plasmodium cynomolgi (Mayer, 1907) and Plasmodium inui (Halberstadter and Prowazek, 1907) from naturally occurring mixed infections in Macaca radiata radiata monkeys of the Nilgiris, Madras State, India. Indian J Malariol. 1962;16:158–166. [Google Scholar]
- 17.Cox FEG. Protective immunity between malaria parasites and piroplasms in mice. Bull World Health Organ. 1970;43:325–336. [PMC free article] [PubMed] [Google Scholar]
- 18.McColm AA, Dalton L. Heterologous immunity in rodent malaria: comparison of the degree of cross-immunity generated by vaccination with that produced by exposure to live infection. Ann Trop Med Parasitol. 1983;77:355–377. doi: 10.1080/00034983.1983.11811724. [DOI] [PubMed] [Google Scholar]
- 19.Snounou G, Bourne T, Jarra W, Viriyakosol S, Wood JC, Brown KN. Assessment of parasite population dynamics in mixed infections of rodent plasmodia. Parasitology. 1992;105:363–374. doi: 10.1017/s0031182000074539. [DOI] [PubMed] [Google Scholar]
- 20.Jeffery GM. Epidemiological significance of repeated infections with homologous and heterologous strains and species of Plasmodium. Bull World Health Organ. 1966;35:873–882. [PMC free article] [PubMed] [Google Scholar]
- 21.Molineaux L, Storey J, Cohen JE, Thomas A. A longitudinal study of human malaria in the West African savanna in the absence of control measures: relationships between different Plasmodium species, in particular P. falciparum and P. malariae. Am J Trop Med Hyg. 1980;29:725–737. doi: 10.4269/ajtmh.1980.29.725. [DOI] [PubMed] [Google Scholar]
- 22.Black J, Hommel M, Snounou G, Pinder M. Mixed infections with Plasmodium falciparum and P. malariae and fever in malaria. Lancet. 1994;343:1095. doi: 10.1016/s0140-6736(94)90203-8. [DOI] [PubMed] [Google Scholar]
- 23.Maitland K, Williams TN, Bennett Newbold CI, Peto TEA, Viji J, Timothy R, Clegg JB, Weatherall DJ, Bowden DK. The interaction between Plasmodium falciparum and P. vivax in children on Espiritu Santo island, Vanuatu. Trans R Soc Trop Med Hyg. 1996;90:614–620. doi: 10.1016/s0035-9203(96)90406-x. [DOI] [PubMed] [Google Scholar]
- 24.Maitland K, Williams TN, Newbold CI. Plasmodium vivax and P. falciparum: biological interactions and the possibility of cross-species immunity. Parasitol Today. 1997;13:227–231. doi: 10.1016/s0169-4758(97)01061-2. [DOI] [PubMed] [Google Scholar]
- 25.Williams TN, Maitland K, Bennett S, Ganczakowski M, Peto TE, Newbold CI, Bowden DK, Weatherall DJ, Clegg JB. High incidence of malaria in alpha-thalassaemic children. Nature. 1996;383:522–525. doi: 10.1038/383522a0. [DOI] [PubMed] [Google Scholar]
- 26.Luxemburger C, Ricci F, Nosten F, Raimond D, Bathet S, White NJ. The epidemiology of severe malaria in an area of low transmission in Thailand. Trans R Soc Trop Med Hyg. 1997;91:256–262. doi: 10.1016/s0035-9203(97)90066-3. [DOI] [PubMed] [Google Scholar]
- 27.Gopinathan VP, Subramanian AR. Pernicious syndromes in Plasmodium infections. Med J Aust. 1982;2:568–572. [PubMed] [Google Scholar]
- 28.Gopinathan VP, Subramanian AR. Vivax and falciparum malaria seen at an Indian service hospital. J Trop Med Hyg. 1986;89:51–55. [PubMed] [Google Scholar]
- 29.Mason DP, McKenzie FE, Bossert WH. The blood-stage dynamics of mixed Plasmodium malariae-P. falciparum infections. J Theor Biol. 1999;198:549–566. doi: 10.1006/jtbi.1999.0932. [DOI] [PubMed] [Google Scholar]
- 30.Garnham PCC. Malaria Parasites and other Haemosporidia. Oxford: Blackwell Scientific Publications; 1966. [Google Scholar]
- 31.Garnham PCC. Malaria parasites of man: life-cycles and morphology (excluding ultrastructure) In: Wernsdorfer WH, McGregor I, editors. Malaria. Edinburgh: Churchill Livingstone; 1988. pp. 61–96. [Google Scholar]
- 32.Anderson RM, May RM, Gupta S. Non-linear phenomena in host-parasite interactions. Parasitology. 1989;99:S59–S79. doi: 10.1017/s0031182000083426. [DOI] [PubMed] [Google Scholar]
- 33.McKenzie FE, Bossert WH. The dynamics of Plasmodium falciparum blood-stage infection. J Theor Biol. 1997;188:127–140. doi: 10.1006/jtbi.1997.0478. [DOI] [PubMed] [Google Scholar]
- 34.McKenzie FE, Bossert WH. A target for intervention in Plasmodium falciparum infections. Am J Trop Med Hyg. 1998;58:763–767. doi: 10.4269/ajtmh.1998.58.763. [DOI] [PMC free article] [PubMed] [Google Scholar]
- 35.Carter R, Miller LH. Evidence for environmental modulation of gametocytogenesis in Plasmodium falciparum in continuous culture. Bull World Health Organ. 1979;57(suppl 1):37–52. [PMC free article] [PubMed] [Google Scholar]
- 36.Mohaptra SSS, Govardhini P, Jambulingam P, Pani SP. Some observations on Plasmodium falciparum gametocytemia in natural infections in an endemic area of Koraput district, Orissa. Indian J Malariol. 1992;29:69–72. [PubMed] [Google Scholar]
- 37.Janeway CA, Travers P. Immunobiology. New York: Garland Publishing; 1997. [Google Scholar]
- 38.McKenzie FE, Bossert WH. The optimal production of gametocytes by Plasmodium falciparum. J Theor Biol. 1998;193:419–428. doi: 10.1006/jtbi.1998.0710. [DOI] [PubMed] [Google Scholar]
- 39.Antia R, Koella JC. A model of non-specific immunity. J Theor Biol. 1994;168:141–150. doi: 10.1006/jtbi.1994.1094. [DOI] [PubMed] [Google Scholar]
- 40.Coatney GR, Collins WE, Warren M, Contacos PG. The Primate Malarias. Bethesda, MD: U.S. Department of Health, Education, and Welfare; 1971. [Google Scholar]
- 41.White NJ. Assessment of the pharmacodynamic properties of antimalarial drugs in vivo. Antimicrob Agents Chemother. 1997;41:1413–1422. doi: 10.1128/aac.41.7.1413. [DOI] [PMC free article] [PubMed] [Google Scholar]
- 42.White NJ. Clinical pharmacokinetics of the antimalarial drugs. Clin Pharmacokinet. 1985;10:187–215. doi: 10.2165/00003088-198510030-00001. [DOI] [PubMed] [Google Scholar]
- 43.Gilles HM. The malaria parasites. In: Gilles HM, Warrell DA, editors. Bruce-Chwatt’s Essential Malariology. London: Edward Arnold; 1993. pp. 13–36. [Google Scholar]
- 44.Field JW. Blood examination and prognosis in acute falciparum malaria. Trans R Soc Trop Med Hyg. 1949;43:33–48. doi: 10.1016/0035-9203(49)90022-x. [DOI] [PubMed] [Google Scholar]
- 45.Looareesuwan S, Viravan C, Vanijanonta S, Wilairatana P, Charoenlarp P, Canfield CJ, Kyle DE. Randomized trial of mefloquine-doxycycline, and artesunate-doxycycline for treatment of acute uncomplicated falciparum malaria. Am J Trop Med Hyg. 1994;50:784–789. doi: 10.4269/ajtmh.1994.50.784. [DOI] [PubMed] [Google Scholar]
- 46.Looareesuwan S, Vaninjanonta S, Viravan C, Wilairantana P, Charonelarp P, Lasserre R, Canfield C, Kyle DE. Randomised trial of mefloquine-tetracycline and quinine-tetracycline for acute uncomplicated falciparum malaria. Acta Trop. 1994;57:47–53. doi: 10.1016/0001-706x(94)90092-2. [DOI] [PubMed] [Google Scholar]
- 47.Looareesuwan S, Wilarairatana P, Viravan C, Vanijanonta S, Pitisuttitum P, Kyle DE. Open randomized trial of oral artemether alone and a sequential combination with mefloquine for acute uncomplicated falciparum malaria. Am J Trop Med Hyg. 1997;56:613–617. doi: 10.4269/ajtmh.1997.56.613. [DOI] [PubMed] [Google Scholar]
- 48.Snounou G, Viriyakosol S, Jarra W, Thaitong S, Brown KN. Identification of the four human malaria parasite species in field samples by the polymerase chain reaction and detection of a high prevalence of mixed infections. Mol Biochem Parasitol. 1993;58:282–292. doi: 10.1016/0166-6851(93)90050-8. [DOI] [PubMed] [Google Scholar]
- 49.Postigo M, Mendoza-Leon A, Perez HA. Malaria diagnosis by the polymerase chain reaction: a field study in southeastern Venezuela. Trans R Soc Trop Med Hyg. 1998;92:509–511. doi: 10.1016/s0035-9203(98)90893-8. [DOI] [PubMed] [Google Scholar]
- 50.Zhou M, Liu Q, Wongsrichanalai C, Suwonkerd W, Panart K, Prajakwong S, Pensiri A, Kimura M, Matsuoka H, Ferreira MU, Isomura S, Kawamoto F. High prevalence of Plasmodium malariae and Plasmodium ovale in malaria patients along the Thai-Myanmar border, as revealed by acridine orange staining and PCR-based diagnoses. Trop Med Int Health. 1998;3:304–312. doi: 10.1046/j.1365-3156.1998.00223.x. [DOI] [PubMed] [Google Scholar]
- 51.Kitchen SF. Vivax malaria. In: Boyd MF, editor. Malariology. Philadelphia: W. B. Saunders; 1949. pp. 1027–1045. [Google Scholar]
- 52.Luxemburger C, Thwai KL, White NJ, Webster HK, Kyle DE, Maelankirri L, Chongsuphanjaisiddhi T, Nosten F. The epidemiology of malaria in a Karen population on the western border of Thailand. Trans R Soc Trop Med Hyg. 1996;90:105–111. doi: 10.1016/s0035-9203(96)90102-9. [DOI] [PubMed] [Google Scholar]
- 53.Kitchen SF. Quartan malaria. In: Boyd MF, editor. Malariology. Philadelphia: W. B. Saunders; 1949. pp. 1017–1026. [Google Scholar]
- 54.Pasvol G, Weatherall DJ, Wilson RJM. The increased susceptibility of young red cells to invasion by the malarial parasite Plasmodium falciparum. Br J Haematol. 1980;45:285–295. doi: 10.1111/j.1365-2141.1980.tb07148.x. [DOI] [PubMed] [Google Scholar]
- 55.Abdallah SH, Weatherall DJ, Wickramasinghe SN, Hughes M. The anaemia of P. falciparum malaria. Br J Haematol. 1980;46:171–183. doi: 10.1111/j.1365-2141.1980.tb05956.x. [DOI] [PubMed] [Google Scholar]
- 56.Kwiatkowski D, Greenwood BM. Why is malaria fever periodic? Parasitol Today. 1989;5:164–166. doi: 10.1016/0169-4758(89)90261-5. [DOI] [PubMed] [Google Scholar]
- 57.Antia R, Nowak MA, Anderson RM. Antigenic variation and the within-host dynamics of parasites. Proc Nat Acad Sci USA. 1996;93:985–989. doi: 10.1073/pnas.93.3.985. [DOI] [PMC free article] [PubMed] [Google Scholar]