

Abstract
We assess the consequences of competition for red blood cells (RBCs) in co-infections with the two major agents of human malaria, Plasmodium vivax and Plasmodium falciparum, using differential equations to model the population dynamics of RBCs and parasites. P. vivax parasitizes only the youngest RBCs, but this can reduce the broader RBC population susceptible to P. falciparum. We found that competition for RBCs typically causes one species to suppress the other, depending on their relative reproduction rates and timing of inoculation. However, if the species’ reproduction rates are nearly equal, transient increases in RBC production stimulated by the presence of P. falciparum may boost P. vivax parasitemia above its single-species infection level. Conversely, P. falciparum parasitemia is rarely enhanced above its single-species level. Furthermore, transients in RBC production can induce coupled oscillations in the parasitemia of both species. These results are remarkably robust to changes in model parameters.
INTRODUCTION
Malaria infection begins with inoculation of Plasmodium parasites from an Anopheles mosquito into a host's blood. Parasites penetrate the host's liver cells, multiply there for ∼ 1 week, and, as asexual “merozoite” forms, emerge to invade red blood cells (RBCs). The merozoites multiply, burst the RBCs, and release 8−32 merozoites per RBC, which in turn invade more RBCs to continue the cycle. This blood stage asexual replication cycle is associated with exponential growth in parasite numbers and with fever, anemia, and organ complications.
Human malaria is caused by four species of Plasmodium that co-exist in various combinations in endemic regions. Although P. falciparum is responsible for most of the mortality attributed directly to malaria, P. vivax induces enormous morbidity worldwide, despite its virtual absence from sub-Saharan Africa.1,2 Mixed P. vivax–P. falciparum infections in humans can arise through sequential bites by singly infected mosquitoes or a single bite by a dually infected mosquito.3 Also possible is concurrent activation of latent P. vivax liver stages. Most cross-sectional surveys of human populations have shown deficits of P. vivax–P. falciparum infections, relative to the frequencies expected if species infections were independent.4,5 However, modern polymerase chain reaction (PCR)-based studies6,7 and statistical-mathematical analyses8,9 suggest that these deficits may be a consequence of infection dynamics: because peaks of parasitemia in a mixed P. vivax–P. falciparum infection typically alternate between the species,10,11 apparent deficits at the population level may reflect the detection thresholds of microscopy and the biologic interactions between parasites in infected individuals. In hindsight, this connection is implicit in classic longitudinal studies.12,13 Recent studies confirm that mixed-species infections are far more common than is generally recognized.14,15 Perhaps 30−50% of all malaria infections recorded in Thailand are mixed P. vivax–P. falciparum.16,17
The dynamics of mixed P. vivax–P. falciparum infections present serious challenges for interventions at the individual and population levels: misdiagnosis and corresponding drug treatment can allow the cryptic species to rebound, with severe clinical consequences.18,19 Furthermore, if P. vivax infections temper the severity of P. falciparum pathology,20,21 an anti-P. vivax vaccine22 may have unanticipated adverse effects. Hence, it is crucial to move from phenomenological observation to more detailed mechanistic understanding of species interactions.
Although anemia is a common manifestation of malaria and a common cause of death in P. falciparum infections, no previous analyses of mixed-species malaria infections have taken into account the dynamics of the host RBC population. RBCs are the substrate on which the blood stages of Plasmodium species interact and compete for resources. P. falciparum can invade RBCs of all ages, whereas RBC susceptibility to P. vivax is restricted to the youngest age class, the reticulocytes.1,23 The great disparity in anemia-induced mortality is generally attributed to this distinction.24 Host hematopoetic responses to malaria infection may be critical, but remain poorly understood: they seem to vary between individuals and can include either compensatory RBC production or diserythropoesis.25
We recently used differential equation models for RBC–Plasmodium dynamics to examine the consequences of age-structured RBC invasion and host erythropoetic response for the dynamics of single-species malaria infections.26 Although these models did not include explicit host immune responses, they provided insights into parasite–RBC interactions. For example, we found that without an aggressive host immune response, reticulocyte depletion during P. vivax infection chokes off the supply of mature RBCs, producing catastrophic anemia even if the fraction of RBCs infected remains < 1%. This result is in line with a recent report that hemoglobin concentrations in persistent low-level P. vivax infections are disproportionately suppressed compared with the percentage of RBCs infected.27 Also, we found that a compensatory response to RBC loss would enhance parasitemia and accelerate anemia by increasing the density of susceptible RBCs. Here we extend our analytic framework to encompass the more complex circumstances of mixed P. vivax–P. falciparum infections, again with the aim of discovering constraints and imperatives that RBC dynamics impose on malaria parasites and host responses. In particular, we wondered if competition for RBCs in a mixed-species infection could enable one species to facilitate the other.
MATERIALS AND METHODS
Model formulation
We constructed a set of compartmental ordinary differential equations (CODEs) to model RBC dynamics and mixed P. vivax–P. falciparum infections, as shown schematically in Figure 1. We used CODEs because their solutions closely mimic the mean properties of an ensemble of developing cells.28,29 Details of the model and the method of solution are provided in the mathematical appendix below. In the CODEs, an affinity parameter ζ (with different values for different Plasmodium species) represents the ability of merozoites to find and bind to a target RBC. We assume that the lifespan of a circulating RBC is 120 days, that the reticulocyte stage spans ∼ 36 hours after RBC release from the bone marrow,30 and that P. vivax invasion is restricted to reticulocytes.1 (We also did a small number of simulations with an assumption that P. vivax could attack RBCs of up to 14 days of age, based on a report suggesting that young RBCs beyond the reticulocyte stage might still be vulnerable to this species.31) Although there are reports that P. falciparum shows a preference for young RBCs,32 our earlier results indicate that these data should be interpreted with some caution, because the proportion of RBCs in young age classes always increases as a P. falciparum infection proceeds.26 Thus, we followed convention and assumed that P. falciparum has the same affinity for RBCs of any age. Note that our model could also be construed as representing dual phenotype P. falciparum infections in which one phenotype attacks only reticulocytes.
Figure 1.
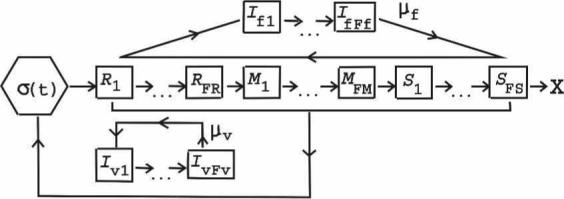
Schematic of model dynamics. The bone marrow source of new RBCs is labeled as σ(t). RBC stages R1–RFR are the reticulocytes, M1–MFM are the mature stages, and S1–SFS are the senescent stages (with X marking the natural end of the RBC lifespan). Only reticulocytes are vulnerable to P. vivax, but RBCs of all ages are assumed to be susceptible to P. falciparum. Iv1–IvFv and If1–IfFf are the RBCs infected with the developing stages of P. vivax or P. falciparum, respectively; μv and μf are the corresponding free merozoite stages. RBC production is regulated by the rate at which RBCs are lost through both normal senescence and infection; 2 × 10⁴ hours of infection are simulated in each run of the model unless the uninfected RBC count falls below 75% of its initial value (catastrophic anemia).
Based on what is known about the development of P. vivax and P. falciparum,1,2,26 we assumed that after the initial liver stage, 0.002 μL−1 merozoites are rapidly released into the blood. (The release of merozoites from the liver signals the start of infection in our simulations.) The average development time in infected RBCs is 48 hours. For both species, we take the average clearance time of free merozoites from the blood as τmer = 6 minutes.33 We take P = 16 for P. falciparum and P = 16 or 8 for P. vivax. Although multiple infections of RBCs are possible, they are rare31; for simplicity, we ignored them. We did not consider the development of merozoites into gametocytes, the non-replicating sexual blood forms that, taken up in an Anopheles blood meal, continue the mosquito–human cycle.34 Nor do we consider the possible effects of synchronization among asexual blood forms35 or destruction of uninfected RBCs.36 Recent work suggests that sequestered P. falciparum–infected RBCs are capable of wide dissemination of released merozoites37; thus, we ignore the sequestration of infected RBCs, because in our model, merozoite–RBC binding indirectly mediates interaction between the Plasmodium species.
The immune responses that controls most malaria infections are not well understood and are likely to be multi-component and sensitive to the developmental stage of the parasite,38 so the model does not attempt to incorporate them directly. Our intent here is to investigate the constraints and imperatives RBC dynamics impose on infection dynamics. (In the Discussion below, we return to the question of the immune effects.) However, the host is not passive in this model. First, the host dies of catastrophic anemia if the RBC count declines to 75% of the basal count. In addition, we examine three models for host response to the added RBC loss because of infection: 1) RBC production increases proportionally to the extra rate of RBC loss, up to twice the basal rate (“compensatory” response). 2) RBC production decreases proportionally to the infection-induced loss, down to 0.8 times the basal rate (“diserythropoetic” response), and 3) RBC production remains fixed at the basal rate needed to maintain 5 × 10⁶ RBC/μL in a healthy host (∼ 1,736 RBC μL−1h−1).30 For models 1 and 2, the time constant in response changes in the RBC count is 48 hours,30 and reduction in RBC loss allows a return to homeostasis. Details are explained in the mathematical appendix.
Basic reproduction rate
We showed previously by probability arguments that the mean number of descendants produced by an infected RBC is
where V is the density of RBCs susceptible to the infecting species.26 R is a dynamical quantity that changes during the course of an infection (but never exceeds p). In our model, τMER, p, and ζ are fixed: dynamic changes in R develop from changes in V. (If a dynamic immune response were present, p, τMER, and ζ could change as well, depending on the component of the response.) The initial value of R at the beginning of infection, R0, is of major importance in a single-species infection: if R0 < 1 the parasite does not persist in the host, but if R0 > 1 the parasite population can reach a steady state or produce catastrophic anemia. We refer to R0 as the basic reproductive rate of a species (or phenotype). We take the initial V for P. falciparum as the basal total RBC count (5 × 10⁶ μL−1), and for P. vivax as the reticulocyte count of a healthy host, (τret/120 days) × 5 × 10⁶ μL−1, where τret = duration of the reticulocyte stage in days. (If τret = 1.5 day, V = 6.25 × 10⁴ μL−1.) R0F and R0V refer to R0 for P. falciparum and P. vivax, respectively. Thus, if p = 16 for both species and τmer = 6 minutes, R0F = R0V implies that the affinity ζ of P. vivax for reticulocytes is > 100 times the ζ of P. falciparum for RBCs of all ages.
Strategy for simulation
Our goal was to comprehensively map the model's behavior in its parameter space. To this end, we simulated 2× 10⁴ hours of infection (or until the host died) for 26 values of R0 for each species, with p = 16 for both species and with RBCs vulnerable to P. vivax for 1.5 days, with R0 values ranging from R0 = 1 + 1/64 = 1.015625 (barely persistent) to R0 = 15 (extremely pathogenic). The values of R0 we chose to examine are equally spaced in log(R0 – 1) between log(1/64) and log(14). With p = 16, this range in R0 corresponds to a 220-fold difference in the size of ζ. In addition, we used the first 23 of these R0 values (from 1.015625 to ∼ 7.19) to investigate the effects of setting P = 8 for P. vivax (with p = 16 for P. falciparum). We take ΔST to be the time difference between the time of inoculation of P. falciparum and P. vivax: ΔST < 0 means P. falciparum infected first, and ΔST > 0 means P. vivax infected first. For all the (R0F, R0V) pairings, for both p = 16 and p = 8 for P. vivax, we did simulations for ΔST = −50, −10, −5, −1, 0, 1, 5, 10, and 50 weeks. In addition, for each choice of (R0F, R0V) and ΔST, we simulated each of the three types of host erythropoetic response to RBC loss described above. In the text, for simplicity we focus on representative values of ΔST. As stated above, we performed additional simulations for representative values of R0F, R0V and ΔST (with p = 16 for P. vivax) assuming that τret has duration 14 rather than 1.5 days. Finally, we did a number of simulations for values of R0F and R0V not equal to any of the values equally spaced in log(R0 – 1).
Comparisons to single-species infections
Many of our results below compare the change in peak infected RBC count, IPK, or the infected RBC count integrated over the course of infection, IINT, for a focal species (P. vivax or P. falciparum) in a mixed-species infection to the corresponding value in a single-species infection. For the comparisons that involve upor downregulation of RBC production, we obtained the single-species values by running the single-species model with the identical up- or downregulation. Thus, as background for our mixed-species results, we briefly discuss single-species infections here. Figure 2 shows the outcome of simulations of single-species infections of P. vivax and P. falciparum, using our CODE model with the parameters of only one or the other species, and includes many results not shown in our previous work.26 The duration of RBC vulnerability to P. vivax is 1.5 days for both P. vivax examples shown. The curves for P. vivax with p = 8 are similar to those with p = 16; this would be expected because for fixed R0, the ratio of RBC–merozoite binding ζ for P = 8 to that for p = 16 is (16 − R0)/(8 − R0). (Curves for P. vivax with p = 16 but with an assumption that τret is 14 rather than 1.5 days are presented in the supplemental material. These curves are closely similar to those in Figure 2.)
Figure 2.

Outcomes for single-species infection as a function of the basic reproduction rate R0. For the p = 8 and p = 16 P. vivax curves, the duration of RBC vulnerability to infection is 1.5 days. (A) Time of onset of catastrophic anemia vs R0 with a single-species P. vivax or P. falciparum infection. Data points on the top “plateau” show where host survival exceeded the simulated duration of infection (∼ 833 days). (B) Peak counts of infected RBCs, IPK, vs R0. (C) Counts of infected RBCs integrated over the course of the infection, IINT, vs R0. In each panel, the simulated data points are labeled as follows: (○) RBC production fixed at the basal rate, (△) compensatory response in RBC production, up to two times the basal rate, and (▽) diserythropoetic response in RBC production, down to 0.8 times the basal rate.
Note particularly that compensatory response to infection-induced RBC loss tends to boost IPK, especially for P. vivax, with no gain in host survival, over the values obtained for the same R0 but with RBC production fixed at the basal rate. This occurs because a boost in RBC production increases the reticulocyte count, thereby increasing the instantaneous R. (Recall that R varies during an infection, whereas R0 is a fixed quantity.) Even a barely persistent P. vivax infection induces catastrophic anemia if the host response to RBC loss is compensatory. However, the opposite effect occurs for a diserythropoetic host response, which tends to reduce IPK and IINT with little cost (or even a benefit) to host survival time for a given R0 for either species. Note that IPK is not monotonic in R0 if the host has a diserythropoetic response: the slowdown in RBC production works against the effects of a larger basic reproductive rate. IINT is not monotonic in R0 in general: the earlier death of the host as R0 increases works against the higher reproduction rate. Because the simulation outcomes are extremely sensitive to R0F and R0V when both are less than ∼ 1.75, a log scale in R0 – 1 for the horizontal axis (as in Figure 2) gives the best visual representation when results are plotted as a function of R0.
RESULTS
Competition for RBCs generally leads to suppression of one of the species
For most (R0F, R0V) combinations, our model predicts that parasitemia of one of the infecting species is reduced below its single-species value, whereas that of the other is barely affected. Figure 3 shows peak parasitemias for both P. vivax and P. falciparum in (R0F, R0V) parameter space for three values of the relative inoculation time ΔST. (The corresponding integrated parasitemias behave similarly; see supplemental material.) The results plotted in this figure are with the RBC source fixed at the basal rate, and show the typical pattern as ΔST, R0F, and R0V change: the species suppressed and the degree of suppression depend on which species has the higher R0 value and which infects first; an advantage in one of these factors can often offset a disadvantage in the other. For the examples shown in Figure 3, neither species facilitates the other (i.e., in neither is the parasitemia enhanced above its corresponding single-species infection level). Also shown in Figure 3 is the survival time for the host for the corresponding values of ΔST. Typically, survival time is reduced when the host is infected with both rather than one species.
Figure 3.

Peak parasitemia and host survival, varying with basic reproduction rates R0V and R0F and relative inoculation time ΔST. RBC production is fixed at the basal rate. Contours for IPK for P. vivax are spaced 104 μL−1 apart; contours for IPK for P. falciparum are spaced 7.5 × 10⁴ μL−1 apart. Those for the time of onset of catastrophic anemia are spaced 25 days apart. (A) ΔST = + 10 weeks. (B) ΔST = 0. (C) ΔST = −10 weeks. The gray shading from dark gray to white is to guide the eye from minimum to maximum values. The darkest gray shows values between 0 and the first contour. Black shading shows where the host dies before the second infection begins. For both P. vivax and P. falciparum, p = 16, and the duration of RBC vulnerability to P. vivax is 1.5 days. Because of the sharp sensitivity of host survival time to R0F or R0V when R0F and R0V ∼ 1.13, the contour lines in the charts for host survival are bunched around the white plateau where the host has survived for 2 × 10⁴ hours (∼ 833 days).
Figure 4 shows the times series for parasite and RBC counts for two points in (R0F, R0V) space at which IPK and IINT for one species are suppressed, whereas the other is unchanged. For R0F = 1.741, R0V = 1.087, ΔST = 0, (Figure 4, right column), P. vivax parasitemia is suppressed for the trivial reason that the host dies quickly in the mixed-species infection, before P. vivax parasitemia can reach a significant level. For R0F = R0V = 1.25, ΔST = −5 weeks, (left column), a different mechanism causes suppression of P. falciparum by P. vivax: the culling of reticulocytes by P. vivax reduces the total uninfected RBC count and drives the instantaneous R for P. falciparum below 1, even though the P. vivax inoculation was 5 weeks after that of P. falciparum. The data supplement includes an example of system dynamics at a (R0F, R0V) combination that illustrates mutual suppression.
Figure 4.

Time series of parasitemia and RBC count for two examples in which one species is suppressed and the other is unaffected. All series are plotted against the time since the host was inoculated with the initial infecting species. Results in the right column are for R0F = 1.741, R0V = 1.087, ΔST = 0 (simultaneous inoculation), and in the left column for R0F = R0V = 1.25, ΔST = −5 weeks (inoculation of P. vivax 5 weeks after P. falciparum.). RBC production is fixed at the basal rate for both simulations. TINC is the time since the first inoculation. (A) Time series for the count of P. vivax–infected RBCs per microliter. (B) Time series for the count of P. falciparum–infected RBCs per microliter. (C) Time series for the ratio of the uninfected reticulocyte count to the basal reticulocyte count. (D) Times series for the ratio of the total uninfected RBC count to the basal RBC count. Solid black curves show results in the mixed-species infection, dotted curves (- - -) show the P. vivax–only infection with the corresponding R0V, gray curves show the P. falciparum–only infection with the corresponding R0F. Where a mixed-species infection curve coincides with a single-species infection curve, only the mixed-species infection curve is shown. “x” marks the onset of catastrophic anemia. For R0F = R0V = 1.25, the count of RBCs infected with P. falciparum is completely eliminated after 108 weeks.
Not all (R0F, R0V) combinations follow this pattern. Especially when the host's RBC production can increase in response to the infection-induced loss of RBCs, P. vivax parasitemia in the mixed-species infection is enhanced over its corresponding P. vivax–only value. These enhancements tend to be along a “transition boundary” in (R0F, R0V) space, where the identity of the suppressed species changes. Figure 5 shows the peak P. vivax parasitemia in (R0F, R0V) space, with a compensatory RBC response, for three values of ΔST and three different combinations of p for P. vivax and τret. (For P. falciparum, p = 16 in all three cases.) Even if P. falciparum infects many weeks before P. vivax, there are regions in (R0F, R0V) space in which peak P. vivax parasitemia is enhanced. [The integrated count for P. vivax is enhanced in a small region in (R0F, R0V) space in which the host survives for 20,000 hours; we found almost no enhancement for P. falciparum. See supplementary materials.] Although proportionally greater for values of R0V near 1, some enhancement of the maximum P. vivax parasitemia in mixed-species infections occurs even for values of R0V near P. Surprisingly, an enhancement of both peak and integrated P. vivax parasitemia can occur when the host has a diserythropoetic response, and P. falciparum infects many weeks before P. vivax, as shown in Figure 6. We found no values of (R0F, R0V) for which IPK or IINT are appreciably enhanced for both species together: that is, this model predicts little interspecific synergy. We now examine mechanisms driving facilitation of P. vivax by P. falciparum.
Figure 5.

Peak P. vivax parasitemia, varying with basic reproduction rates R0V and R0F and relative inoculation time ΔST, with a compensatory RBC source. Contours for IPK for P. vivax are spaced 104 μL−1 apart for τret = 1.5 days and 2 × 10⁴ mL−1 apart for τret = 14 days. (A) ΔST = +10 weeks. (B) ΔST = 0. (C) ΔST = −10 weeks. The gray shading from dark gray to white is to guide the eye from lowest to maximum values. The darkest gray shows values between 0 and the first contour. Black shading is where the host dies before the second infection begins. For the simulations depicted, p = 16 for P. falciparum.
Figure 6.

P. vivax parasitemia and time of onset of catastrophic anemia, varying with basic reproduction rates R0V and R0F, with a diserythropoetic RBC source and P. falciparum infecting 50 weeks before P. vivax (ΔST = −50). The gray shading from dark gray to white is to guide the eye from lowest to maximum values. The darkest gray shows values between 0 and the first contour. Black shading is where the host dies before the second infection begins. (A) IPK for P. vivax. Contours are spaced 104 μL−1 apart for τret = 1.5 day and 2 × 10⁴ μL−1 apart for τret = 14 day. (B) IINT for P. vivax. Contours are spaced 2.5 × 10⁵ μL−1 apart for all values of p and τret. (C) Time of onset of catastrophic anemia with first species. Contours are spaced 25 days apart. For simulations depicted, p = 16 for P. falciparum.
Increased RBC production rates can enhance P. vivax parasitemia, with little benefit to P. falciparum
If the host can compensate for RBC loss, some enhancement of IPK for P. vivax would be expected because of its ability to rapidly exploit an expanded reticulocyte population. However, what could account for an enhancement with a diserythropoetic response? Figure 7 shows times series for parasite and RBC counts for three (R0F, R0V) combinations for which the P. vivax IPK is enhanced. (For the three examples, τret = 1.5 days.) The figures in the left column are for R0F = 1.5, R0V = 3.0, ΔST = −10 weeks (P. vivax infects 10 weeks after P. falciparum), and a compensatory response in RBC production to infection-induced RBC loss. The figures in the middle column are for R0F = 1.1137, R0V = 1.061, ΔST = 0 (simultaneous inoculations), and a compensatory response in RBC production to infection-induced RBC loss. The figures in the right column are for R0F = 1.087, R0V = 1.320, ΔST = −50 weeks, and a diserythropoetic response. For the two examples shown with compensatory response, the peak P. vivax parasitemia is 11% greater in the dual-species infection than in the corresponding P. vivax–only infection, although the integrated P. vivax parasitemia is suppressed in the dual-species infection. For the example with diserythropoetic response, the peak P. vivax parasitemia is 150% greater in the dual-species infection than the P. vivax–only infection, and the integrated P. vivax parasitemia is enhanced in the dual-species infection by 79% over the P. vivax–only value.
Figure 7.

Time series of parasitemia and RBC count for three examples in which P. falciparum facilitates P. vivax through transient surges in the reticulocyte count. All series are plotted against TINC, the time since the host was inoculated with the initial infecting species. The left column shows system dynamics for R0F = 1.5, R0V = 3, with a compensatory response and ΔST = −10 weeks (P. falciparum infects 10 weeks before P. vivax). The middle column shows system dynamics for R0F = 1.1137, R0V = 1.061, with a compensatory response and ΔST = 0 (both species inoculated at the same time). The right column shows system dynamics for R0F = 1.087, R0V = 1.320, with a diserythropoetic response and ΔST = −50 (P. falciparum infecting 50 weeks before P. vivax). Panels and all symbols are as in Figure 4. For the three simulations, τret = 1.5 days.
For the P. vivax–only infections shown in the left and middle columns of Figure 7, the increased RBC production is not enough to counteract the relentless consumption of reticulocytes (Figure 7C), and thus the host dies. However, in the corresponding dual-species infections, the P. falciparum infection triggers a boost in the reticulocyte count before the reticulocyte consumption by P. vivax becomes critical. For the example in the left column, P. falciparum infected first. For the example in the middle column, the growth rate of P. falciparum is higher than that of P. vivax, so its depletion of RBCs of all ages starts the boost in RBC production before P.vivax has consumed its prey population. Interestingly, in the later infection, the two species suppress each others’ parasitemias below the corresponding single-species values, after their peaks in the dual-species infection (Figure 7A and B), and the host survives longer than in the P. vivax–only infection (Figure 7D).
The right column plots in Figure 7 show catastrophic anemia produced by a P. vivax phenotype with a relatively high R0 superinfecting a P. falciparum infection that otherwise would have been controlled by the host's diserythropoetic response. The P. vivax inoculation suppresses the P. falciparum IINT. However, the diserythropoesis triggered by the pre-existing P. falciparum infection slows the growth rate of P. vivax (Figure 7A) until homeostasis returns, with the lessening of RBC loss caused by P. falciparum. The superinfecting P. vivax takes advantage of the boost in reticulocyte count (Figure 7C), which greatly amplifies its growth rate and enhances its IPK over the single-species infection value. Even if we add a further 6-month delay to the recovery of RBC production, the P. vivax IPK in the mixed-species infection is higher than in the single-species infection (see data supplement).
Dynamical response from the RBC source can lead to coupled, long-term oscillations in the parasitemia of both species
Our model predicts that if the RBC source is allowed to respond to the infection-induced cell loss, rather than remaining at a fixed rate, the parasitemia of the two species in a dual-species infection will tend to undergo long-term, coupled oscillations, provided that the host survives. Figure 8 shows this long-term behavior by presenting the results of simulated infections for up to 200-week duration. (For the three examples, τret = 1.5 days.) The figures in the left column are for R0F = 1.181, R0V = 1.087, ΔST = +50 weeks (P. vivax infects 50 weeks before P. falciparum), with the RBC production rate fixed at the basal rate. The figures in the middle column are for the same R0F, R0V, and ΔST, but with a diserythropoetic response by the RBC source. The figures in the right column are for R0F = 1.125, R0V = 1.0442, ΔST = −10 weeks (P. vivax infects 10 weeks after P. falciparum), with a compensatory response to infection-induced RBC loss.
Figure 8.

Time series of parasitemia and RBC count for three examples showing long-term behavior of the model (up to 200 weeks of simulated infection). All series are plotted against TINC, the time since the host was inoculated with the initial infecting species. The left column is for R0F = 1.181, R0V = 1.087, ΔST = +50 (P. falciparum infecting 50 weeks after P. vivax), with the RBC rate of production fixed at the basal rate. The middle column is also for R0F = 1.181, R0V = 1.087, ΔST = +50 but with a diserythropoetic response. The right column is for R0F = 1.125, R0V = 1.0442, ΔST = −10 (P. falciparum infecting 10 weeks before P. vivax) with a compensatory response to the loss of RBCs caused by infection. Panels and all symbols are as in Figure 4.
For the example with the fixed RBC source rate (left column), the parasitemias and blood counts converge to steady-state values, perhaps after undergoing some damped oscillations. However, the middle and right columns show more interesting behaviors. For R0F = 1.181, R0V = 1.087, ΔST = +50 weeks with a diserythropoetic response (middle column), not only does the presence of the earlier-infecting P. vivax prevent P. falciparum from killing the host, but the introduction of P. falciparum modifies the amplitude and phase of the oscillations of the P. vivax parasitemia. In the mixed-species infection, the oscillations of the two parasitemias become coupled, with P. vivax counts reaching their maxima a few weeks before P. falciparum counts. For both species, the maxima and minima in the counts differ by factors of 10−100. The parasitemia oscillations are coupled to those of the reticulocyte population. Oscillatory behavior is not so regular in the times series in the right column, for a case with compensatory response to infection-induced RBC loss; nonetheless, the presence of the earlier-infecting P. falciparum induces more frequent oscillations in the P. vivax parasitemia, and P. vivax, in turn, suppresses the P. falciparum parasitemia. There is a complex series of oscillations in the reticulocyte count.
Reductions in a susceptible RBC population can boost the integrated parasitemia of a superinfecting species by extending the host's lifespan
The example in the middle column of Figure 8 (R0F = 1.181, R0V = 1.087, ΔST = +50 weeks, diserythropoetic response) shows a second mechanism of enhancement of one species’ parasitemia by the presence of another: the reduction of the RBC population by one species can prevent a later-infecting species from killing the host, thus increasing the integrated parasitemia of the later-infecting species. In this example, an initial P. vivax infection reduces the overall RBC count and prevents a subsequent P. falciparum infection from inducing catastrophic anemia. However, this second mechanism of facilitation occurs over regions of (R0F, R0V) space that are tiny compared with those in which P. vivax is enhanced through increasing transients of RBC production.
DISCUSSION
The argument that RBC supply is not a limiting factor for parasitemia in P. falciparum–only infections fits the available data.39–41 Our previous work showed that the common argument that P. vivax–only infections exhibit limited anemia and lethality simply because P. vivax attacks only a small fraction of RBCs is flawed.26 Here we have shown that RBC population dynamics may dramatically affect the outcome of mixed-species infections as well. The typical outcome predicted by our model in P. vivax–P. falciparum infections is asymmetric suppression: competition for RBCs suppresses the parasitemia of one species and leaves the other unaffected, even if the anemia is only partially determined by parasite destruction of RBCs (as in the case of the diserythropoetic response of the host to the infections). However, with some combinations of RBC affinities, inoculation times, and host erythropoetic responses, the simulations also suggest mechanisms by which competition for RBCs may lead one species to facilitate the other's parasitemia, especially P. falciparum facilitating P. vivax. Thus, because interactions between these species are likely to be mediated by their interactions with RBCs, at least in part, constraints and imperatives for immunologic response must be intertwined with those for erythropoetic response. Even if R0 ∼ p, as it is believed to be in some malaria-naïve patients,39 immune effectors might reduce ζ or p or both: we would expect a dynamic immune response to reduce the instantaneous growth rates R (not R0) of the two parasites to values near 1 much more quickly than in our model (in which R can only be reduced from R0 by a reduction in the RBC population vulnerable to the species) and to start the chronic phase of the disease within a matter of weeks. The long-term model behavior for R0F and R0V less than ∼ 1.75 may still be relevant for understanding real infections. The key point suggested by our results is that a transient rise in RBC production could boost P. vivax parasitemia, whether that transient is a direct response to the extra RBC loss because of infection or arises from a return to homeostasis with the control of a P. falciparum infection. There is no reason a priori why the host's immune response should be expected to obliterate this effect of RBC competition.
Because P. vivax and P. falciparum diverged long ago, the challenges they present a common host should be similar but not identical. Salient differences should be reflected in host responses. For instance, P. vivax induces fever at a much lower parasitemia than does P. falciparum, suggesting that their interactions may involve a difference in the production of pyrogenic cytokines.42–44 It is clear that innate and acquired immune responses differ in their regulatory effects on parasite dynamics in P. vivax–P. falciparum infections,9,45 and it seems likely that most malaria infections are controlled by combinations of species- and phenotype-specific responses along with more general ones. Our results here suggest that these various distinctions should be examined more closely with regard to the erythropoetic involvement, especially as the qualitative behavior of the model is remarkably robust to changes in model parameters.
Although the infamous persistence of P. vivax infections has generally been attributed to its latent liver stages, PCR-based studies have begun to confirm suspicions that P. falciparum infections also persist much longer than is commonly recognized.46–48 (As far back as 1951, Eyles and Young reported that parasitemia detectible with the methods of the time can last more than a year in neurosyphilis patients infected with P. falciparum.49) Thus, in the context of our model of mixed-species infections, it is interesting that both a variable host erythropoetic response and a limitation of susceptible RBCs can alter R for one or both species so as to delay or prevent catastrophic anemia, and/or generate long-term coupled oscillations of the parasitemia of the two species with a period on the order of weeks to months. As the host's immune response was almost certainly a signficant determinant of the coupled oscillatory behavior of the P. vivax and P. falciparum parasitemia in dually infected neurosyphilis patients,9 our results cannot be directly compared with the patterns seen in these or other patients. Our model indicates that competition for RBCs may have a role in inducing or otherwise contributing to such behavior, however.
Where P. vivax and P. falciparum co-occur, their ongoing evolution must be influenced by competition for RBCs, in part by affecting the dynamics of their gametocytes. It is gametocytes, ingested by a mosquito, that can recombine and propagate parasite genes. However, because gametocyte production trades replicating, non-transmissible forms for non-replicating, transmissible forms, it reduces the rate of RBC destruction.50 Thus, it is intriguing that P. falciparum game-tocytemia is increased in the reticulocyte-rich blood of sickle-cell patients51 and decreased, in density and frequency, in P. vivax–P. falciparum infections.52 Gametocyte production and transmission remain poorly understood, and our model cannot directly address these observations, but, if the probability that a species’ gametocytes are transmitted is proportional to that species IPK or IINT, our results suggest that in most situations the species that has the higher R0 or infects earlier would have an advantage, because RBC competition generally suppresses both IPK and IINT for the other species. However, the seemingly small regions of (R0F, R0V) space in which one species would facilitate IPK or IINT (and thus transmission) of the other could be important in selecting for traits that encourage or discourage co-infections. They may be important in selection of traits in the host as well. How the host's immune response would affect the size and boundaries of those regions in (R0F, R0V) space is an important question for study.
MATHEMATICAL APPENDIX
We model the parasite and RBC dynamics with systems of CODEs, in a manner closely similar to our previous work on single-species infections.26 Notation is as in Figure 1. To model an ensemble of cells undergoing a specific process of development that requires duration τ on average with standard deviation sd, the number of compartments F is set so that sd = τF−1/2. In a sense, the compartments are an abstraction, but the duration and standard deviation of the development process are the tangible quantities.
The CODEs for the development chain of infected RBCs are
where subscript sp is v for P. vivax or f for P. falciparum, Fsp is the number of compartments in the development chain for the given species, and κsp = Fsp/τsp. μf and μv are the merozoite counts for the two species. Vsp is the total count of vulnerable RBCs for a given species: Vv = total reticulocyte count, and Vf = ET, the total uninfected RBC count. Because we took τf = τv = 48 hours, with a variance of 4.8 hours, Ff = Fv = 100. Because of their short duration in the blood, we used just one compartment for the merozoite stage:
In our simulations, we took pf = 16, pv = 8 or 16, and τμ,f = τμ,v = 0.1 hour. Lsp(t) is the primary infusion of merozoites of the given species from the liver into blood, which is believed to happen quickly and involve 104−105 merozoites after the liver stage of the parasite develops for ∼ 1 week. For simplicity, we took Lsp(t) = 0, except for a 1-hour period:
where t0,sp is the time of initial inoculation with the given species. Use of other functional forms for Lsp(t) changed the outcome of test simulations little. For our simulations, the initial time (t = 0) corresponds to the release of the first parasite from the liver.
Using the notation in Figure 1, the CODEs for the RBC development chains are
Here, κR = τR/FR, κS = τM/FM, and κS = τS/FS, where τ is the duration of the respective blood development stages. For reticulocytes, we took τR = 36 hours with sd = 6 hours, so that FR = 36; for mature-stage RBCs, τM = 2,796 hours with sd = 168 hours so that FM = 276; for senescent-stage RBCs, τS = 48 hours with sd = 12 hours so that FS = 16.
The model for the RBC marrow source depends on how the source responds to change in the count of uninfected RBCs. For compensatory erythropoesis,30 we take
Here, σ0 is the basal RBC production rate, σMX is the maximum allowed RBC production rate, which we took as 2σ0; 1/λσ, the response time to changes in ET, was set to 48 hours. For diserythropoesis, we assume that σ(t) is driven towards a floor value σMN = 0.8σ0 instead:
Again, 1/λσ = 48 hours.
If at any point the merozoite count for a given species, the total infected RBC count for a given species, or the total uninfected RBC count drops to < 1 in a total blood volume of 5 × 10⁶ μL, the values of all the compartments that contributed to that particular count were reset to zero. The CODE system was solved using the fifth-order Runge-Kutta-Fehlberg algorithm with adaptive stepsize control for time integration53,54 so that the difference between the fourth- and fifth-order solutions for each component of the CODE systems was less than one part in 106.
Acknowledgments
We thank David L. Smith, Wendy P. O'Meara, and three anonymous reviewers for helpful comments.
Footnotes
Publisher's Disclaimer: This PDF receipt will only be used as the basis for generating PubMed Central (PMC) documents. PMC documents will be made available for review after conversion (approx. 2−3 weeks time). Any corrections that need to be made will be done at that time. No materials will be released to PMC without the approval of an author. Only the PMC documents will appear on PubMed Central -- this PDF Receipt will not appear on PubMed Central.
Note: Additional supplemental figures appear online at www.ajtmh.org.
Supplementary Material
REFERENCES
- 1.White NJ, Breman JG. Malaria and babesiosis. In: Braunwald E, Fauci AS, Isselbacher KJ, Kasper DL, Hauser SL, Longo DI, Jameson JL, editors. Harrison's Principles of Internal Medicine. McGraw-Hill; New York: 2001. pp. 1203–1213. [Google Scholar]
- 2.Miller LH, Baruch D, Marsh K, Doumbo OK. The pathogenic basis of malaria. Nature. 2002;415:673–679. doi: 10.1038/415673a. [DOI] [PubMed] [Google Scholar]
- 3.McKenzie FE, Bossert WH. Mixed-species Plasmodium infections of Anopheles. J Med Entomol. 1997;34:417–425. doi: 10.1093/jmedent/34.4.417. [DOI] [PMC free article] [PubMed] [Google Scholar]
- 4.Knowles R, White RS. Studies in the Parasitology of Malaria. Indian Med Res Memoirs No. 18. Thacker, Spink, and Co.; Calcutta, India: 1930. [Google Scholar]
- 5.Cohen JE. Heterologous immunity in human malaria. Q Rev Biol. 1973;48:467–489. doi: 10.1086/407705. [DOI] [PubMed] [Google Scholar]
- 6.Brown AE, Kain KC, Pipithkul J, Webster HK. Demonstration by the polymerase chain reaction of mixed Plasmodium falciparum and P. vivax infections undetected by conventional microscopy. Trans R Soc Trop Med Hyg. 1992;86:609–612. doi: 10.1016/0035-9203(92)90147-5. [DOI] [PubMed] [Google Scholar]
- 7.Snounou G, Viriyakosol S, Jarra W, Thaithong S, Brown KN. Identification of the four human malaria parasite species in field samples by the polymerase chain reaction and detection of a high prevalence of mixed infections. Mol Biochem Parasitol. 1993;58:283–292. doi: 10.1016/0166-6851(93)90050-8. [DOI] [PubMed] [Google Scholar]
- 8.McKenzie FE, Bossert WH. Mixed-species Plasmodium infections of humans. J Parasitol. 1997;83:583–600. [PMC free article] [PubMed] [Google Scholar]
- 9.Mason DP, McKenzie FE. Blood-stage dynamics and clinical implications of mixed Plasmodium vivax-Plasmodium falciparum infections. Am J Trop Med Hyg. 1999;61:367–374. doi: 10.4269/ajtmh.1999.61.367. [DOI] [PMC free article] [PubMed] [Google Scholar]
- 10.Boyd MF, Kitchen SF. Simultaneous inoculation with Plasmodium vivax and Plasmodium falciparum. Am J Trop Med. 1937;17:855–861. [Google Scholar]
- 11.Boyd MF, Kitchen SF, Matthews CB. Consecutive inoculations with Plasmodium vivax and Plasmodium falciparum. Am J Trop Med. 1938;18:141–150. [Google Scholar]
- 12.Earle WC, Perez M, del Rio J, Arzola C. Observations on the course of naturally acquired malaria in Puerto Rico. Puerto Rican J Pub Health Trop Med. 1939;14:391–406. [Google Scholar]
- 13.Hill RB, Cambournac FJC, Simoes MP. Observations on the course of malaria in children in an endemic region. Am J Trop Med. 1943;23:147–162. [Google Scholar]
- 14.Mehlotra RK, Lorry K, Kastens W, Miller SM, Alpers MP, Bockarie M, Kazura JW, Zimmerman PA. Random distribution of mixed species malaria infections in Papua New Guinea. Am J Trop Med Hyg. 2000;62:225–231. doi: 10.4269/ajtmh.2000.62.225. [DOI] [PubMed] [Google Scholar]
- 15.Mayxay M, Pukrittayakamee S, Newton PN, White NJ. Mixed-species malaria infections in humans. Trends Parasitol. 2004;20:233–240. doi: 10.1016/j.pt.2004.03.006. [DOI] [PubMed] [Google Scholar]
- 16.Snounou G, White NJ. The co-existence of Plasmodium: sidelights from falciparum and vivax malaria in Thailand. Trends Parasitol. 2004;20:333–339. doi: 10.1016/j.pt.2004.05.004. [DOI] [PubMed] [Google Scholar]
- 17.Zimmerman PA, Melotra RK, Kasehagen LJ, Kazura KW. Why we need to know more about mixed Plasmodium species infections in humans? Trends Parasitol. 2005;20:440–447. doi: 10.1016/j.pt.2004.07.004. [DOI] [PMC free article] [PubMed] [Google Scholar]
- 18.Looareesuwan S, White NJ, Chittamas S, Bunnag D, Harinasuta T. High rate of Plasmodium vivax relapse following treatment of falciparum malaria in Thailand. Lancet. 1987;2:1052–1055. doi: 10.1016/s0140-6736(87)91479-6. [DOI] [PubMed] [Google Scholar]
- 19.Mason DP, Krudsood S, Wilairatana P, Viriyavejakul P, Silachamroon U, Chokejindachai W, Singhasivanon P, Supavej S, McKenzie FE, Looareesuwan S. Can treatment of P. vivax lead to an unexpected appearance of falciparum malaria? Southeast Asian J Trop Med Public Health. 2001;32:57–63. [PMC free article] [PubMed] [Google Scholar]
- 20.Maitland K, Williams TN, Bennett S, Newbold CI, Peto TE, Viji J, Timothy R, Clegg JB, Weatherall DJ, Bowden DK. The interaction between Plasmodium falciparum and P. vivax in children on Espiritu Santo island, Vanuatu. Trans R Soc Trop Med Hyg. 1996;90:614–620. doi: 10.1016/s0035-9203(96)90406-x. [DOI] [PubMed] [Google Scholar]
- 21.Luxemburger C, Ricci F, Nosten F, Raimond D, Bathet S, White NJ. The epidemiology of severe malaria in an area of low transmission in Thailand. Trans R Soc Trop Med Hyg. 1997;91:256–262. doi: 10.1016/s0035-9203(97)90066-3. [DOI] [PubMed] [Google Scholar]
- 22.Arevalo-Herrera M, Herrera S. Plasmodium vivax malaria vaccine development. Mol Immunol. 2001;38:443–455. doi: 10.1016/s0161-5890(01)00080-3. [DOI] [PubMed] [Google Scholar]
- 23.McKenzie FE, Jeffery GM, Collins WE. Plasmodium vivax blood-stage dynamics. J Parasitol. 2002;88:521–535. doi: 10.1645/0022-3395(2002)088[0521:PVBSD]2.0.CO;2. [DOI] [PMC free article] [PubMed] [Google Scholar]
- 24.Krogstad DJ. Plasmodium species (malaria). In: Mandell GL, Bennett JE, Dolin R, editors. Principles and Practice of Infectious Diseases. Churchill Livingstone; New York: 1995. pp. 2415–2427. [Google Scholar]
- 25.Wickramasinghe SN, Abdalla SH. Blood and bone marrow changes in malaria. Baillieres Best Pract Res Clin Haematol. 2000;13:277–299. doi: 10.1053/beha.1999.0072. [DOI] [PubMed] [Google Scholar]
- 26.McQueen PG, McKenzie FE. Age-structured red blood cell susceptibility and the dynamics of malaria infections. Proc Nat Acad Sci USA. 2004;101:9161–9166. doi: 10.1073/pnas.0308256101. [DOI] [PMC free article] [PubMed] [Google Scholar]
- 27.Collins WE, Jeffery GM, Roberts JM. A retrospective examination of anemia during infection of humans with Plasmodium vivax. Am J Trop Med Hyg. 2003;68:410–412. [PubMed] [Google Scholar]
- 28.Lloyd AL. The dependence of viral parameter estimates on the assumed viral life cycle: limitations of studies of viral load data. Proc R Soc London B. 2001a;268:847–854. doi: 10.1098/rspb.2000.1572. [DOI] [PMC free article] [PubMed] [Google Scholar]
- 29.Lloyd AL. Destabilization of epidemic models with the inclusion of realistic distributions of infectious periods. Proc R Soc London B. 2001b;268:985–993. doi: 10.1098/rspb.2001.1599. [DOI] [PMC free article] [PubMed] [Google Scholar]
- 30.Rapaport SI. Introduction to Hematology. Lippincott; Philadelphia, PA: 1987. [Google Scholar]
- 31.Simpson JA, Silamut K, Chotivanich K, Pukrittayakamee S, White NJ. Red cell selectivity in malaria: a study of multiple-infected erythrocytes. Trans R Soc Trop Med Hyg. 1999;93:165–168. doi: 10.1016/s0035-9203(99)90295-x. [DOI] [PubMed] [Google Scholar]
- 32.Pasvol G, Weatherall DJ, Wilson RJ. The increased susceptibility of young red cells to invasion by the malarial parasite Plasmodium falciparum. Br J Haematol. 1980;45:285–295. doi: 10.1111/j.1365-2141.1980.tb07148.x. [DOI] [PubMed] [Google Scholar]
- 33.Johnson JG, Epstein N, Shiroishi T, Miller LH. Factors affecting the ability of isolated Plasmodium knowlesi merozoites to attach to and invade erythrocytes. Parasitology. 1980;80:539–550. doi: 10.1017/s0031182000000998. [DOI] [PubMed] [Google Scholar]
- 34.Talman AM, Domarle O, McKenzie FE, Ariey F, Robert V. Gametocytogenesis: the puberty of Plasmodium falciparum. Malaria J. 2004;3:24. doi: 10.1186/1475-2875-3-24. [DOI] [PMC free article] [PubMed] [Google Scholar]
- 35.Rouzine IM, McKenzie FE. Link between immune response and parasite synchronization in malaria. Proc Nat Acad Sci USA. 2003;100:3473–3478. doi: 10.1073/pnas.262796299. [DOI] [PMC free article] [PubMed] [Google Scholar]
- 36.Jakeman GN, Saul A, Hogarth WL, Collins WE. Anaemia of acute malaria infections in non-immune patients primarily results from destruction of uninfected erythrocytes. Parasitology. 1999;119:127–133. doi: 10.1017/s0031182099004564. [DOI] [PubMed] [Google Scholar]
- 37.Glushakova S, Yin D, Li T, Zimmerberg J. Membrane Transformation during Malaria Parasite Release from Human Red Blood Cells. Curr Biol. 2005;15:1645–1650. doi: 10.1016/j.cub.2005.07.067. [DOI] [PubMed] [Google Scholar]
- 38.Engwerda RE, Good MF. Interactions between malaria parasites and host immune systems. Curr Opin Immun. 2005;17:381–387. doi: 10.1016/j.coi.2005.05.010. [DOI] [PubMed] [Google Scholar]
- 39.Gravenor MB, McLean AR, Kwiatkowski D. The regulation of malaria parasitaemia: parameter estimates for a population model. Parasitology. 1995;110:115–122. doi: 10.1017/s0031182000063861. [DOI] [PubMed] [Google Scholar]
- 40.Hetzel C, Anderson RM. The within-host cellular dynamics of bloodstage malaria: theoretical and experimental studies. Parasitology. 1996;113:25–38. doi: 10.1017/s0031182000066245. [DOI] [PubMed] [Google Scholar]
- 41.Price RN, Simpson JA, Nosten F, Luxemburger C, Hkirjaroen L, ter Kuile F, Chongsuphajaisiddhi T, White NJ. Factors contributing to anemia after uncomplicated falciparum malaria. Am J Trop Med Hyg. 2001;65:614–622. doi: 10.4269/ajtmh.2001.65.614. [DOI] [PMC free article] [PubMed] [Google Scholar]
- 42.Clark IA, Chaudhri G. Tumour necrosis factor may contribute to the anaemia of malaria by causing dyserythropoiesis and erythrophagocytosis. Br J Haematol. 1988;70:99–103. doi: 10.1111/j.1365-2141.1988.tb02440.x. [DOI] [PubMed] [Google Scholar]
- 43.Snewin VA, Longacre S, David PH. Plasmodium vivax: older and wiser? Res Immunol. 1991;142:631–636. doi: 10.1016/0923-2494(91)90140-e. [DOI] [PubMed] [Google Scholar]
- 44.Kwiatkowski D. Malarial toxins and the regulation of parasite density. Parasitol Today. 1995;11:206–212. doi: 10.1016/0169-4758(95)80079-4. [DOI] [PubMed] [Google Scholar]
- 45.McKenzie FE, Bossert WH. Multispecies Plasmodium infections of humans. J Parasitol. 1999;85:12–18. [PMC free article] [PubMed] [Google Scholar]
- 46.Babiker HA, Abdel-Muhsin AM, Ranford-Cartwright LC, Satti G, Walliker D. Characteristics of Plasmodium falciparum parasites that survive the lengthy dry season in eastern Sudan where malaria transmission is markedly seasonal. Am J Trop Med Hyg. 1998;59:582–590. doi: 10.4269/ajtmh.1998.59.582. [DOI] [PubMed] [Google Scholar]
- 47.Collins WE, Jeffery GM. A retrospective examination of sporozoite- and trophozoite-induced infections with Plasmodium falciparum: development of parasitologic and clinical immunity during primary infection. Am J Trop Med Hyg. 1999;61(Suppl 1):4–19. doi: 10.4269/tropmed.1999.61-04. [DOI] [PubMed] [Google Scholar]
- 48.Arez AP, Snounou G, Pinto J, Sousa CA, Modiano D, Ribeiro H, Franco AS, Alves J, Rosario VE. A clonal Plasmodium falciparum population in an isolated outbreak of malaria in the Republic of Cabo Verde. Parasitology. 1999;118:347–355. doi: 10.1017/s0031182099003972. [DOI] [PubMed] [Google Scholar]
- 49.Eyles DE, Young MD. The Duration of Untreated or Indaequately Treated Plasmodium Falciparum Infections in the Human Host. J Natl Malaria Soc. 1951;10:327–336. [PubMed] [Google Scholar]
- 50.McKenzie FE, Bossert WH. A target for intervention in Plasmodium falciparum infections. Am J Trop Med Hyg. 1998;58:763–767. doi: 10.4269/ajtmh.1998.58.763. [DOI] [PMC free article] [PubMed] [Google Scholar]
- 51.Trager W, Gill GS, Lawrence C, Nagel RL. Plasmodium falciparum: enhanced gametocyte formation in vitro in reticulocyte-rich blood. Exp Parasitol. 1999;91:115–118. doi: 10.1006/expr.1998.4347. [DOI] [PubMed] [Google Scholar]
- 52.Price R, Nosten F, Simpson JA, Luxemburger C, Phaipun L, ter Kuile F, van Vugt M, Chongsuphajaisiddhi T, White NJ. Risk factors for gametocyte carriage in uncomplicated falciparum malaria. Am J Trop Med Hyg. 1999;60:1019–1023. doi: 10.4269/ajtmh.1999.60.1019. [DOI] [PubMed] [Google Scholar]
- 53.Cash JR, Karp AH. A variable order Runge-Kutta method for initial-value problems with rapidly varying right-hand sides. ACM Trans Math Soft. 1990;16:201–222. [Google Scholar]
- 54.Press WH, Teukolsky SA, Vettering WT, Flannery BP. Numerical Recipes in C. Cambridge University Press; Cambridge, UK: 1992. [Google Scholar]
Associated Data
This section collects any data citations, data availability statements, or supplementary materials included in this article.