

Abstract
Mathematical model reduction is a long-standing technique used both to gain insight into model subprocesses and to reduce the computational costs of simulation and analysis. A reduced model must retain essential features of the full model, which, traditionally, have been the trajectories of certain state variables. For biological clocks, timing, or phase, characteristics must be preserved. A key performance criterion for a clock is the ability to adjust its phase correctly in response to external signals. We present a novel model reduction technique that removes components from a single-oscillator clock model and discover that four feedback loops are redundant with respect to its phase response behavior. Using a coupled multioscillator model of a circadian clock, we demonstrate that by preserving the phase response behavior of a single oscillator, we preserve timing behavior at the multioscillator level.
INTRODUCTION
The molecular mechanisms that govern the behavior of biological systems are characterized by complex and dynamical interactions. To capture interactions between putative process components, the framework of systems-theoretic tools is ideal, allowing one to formalize hypothesized kinetics in mathematical models. A mathematical model, often a set of ordinary differential equations (ODEs), is simulated and analyzed, invalidating misconceptions about the biological system, supporting good hypotheses, and driving further experimentation. With increased knowledge comes increased complexity in the mathematical models. For example, biological systems such as the mammalian circadian clock are now modeled as multi-, rather than single oscillators, increasing the size and complexity of the simulations by several orders of magnitude. An investigation of network-level properties, such as the ability of a coupling mechanism to produce spontaneous synchrony, likely does not necessitate every clock component at every node. Discriminating between critical, interchangeable, and redundant subsystems via a model reduction algorithm provides insight into the underlying mechanisms. Further, by removing unnecessary components, an unwieldy model is transformed into one that is more computationally tractable—a desirable feature for networks that contain thousands of nodes.
Model reduction is an important tool in many areas of research, including combustion, chemical plant, atmospheric, and biological modeling. The literature covers a broad range of techniques to reduce ODE models, including lumping similar state variables together (1), projecting a stiff system onto its slow manifold (2–5), eliminating states insensitive to parametric perturbation (6), and eliminating states via quasi-steady-state or partial-equilibrium approximation (7,8). A recent approach to nonlinear model reduction uses mathematical programming techniques, in which state variables or reactions are removed from the model without seriously degrading its accuracy (9–12). An important feature of this approach is that it preserves the biophysical interpretation of each component, thus allowing the user to determine which components are necessary to minimize the error between the full and reduced models. In many cases, the most appropriate measure of error is simply the distance between the trace of the outputs (or states) of the full and reduced models. However, in many systems—particularly biological systems—experimental data is often noisy and sparse, and state trajectories are not known precisely. Furthermore, the proper functionality of a model may not depend upon its ability to reproduce state trajectories under constant conditions, but to capture the response to an input or altered initial conditions (12,13). For biological clocks, it is essential that stimuli generate the proper timing, or phase, response.
The mammalian circadian clock controls the timing of vital daily physiological processes, such as sleeping and waking. Under constant conditions, it runs with a period that only approximates 24 h, and in its natural environment it is entrained by external signals such as temperature fluctuations, changes in light levels, and social interactions that act as zeitgebers, or time givers. The most important zeitgeber to the mammalian clock is the 24-h light/dark cycle. The master clock resides in the hypothalamic suprachiasmatic nucleus (SCN), and is composed of thousands of neurons, each of which contains its own clockworks in the form of a transcriptional feedback network. Each cell contains an imprecise oscillator, with variations in the periods of oscillation both from cell to cell and from cycle to cycle. Via intercellular communication, the cells spontaneously synchronize to form a coherent oscillation.
Phase response is critical to two aspects of circadian clock operation: 1), the individual cells must adjust their timing to that of the other cells to form a coherent oscillator; and 2), the coherent oscillator must adjust its timing to match that of its environment. The standard tool for studying such timing adjustments (both in vivo and in silico) is the phase response curve (PRC)—depending upon the phase of a signal's arrival, an oscillator may advance, delay, or maintain its phase. The PRC maps signal arrival time to the resultant phase shift. To study the phase response capabilities of a model separate from the signal, we developed the parametric impulse phase response curve (pIPRC) (14), which is an infinitesimal analog to the PRC. For an arbitrary signal manifesting as the modulation of a model parameter, the pIPRC can be used to predict the response to that signal and can be said to characterize the phase behavior of the oscillator. Proper circadian performance of a reduced model requires preservation of the appropriate pIPRC.
We develop and apply a novel reduction technique for clock models. Our goal is to create a reduced order model that minimizes the distance between the pIPRCs of the full and reduced models, with the constraint that the reduced model must demonstrate limited cycle behavior. To find the reduced model, we use an optimization algorithm that removes unnecessary states, expanding the techniques of Edwards et al. (9) and Petzold and Zhu (10). To our knowledge, our approach is unique in that it preserves a sensitivity measure. Additionally, unlike many other methods, the process we describe is automated and requires no special knowledge of the kinetics of the full model. To demonstrate the effectiveness of the new technique, we apply it to Forger and Peskin's 73-state model of the mammalian circadian clock (38). The reduced model has only 13 states, but is remarkably similar in performance to that of the full model. The reduced model reveals that four of the feedback loops in the original model are redundant with respect to the appropriate pIPRC and the phase relationships between the reduced model components. (Of course, this does not mean that these loops are not important for other purposes.)We demonstrate that the coupled system of reduced order cell models exhibits the same properties with respect to synchronization as the full model.
Background
In the literature, two approaches have been taken to reduce models of oscillatory systems. The first is to apply techniques used in the broader literature and then to verify that the reduced model has retained its ability to oscillate. The second is to use oscillator-specific techniques, such as phase reduction. Below, we briefly summarize the techniques applied to circadian clock models and follow with a more in-depth discussion of oscillator-specific methods.
In the circadian literature, linear techniques have been used to project models onto lower dimensional manifolds. In two cases, the authors capitalize on the existence of varying timescales in the system. Forger and Kronauer project a five-state fly clock model onto a two-dimensional manifold using eigenvector decomposition (16). By using the method of averaging, they learn that the reduced model is mathematically very similar to the van der Pol oscillator, and therefore that the full model is its biochemical analog. Goussis and Najm (17) reduce a three-state fly clock model (18) using computational singular perturbation (3). By studying the timescales as they evolve over the cycle, the authors are able to separate the cycle into two regimes—one driven by monomer protein translation and destruction, the other by transcription. In a third case, the projection aims to capture the state trajectories in a more concise manner. Indic et al. (19) apply an eigenvector decomposition to the state trajectories, using the results to reduce the dimensionality of the system. In all of the above cases, the reduced models were oscillatory and captured the phase response behavior of the full model, although this was not explicitly a goal in the design of those algorithms.
Phase reduction
An elegant method for preserving the phase response properties of a reduced model involves modeling the phase response properties only. In the method of phase reduction, an oscillator is reduced to a single ODE—the so-called phase evolution equation. This method was pioneered by Winfree (20) and Kuramoto (21), and has been used widely in the field of weakly connected neural oscillators (22). It applies to limit cycle oscillators.
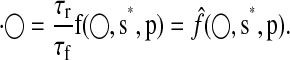
A limit cycle oscillator is defined by a set of autonomous nonlinear ODEs with an attracting orbit γ, given by
 |
(1) |
where x is the vector of states and p is the vector of (constant) parameters. The solution along the limit cycle is denoted by xγ(t), and is τ-periodic, meaning xγ(t) = xγ(t + τ). Progress along the limit cycle is described by its phase φ, which indicates the clock's internal time. When the system is in constant condition, phase progresses at the same rate as (simulation) time, making phase and time effectively indistinguishable. However, in the presence of a stimulus, the rate of phase progression changes, incurring a mismatch between the independent variable time and the dependent variable phase. This mismatch is a phase response.
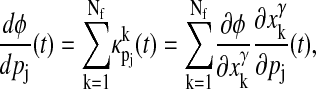
The phase evolution equation exists in two forms—one tracking the phase of a system which incurs perturbations to its state dynamics directly, and the other incurring perturbation to parameters. Much of the literature concerns the former, which relies on a sensitivity measure called the state impulse phase response curve (sIPRC). The sIPRC predicts the phase response to a state perturbation. The sIPRC for the kth state is
 |
(2) |
expressing that a small perturbation in state k at time t will cause the system to incur a phase shift ∂φ. It is easily computed by solving the adjoint linear variational equation associated with the system represented by Eq. 1 (22,23). The phase evolution equation tracks the phase in the presence of perturbation and is given by
 |
(3) |
where G is the vector of stimulus effects, e.g., an electrical current sent to a neuron. If there is no stimulus, then dφ/dt = 1 and φ(t) = t + t(0) (i.e., phase and time are indistinguishable).
For circadian clock models, a stimulus is modeled as a time-varying perturbation to a parameter. In Taylor et al. (14), using Eqs. 2 and 3 as our theoretical bases, we developed the parametric impulse phase response curve (pIPRC) and the accompanying phase evolution equation. The phase response to an impulse perturbation (note that an impulse in this context is a square pulse infinitesimally small in both duration and magnitude) to the jth parameter is given by
 |
(4) |
yielding the phase evolution equation
 |
(5) |
The pIPRC is related to the sIPRC according to
 |
where N is the number of states. The pIPRC is easily computed by solving the adjoint linear variational equation (for the sIPRC) and by automatically differentiating the right-hand side f of Eq. 1 with respect to the parameter of interest pj.
In Taylor et al. (14), we showed that the phase evolution equation is a good predictor for the phase response to arbitrary signals. However, to use the phase evolution equation, the signal must be known or postulated a priori. To uncover the possible signaling mechanisms for a coupled population of circadian clock neurons, simply postulating a signal trace is not a practical approach. Instead, we must use a mechanistic model for each cell, allowing the state values to generate the signals. This is particularly important for a model with heterogeneity across the cells—each cell may be generating a slightly different signal. The differing signal shapes result not only from intrinsic heterogeneity (i.e., each cell has its own set of parameters), but also from the phase response dynamics due to the signals each cell receives. Additionally, to match the experimental data (24), some cells should be damped oscillators. There is no clear method for using the phase evolution equation for a damped oscillator.
THE PROPOSED METHOD
For an investigation into mechanisms involved in synchronizing cellular oscillators, the ideal reduced model will have a closed-form expression as a system of ODEs. It must retain the biophysical interpretation of the state vector, limit cycle behavior, and the phase response capabilities of the full model. The closed-form expression allows us to further manipulate the model, e.g., to add a signaling cascade to the core oscillator and to create a set of oscillators with parametric heterogeneity. Not only does our proposed algorithm have these features, it is also highly flexible—simply by changing the cost function, one can adapt our method to suit a different type of investigation.
In addition to reducing the cost of a large computation, model reduction is often used to gain insight and understanding into the essential mechanisms driving a physical process. Our algorithm is well suited to this purpose—by observing which states are removed and which states remain, we learn which subsystems are unnecessary (or redundant), which are interchangeable (a subsystem is interchangeable if it is part of a pair or group of subsystems, only one of which is necessary for the desired behavior), and which are critical to the essential features of the system.
We propose an optimization method which will produce a reduced model with a minimal number of states while preserving the pIPRC of the full model. As such, we formulate the problem as the minimization of a cost depending upon the number of states and pIPRC-associated error.
To account for possible exclusion of states, we rewrite the limit cycle ODE system as
 |
(6) |
where x is the vector of states, p is the vector of parameters, and s is a vector where si is 1 if the ith state is included in the model (and 0 if it is excluded). The number of states present in the model is  where Nf is the number of states in the full model.
We find the reduced model by minimizing the number of states while preserving the shape of a particular pIPRC. The cost ζreduction of a reduced model is determined by its size and its error (measured in terms of its ability to reproduce the desired pIPRC). The minimal reduced model  is defined such that its solution x* minimizes the cost ζreduction, i.e.,
 |
(7) |
where 𝒮 is the set of all vectors of length Nf whose entries are 0 or 1, and x is the solution to  The parameters p are held constant throughout the optimization.
The cost function ζreduction, is undefined if the system fails to meet the periodicity constraint (and is ignored by the minimization procedure). Otherwise, it is real-valued and nonnegative, i.e.,
 |
if x is oscillatory. We weight the model size ρ and pIPRC error δpIPRC terms heavily (multiplied by 1), while the period error δτ is weighted less heavily (multiplied by 0.1). The period must remain reasonably close to the full model's period, but need not be identical to it because any error in the period can be corrected by scaling time in the reduced model. The relative model size ρ is simply the ratio of the number of states in the reduced model Nr to the number of states in the full model Nf.
 |
The error associated with the free-running period τr is again a simple ratio:
 |
The pIPRC error is computed as the least-squares distance between the full and reduced model pIPRCs, up to timescaling, shifting, and magnitude-scaling, as described below.
Timescaling
We allow for period mismatch between the full and reduced models and employ timescaling to force the reduced model period to match that of the full. For the comparison to be fair, we must compare one cycle of the pIPRC in the full model to one cycle of the pIPRC in the reduced model. Scaling the right-hand side of Eq. 6 leads to the system
 |
(8) |
Timescaling does not change the limit cycle shape but shortens or lengthens the period. Because timescaling effectively scales each of the rate parameters, we must be careful when applying it to a system with physically measured parameters. For parameters that are known, only small (i.e., <1 order of magnitude) scale factors should be permitted.
Shifting
To compare periodic curves, there must exist a mapping between the phase in the reduced model and the phase in the full model. In other words, we must relate each point on the full model's limit cycle to a corresponding point on the reduced model's limit cycle. We do this by finding the minimal difference between the pIPRCs. We shift the simulation time of the full model until it aligns with the pIPRC of the timescaled reduced model.
Magnitude-scaling
We assume that the magnitude of the pIPRC can be scaled (to within two orders of magnitude). This stems from the common use of signals (light or otherwise) constructed not with magnitudes that are known a priori, but with magnitudes fitted to a desired response. Therefore, it is reasonable to rescale the signals to match the rescaling of the pIPRC.
The error in the pIPRC of the reduced model is then given by
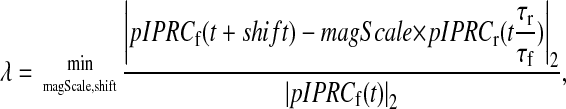 |
and evaluated over 0 ≤ t ≤ τf. It is combined with the magnitude-scaling penalization term,
 |
A good reduced model will have many fewer states than the full model, making Nr/Nf < 1. The period error will also be <100%, making 0.1 × δτ of O(0.1) or smaller. To match the pIPRC, a reduced model should have pIPRC error δpIPRC smaller than O(0.1). Together the terms of ζreduction should then be <1.
Implementation using a genetic algorithm
The minimization problem posed is a nonlinear integer programming problem with nonlinear constraints; the period and the pIPRC are nonlinear functions of the ODE system, and we are imposing a nonlinear constraint by requiring that the solution shows oscillations. Such problems are notoriously difficult to solve (25,26). The landscape of our cost function likely lacks differentiability and convexity—properties that would make it amenable to a deterministic optimization such as a gradient-based or branch-and-bound method. Here, the landscape's character is heavily influenced by the fact that the cost function is undefined wherever the system does not oscillate. The locations of these holes in the landscape are not generally known a priori and, due to the complex interplay of feedback loops often present in clock models, are not possible to predict accurately. Thus, we turn to a stochastic technique that allows us to navigate the landscape despite the presence of discontinuity and the lack of gradient information. Genetic algorithms are widely used stochastic search methods that operate by analogy to the natural process of evolution—populations of candidate solutions are improved via reproduction and survival of the fittest (i.e., lowest cost) (27–29). We use a genetic algorithm hybridized with a local deterministic search that exploits the system's Jacobian matrix to remove extraneous states.
Each individual in a genetic algorithm is defined by its genome—an array of genes encoding a potential solution to the optimization problem. For us, an individual is a candidate reduced model and is defined by its state inclusion/exclusion vector s. This means an individual's genome is a Boolean array of length Nf. The basic approach of a genetic algorithm is to create an initial population of candidate solutions, to evaluate their fitness, and then to create a new generation of solutions by breeding the fittest members. The process is repeated over many generations until some stopping criterion has been met. Because each new generation is bred from the fittest individuals of the previous generation, beneficial traits are passed along and harmful traits die out. For us, this means important states remain in the candidate solutions and unimportant states are excluded. A genetic algorithm is characterized by three genetic operators: selection, crossover, and mutation. Selection is the process by which individuals are chosen to breed. It is viewed as survival of the fittest, and the operator favors fitter individuals (30). A new individual is created by crossover and mutation of the selected parents' genomes. The genetic information of the two parents are first recombined (via crossover) to create an individual with a unique genome (for us, this means a unique configuration of states). The genome of the new individual is then mutated, creating diversity in the population, thereby allowing the search algorithm to escape local minima.
Our implementation of the genetic algorithm begins by pseudo-randomly generating an initial population 𝒫(0) of size Nc. (Note that each parent is a randomly-generated reduced model.) Then for each generation, we create Nc new individuals, or children (with real-valued costs). We use an elitist strategy: the best individual in the previous generation is copied into the current generation. The remaining children in generation i are created using the genetic operators of selection, crossover, and mutation according to the following algorithm:
Select parents p1 and p2 from 𝒫(i − 1).
Create child c using uniform crossover with p1 and p2.
Mutate the genes in child c.
Remove the states of child c deemed extraneous by the system Jacobian.
Compute cost ζreduction for child c.
If ζreduction ≥ 0, then add child c to 𝒫(i).
We use a linear ranking selection operator; each parent is chosen with a probability proportional to their fitness rank (i.e., the fittest parent is most likely to be chosen). To breed, we use a uniform crossover—each gene in child c's genome is chosen from either parent p1 or p2 with equal probability. Then we mutate each gene with probability 0.1, where mutation is simply a reversal of the flag from inclusion to exclusion of that gene or vice versa. Because the configuration is chosen randomly, some states may be extraneous and can be removed via a Jacobian-based local refinement method. After child c has undergone the local refinement, we determine its fitness by evaluating its cost function. If the cost is undefined then c is summarily executed and does not count toward the required Nc. We run the algorithm for several generations, until the fitness values converge. In the application below, we use 15 generations, with children in the final generations having costs ζreduction of O(0.25), surpassing the criteria given above for a good cost.
The local refinement technique deems a state in child c extraneous if:
It fails to feed-back into the system (a state does not feed-back into the system if it does not appear in the right-hand side of Eq. 6 for any other state included in child c), i.e., the state is an output only; or
It fails to be fed into by the system (a state is not fed into by the system if no terms involving any other state included in child c appear in the right-hand side of Eq. 6), i.e., the state is an input only.
An output-only state should be excluded, because it cannot affect the phase behavior of the system as whole. We exclude all input-only states on the grounds that they are not core clock components. Note that in the systems we have considered, the only states included in the full models are core clock components; however, there are models, such as those for the plant clock, that contain input-only states (31–34). The plant clock has an acute light-input state that should be permitted to remain. To determine which states are not core clock components, we exploit the system's Jacobian matrix, (Jik) = (∂fi(x, s, p)/∂xk). If Jik is nonzero, then the kth state affects the dynamics of the ith state. The entries on the diagonal report the effect of a state upon itself. As this contains no information about the state's relationship to the rest of the system, we exclude the diagonal from analysis, and instead consider  If the entire row
  is zero, there are no states affecting the dynamics of the ith state and it is input-only. Likewise, if the entire column
  is zero, the kth state is output-only. Using this information, we construct a new value for s and repeat the process until no additional states must be excluded. This refinement incurs negligible computational expense.
Because each generation contains many unique children, the genetic algorithm possesses an inherent parallelism. Multiple regions of the search space can be explored in parallel. As the algorithm proceeds, the average fitness of each generation is improved. This means that the final generation will contain not just one (nearly) minimal solution, but several. This population is amenable to further analysis, which reveals properties of the cost function landscape.
We benefit from another form of parallelism in the genetic algorithm. Because each child is created independently from the others, the formation of a generation is embarrassingly parallel. Thus, additional computing power in the form of a cluster is advantageous (we use the MATLAB Distributed Computing Toolbox (35)).
Sensitivity analysis
We propose that sensitivity analysis accompany model reduction as a high-level predictor of the feedback loops included in the reduced model. Historically, sensitivity analysis and model reduction have been closely connected. The classical sensitivity coefficient predicts the change in state trajectories resulting from a small parametric perturbation (36). In this and other forms, it has been used as a guide for model reduction (6)—reactions governed by rates having little or no affect on the system are eliminated. As emphasized in Petzold and Zhu (10), sensitivity analysis predicts the results of a small perturbation, and may not be the best predictor of elimination, which is a large perturbation. We do not propose that sensitivity analysis as described above be used directly to determine which states are eliminated by the model reduction, because it has the potential to lead us astray. For oscillatory systems in particular, feedback is often critical. If one reaction in a chain of reactions is deemed insensitive and removed, it could cut the feedback entirely, having a much larger effect than predicted. Rather, by looking at sensitivity of the components in an entire feedback chain, we observe which chains dominate.
To predict which states are important to maintain both oscillatory behavior and the response to a perturbation in parameter pj, we use two phase sensitivity measures. The first is the sIPRC for each state, which provides the timing effects due to a perturbation of that state (apart from any effect due to changes in pj). The second is the effect of pj through each state, a measure acquired by computing components of the cumulative phase sensitivity. The cumulative phase sensitivity (14,23,37) predicts the phase shift incurred by a long-term perturbation to pj, i.e., dφ/dpj(t) predicts the phase shift due to a perturbation to pj lasting from time 0 to time t (the implication is that the cumulative phase sensitivity is not a periodic measure—the effects of a perturbation accumulate over time, leading to greater phase shifts at time t1 + τ than at time t1). The long-term perturbation is defined according to
 |
(9) |
where  is the effect of pj through the kth state.
Application to mammalian model
A well-known detailed model of the mammalian clock is that of Forger and Peskin (38). It was designed with a potential for 73 species, and predicts that 12 are at zero concentration for all time (H. Mirsky, R. Gunawan, S. R. Taylor, J. Stelling, and F. J. Doyle 3rd, unpublished). Because we are demonstrating a model reduction technique and want to provide an honest account of our method's effectiveness, we remove the states whose values are fixed at zero and consider the resultant 61-state model (FP61) as our full model.
The model contains the proteins PER1, PER2, CRY1, CRY2, and REV-ERBα (in phosphorylated and unphosphorylated forms) and their mRNA. The components form five feedback loops, four of which are defined by PER and CRY. To provide a simplified description of the dynamics, we begin with PER1. Per1 mRNA is transcribed and translated into protein. This protein then dimerizes with either CRY1 or CRY2. The dimer enters the nucleus and its CRY component represses transcription of Per1, Per2, Cry1, and Cry2. PER2 follows the same pathway. Thus, there is a feedback loop associated with each of the dimers PER1:CRY1, PER1:CRY2, PER2:CRY1, and PER2:CRY2. The fifth loop is a double-negative feedback loop involving REV-ERBα and CRY1: Rev-erbα transcription is inhibited by CRY1 and CRY2, and REV-ERBα inhibits CRY1 transcription.
PER1 and PER2 are not interchangeable components in that PER1 exists in a doubly-phosphorylated form while PER2 does not. Likewise, CRY1 and CRY2 are not interchangeable because CRY1 is regulated by REV-ERBα while CRY2 is not. Additionally, the rate constants associated with their kinetics are different. However, a negative feedback loop of the form described above will still exist if either PER1 or PER2 and either CRY1 or CRY2 are removed. In that sense, although the PERs and CRYs are not mathematically interchangeable, they may be practically interchangeable for proper phase behavior and synchronization.
The purpose of the circadian clock is to regulate daily activities. It is therefore necessary for the population of cells in the SCN to coordinate their activity both with each other and with the environment. It follows that an essential function of a clock cell is to send coordinating signals and to adjust its phase properly to the coordinating signals it receives. Experimental evidence shows that light and intercellular signals manifest themselves in a similar manner (24,40). Therefore, we focus on the phase response to the light input parameter L, and the relevant pIPRC is denoted pIPRCL.
We reduce FP61 while preserving pIPRCL in investigations of two scenarios: a single-cell system and multicell coupled system. In the single-cell scenario, we answer the questions: Are the PERs and CRYs redundant? If so, are they truly redundant or is one necessary and the other unnecessary? Is the REV-ERBα loop required? In the multicell scenario, we create a population of cells to mimic the spontaneous synchronization found in vitro. Although population models have been created for the mammalian clock (41–43), none, to our knowledge, have used the Forger and Peskin model. The largest single-cell model used in a population has 16 states for the clock and 1 for a signal transduction pathway (43). By reducing the size of FP61, we are able to perform a similar analysis to that in To et al. (43). We add the components and dynamics necessary to couple the cells in a network and fit the new parameters using a population of reduced models. Applying this procedure directly to FP61 would be significantly more burdensome computationally. Below, we perform the parameter-fitting on a population of reduced models, achieving spontaneous synchronization. We then import the features into the full model, run the simulation, and observe the same synchronization behavior.
To apply the model reduction technique to FP61, we must describe the model-specific aspects of the method, i.e., choosing algorithm parameters and implementing the cost function. We hand-tune the algorithm parameters, choosing the number of individuals per generation based on past experience and the number of generations by observing the algorithm's convergence as we apply it. For the optimization problem, there are 61 Boolean optimization variables, and we find that 100 individuals provides adequate diversity. The remaining model-specific aspect is cost function implementation.
Cost function implementation
To implement the cost function, we must clarify what it means to eliminate a state from the model. In classical chemical kinetics, a common approach is to remove a state by removing all of the reactions in which it is involved (11). This is appropriate for our problem: because we are investigating the potential redundancy of feedback loops, when we remove a state, we want to completely cut its feedback and remove it from the model. However, we must treat reactions in biological models carefully. A reaction is more accurately dubbed a subprocess. For example, although nuclear transport is modeled as a single reaction (using mass-action kinetics), it is physically carried out by a sequence of biochemical reactions. Does it follow, then, that when we remove a state, we should remove all of the subprocesses in which it is involved? Yes, but, again, this must be implemented with care.
For example, consider the Cry1 transcription subprocess
 |
where trRo is the maximal rate of transcription, G is the probability that a CRY species is inhibiting transcription, and GRv is the probability that REV-ERBα is inhibiting transcription. The proper method to eliminate the state GRv is simply to set it to zero. Thus, we eliminate the subprocesses involving REV-ERBα and the Cry1 promoter region. We do not, however, eliminate the subprocesses involving CRY and the promoter region. It would be improper to remove the entire transcription subprocess from the model because inhibition by CRY and inhibition by REV-ERBα are independent processes.
We have found that the most effective way to remove a state from the model is to remove its dynamics and to set its value to 0. In other words, to remove xi, we set fi = 0 (removing reactions in which xi is a product) and set xi(0) = 0 (removing subprocesses in which xi is a substrate). This is effective for subprocesses such as transcriptional regulation (modeled with complicated kinetics) as well as for the remaining subprocesses (modeled with simpler kinetics). For the nontranscription subprocesses in FP61, setting the state to zero is the same as removing the entire subprocess. Thus, for the majority of the subprocesses, we are implementing state elimination in the classical chemical kinetics sense. Additionally, our implementation is straightforward to implement and is consistent with our claim that our model reduction procedure is fully automated.
Methodology for creating a multicell population
To illustrate the utility of the reduced model, we create a population model using a reduced model for each cell, and verify that it captures the salient features of a population of FP61 cells. Our methodology is modeled after that in To et al. (43), replacing Leloup and Goldbeter's 16-state model (44) with FP13 as the core oscillator in each cell. We arrange 50 cells in a two-dimensional grid and introduce all-to-all coupling via the neuropeptide VIP. VIP is released by each cell in-phase with its Per2 mRNA concentration. The amount of VIP that reaches each cell in the population decreases with the square root of its distance from the sender. When VIP reaches a cell, a signal is transduced along a cascade involving calcium and the protein CREB. The presence of CREB increases the rate of Per2 mRNA transcription by manipulating the parameter associated with light L. (Note that in (43), the signal ultimately manifests as a modulation of the parameter associated with the maximal rate of transcription, νSP. This is the standard parameter associated with light in their core model. We use L because it is the standard parameter associated with light in our core model.) The signal cascade is composed of one ODE and several algebraic equations and is assumed to be identical in all cells. It introduces 13 parameters which we estimate (in the context of the coupled population) using an evolutionary strategy—a variant of the genetic algorithm designed specifically for optimization of continuous variables (45). We maximize a cost function that is dependent upon the ability of the population to synchronize spontaneously and the percentage of cells demonstrating sustained oscillations.
The degree of synchrony, or synchronization index, is determined by the radius of the complex order parameter (43,46), which measures the difference between the peak times of a state component within a given cycle. For a perfectly in-phase synchronized system, the concentration of Per2 mRNA in all cells will peak together and yield an order parameter radius r = 1. To measure the ability of a population to synchronize spontaneously, we simulate the population uncoupled for 100 h, enable the coupling mechanism, simulate 150 additional hours to allow for synchronization, then compute a cost function using an additional 150 h of simulation (during which the system should already be synchronized). For 150 h of simulation, this means we simulate five or six cycles, depending upon the period. We compute the order parameter for both nuclear Per2 mRNA and active CREB. To ensure that the intercellular signaling is truly synchronizing oscillators, we count the number of sustained oscillators in the coupled population. If the number is low, then the signaling is destroying some oscillators and the parameters should be rejected. We check the period of each sustained oscillator to ensure there is no deviant behavior such as period-doubling. The cost ζsync is computed according to
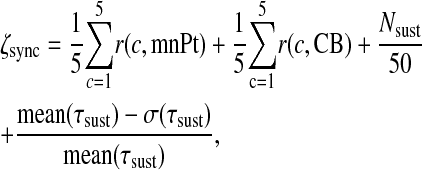 |
where r(c, X) is the order parameter radius for cycle c using the time course for state X, mnPt and CB contain the time courses of nuclear Per2 mRNA and active CREB for all 50 cells, respectively, Nsust is the number of cells that show sustained oscillations, τsust is the vector of periods of oscillation of the sustained cells for cycles 1–5, mean(τsust) is its mean, and σ(τsust) is its standard deviation. A perfectly synchronized system will have cost ζsync = 4 because each of its terms will be 1—the first two terms find the average order term over five cycles and 1 indicates perfect synchrony, and the third term will be 1 if all cells are showing sustained oscillations, and the fourth term will be 1 if the periods of all cells are identical.
The main differences between the evolutionary strategy and the genetic algorithm outlined above lie in selection and mutation. The evolutionary strategy promotes the fittest members of each generation to the status of parent. Each child in the subsequent generation is created from two parents (chosen from a uniform distribution). Mutation is more sophisticated than that in the genetic algorithm—a set of strategy parameters is used to dynamically adjust the mutation strength, allowing for self-adaptation (45). After estimating parameters using the reduced-model population, we compare the results of the reduced-model population to those of the full-model population. To replace the core oscillator from the reduced to the full model, we must scale the input to and output from the signal transduction network within each cell. The input is the concentration of VIP, which is linearly dependent upon the concentration of nuclear Per2 mRNA in all cells. To scale the input, we simply divide the amplitude of nuclear Per2 mRNA in an isolated reduced model cell by that in an isolated full model cell (both with nominal parameter sets). The output ΔL is the amount by which L is modulated by the signal. Recall that during the model reduction procedure, we compute a scale, magScale, accounting for differences between the magnitude of pIPRCL in the full and reduced models. The inverse of magScale must be used to scale ΔL.
RESULTS
Sensitivity analysis
In Fig. 1, we show the relative sIPRC for each state, i.e., the sIPRC for the kth state is scaled by that state's peak/trough amplitude. The goal of the sensitivity analysis is not to examine each state individually, but to predict the relative importance of the five feedback loops (identified by the four dimers PER1:CRY1, PER1:CRY2, PER2:CRY1, and PER2:CRY2 and by REV-ERBα). Thus, the sIPRCs are drawn so that all forms of mRNA and monomer proteins of the same species share the same line style. Likewise, each PER:CRY dimer has one line style used to represent multiple states. To preserve at least one of these loops, at least one form each of CRY and PER is required. Because each monomer appears in two loops, we display their sIPRCs separately. We then compute the cumulative phase sensitivity (Eq. 9) with respect to light  and show the effect of light
  through each state xk in Fig. 2, with curves grouped as for the sIPRCs. This measure is shown over two circadian cycles to illustrate its cumulative nature—the effect of light is stronger when it has been shone on the system for a longer period of time.
FIGURE 1.

Relative sIPRCs over one circadian cycle. Shown are relative sIPRCs for all mRNA and monomer protein species of (A) PER and (B) CRY. All forms of PER1 and CRY1 are shown with shaded lines while all forms of PER2 and CRY2 are shown with dotted lines. (C) Shown are relative sIPRCs for all forms of PER:CRY dimers—PER1:CRY1 (dotted shaded lines), PER1:CRY2 (shaded lines), PER2:CRY1 (dotted dark lines), and PER2:CRY2 (solid lines). All relative sIPRCs with magnitudes reaching five or greater are of dimers containing PER2. (D) The relative sIPRCs of all forms of REV-ERBα are negligible in magnitude.
FIGURE 2.

Contribution of each state to the phase sensitivity of L over two circadian cycles. Shown are  for all mRNA and monomer protein species of (A) PER and (B) CRY. All forms of PER1 and CRY1 are shown with shaded lines while all forms of PER2 and CRY2 are shown with dotted lines. (C) Shown are
  for all forms of PER:CRY dimers—PER1:CRY1 (dotted shaded lines), PER1:CRY2 (shaded lines), PER2:CRY1 (dotted dark lines), and PER2:CRY2 (solid lines). All
  with magnitudes reaching 0.05 or greater are of dimers containing PER2. (D)
  for of all forms of REV-ERBα are negligible in magnitude.
Single-cell model reduction
To analyze both the results of the model reduction and the algorithm itself, we ran the algorithm 16 times. For Run 1, the genetic algorithm evolves over 22 generations, with 100 individuals in each generation and produces a lowest cost individual with 13 states and cost ζreduction = 0.2705 (Fig. 3). Because Run 1 converges in only 15 generations, the remaining runs evolve only 15 generations. Run 2 produces a lowest cost individual again with 13 states, but with cost ζreduction = 0.2604. Runs 3–16 produce seven lowest cost individuals identical to that in Run 1, and seven identical to that in Run 2, strongly suggesting there are two global minima. For all runs, the period/pIPRC error is ∼0.05 for all fit individuals, which means that the number of states almost entirely determines the cost. The mean time to create a generation is 48 min, using the MATLAB Distributed Computing Toolbox on 24 processors of a 48-node cluster of dual 2.8 GHz Intel Xeons. Earlier generations require ∼20% more time, and later generations require ∼8% less time. This decreasing trend in computation time is due almost entirely to decreasing model size—the mean runtime per generation correlates with the mean model size per generation (R2 = 0.91).
FIGURE 3.

Cost and model size of the 10 fittest individuals from each of 22 generations. The earliest generations are shown in blues and the latest are shown in reds.
Run 1 generates solutions incorporating only the PER2:CRY2 feedback loop while Run 2 generates solutions with PER2:CRY1. To investigate the pathway to the two global minima, we examine the feedback loops included in all generations of Runs 1 and 2. In Fig. 4, we identify the loops that are at least partially included in the early generations. For each individual with a pIPRC/period error term (0.1 × δτ + 1 × δpIPRC) < 2, we determine which of the four negative feedback loops are included. (If s indicates that both nuclear and cytosolic mRNA along with the (unphosphorylated) monomer form of a protein are included, then we assume it can participate in a feedback loop.) For each generation, we count the number of models that include each of the loops. These numbers are reported for the first run in Fig. 4 A and the second run in Fig. 4 B. We plot only the parents (generation 0) and the first three generations because subsequent generations are dominated by a single feedback loop. For the first run, this is PER2:CRY2, and for the second it is PER2:CRY1.
FIGURE 4.

Evolution of feedback loops. To compare the performance of two runs, shown are feedback loop information for the parents (generation 0) and each of the first three generations. For each generation, the number of models that include each of the negative feedback loops (PER1:CRY1, PER1:CRY2, PER1:CRY1, and PER2:CRY2) are plotted. As the runs evolve, one feedback loop begins to dominate the generation. For Run 1 (A) this is PER2:CRY2, and for Run 2 (B) it is PER2:CRY1.
To determine the relative merits of the states included in the PER2:CRY1 and PER2:CRY2 loop, we examine the fit (ζreduction < 0.5) 12- and 13-state models produced by Runs 1 and 2. In some cases, a 13-state model contains a state that does not participate in the feedback loop (note that in these cases, the system's Jacobian did not detect them as extraneous because of an algebraic constraint) and we discard the state, studying the 12-state model that remains. For each of Runs 1 and 2, there are seven unique configurations. The 10 states representing PER2 and CRY2 mRNA and cytosolic monomers are shared by all PER2:CRY2 reduced models and the analogous 10 states are present in all PER2:CRY1 reduced models. To complete the negative feedback loop, additional states are necessary—the PER2 and CRY proteins must form heterodimers in the cytoplasm and be transported into the nucleus. It is these cytosolic dimerization (there are two dimerization pathways—one associates CRY2 with singly-phosphorylated PER2 while the other associates CRY2 with a kinase-singly-phosphorylated PER2 complex) and nuclear import pathways (there are two nuclear import pathways—one imports the PER2:CRY2 heterodimer by itself, the other in a complex with a kinase) that differentiate the reduced models (see Table S2 and Table S3 in the Supplementary Material). The fittest 13-state models in both runs involve one dimerization pathway and both import pathways while the second fittest involve both dimerization pathways and only one import pathway. Less fit models include only one of each pathway. In Run 1, there are two models and in Run 2, there is one model which also allows for PER2 complexed with a kinase to be transported into and out of the nucleus. In Run 2, there is one model that also allows the nuclear dimer to disassociate. For both cases, the additional processes hinder performance slightly.
We then examine the behavior of the two global minima. Recall that each solution involves s* (the state inclusion/exclusion vector), magScale (the scale factor applied to the magnitude of the pIPRC in the reduced model), and shift (the shift in time applied to the full model to provide maximal agreement between the pIPRCs of the full and reduced models). The reduced model is then given by  with period τr. We timescale each minimal solution to match the period τf of FP61 (according to Eq. 8) and label the resulting models FP13 (the minimum from Run 1) and FP13B (the minimum from Run 2).
FP13 contains only the feedback loop involving PER2 and CRY2. In Fig. 5 A, we show the traces of four PER2 and CRY2 components in FP61 and FP13. They are plotted in circadian time (CT), meaning that the period is scaled to 24 circadian hours and CT0 represents dawn. For FP61, CT0 is defined to occur ∼7 h before the peak of cytosolic Per2 mRNA. CT0 for FP13 is mapped to CT0 in FP61 using shift. Recall that shift is set to ensure maximal agreement between the pIPRCs in the full and reduced models. Fig. 5 B shows that, when shifted and scaled (using magScale), the pIPRCs are in near perfect agreement. Fig. 5 C shows that numerical experimental PRCs for the two models are nearly identical. PRCs to 1-h square pulses of light are collected for FP61 and FP13 using four levels of light strength. We use the convention presented in Forger and Peskin (47), where the constant lon = 3.39 × 10⁻⁴ and L ∈ [8lon, 150lon], and choose four values for L causing maximal phase shifts of <12 circadian hours (8lon, 16lon, 24lon, and 32lon). We then generate the same plot for FP13B (Fig. S1 in the Supplementary Material), which contains only the feedback loop involving PER2 and CRY1, and observe that the results are nearly identical.
FIGURE 5.

Comparison of the full (FP61) and reduced models (FP13). (A) Shown are the trajectories of Per2 cytoplasmic mRNA (McPt), PER2 monomer (Pt), Cry2 cytoplasmic mRNA (McRt), and CRY2 monomer (Rt) for FP61 and FP13. For FP61, dawn (CT0) is set such that cytoplasmic Per2 mRNA peaks at ∼CT7. (B) Shown are the pIPRC to light for FP61 and the scaled pIPRC to light for FP13. FP13 is shifted (in time) to show maximal agreement. That same shift is used to plot all FP13 data. (C) Numerical experimental PRCs for 1-h pulses of light at strengths 8, 16, 24, and 32 lon are shown for FP61 (blue) and FP13 (red). The magnitudes of the PRCs increase with the strength of light.
Multicell model
We create the coupled population as outlined above. To introduce heterogeneity into the population, we choose the FP13 parameters for each cell from a normal distribution centered at the nominal value with a standard deviation of 5%. Here we deviate from the procedure in To et al. (43), creating diversity among the periods and trajectories of the cells but not creating a subpopulation of damped oscillators, because neither FP61 nor FP13 have a suitable parameter that is close to a bifurcation boundary. We emphasize that this is not a result of the model reduction procedure, but a difference between the full Leloup and Goldbeter and FP61 models. Our implementation of the evolutionary strategy is modeled after that in Zeilinger et al. (34). We use 24 parents to create 120 children per generation, running the algorithm for 15 generations. The fittest progeny has cost ζsync = 3.6407. In Fig. 6 B, we show a simulation using this parameter set. The population is uncoupled for 100 h and coupled for 600 h. A single trace, representing the sum of all forms of PER2 protein, is shown for each cell. The data is normalized to the height of the tallest PER2 peak in the last cycle of the synchronized populations. In the lower panel, we indicate r for each cycle showing that the system begins unsynchronized in the first five cycles, increases in synchrony with coupling between cycles 5 and 10, achieves synchrony by cycle 10, and maintains it thereafter. In Fig. 6 B, we show the period distribution for the population. The coupled synchronized population (hour 400 to hour 700 in Fig. 6 B) has 48 sustained oscillators with a mean period of 23.5, while the uncoupled population (hour 0 to hour 100 in Fig. 6 B) has 49 sustained oscillators with a mean period of 23.9 h. There is a significant decrease in the period dispersion when coupling is introduced, with the exception of one cell whose period fails to entrain to the rest of the population. When the outlier is excluded, the standard deviation of the period decreases from 0.41 h to 0.06 h with coupling. The simulation's computation time is 6 min.
FIGURE 6.

Simulations of 50 cells. We show the simulation results for populations of (A) 50 FP61 cells and (B) 50 FP13 cells. Intercellular signaling is initiated at hour 100. In the upper plots, we show the synchronization index (0 = asynchrony and 1 = perfect synchrony). Both populations are synchronized at approximately the 10th cycle. In the lower plots, we show the traces of the sum of all forms of PER2 protein for each cell. The data is normalized to the height of the tallest PER2 peak in the last cycle of the synchronized populations.
We replace FP13 with FP61 in the 50-cell population, incorporating the two scaling factors described above (magScale and the Per2 amplitude scale). The cost associated with the new population model is ζsync = 3.6610. In Fig. 6 A, we show a normalized simulation of the population (100 h uncoupled, 600 h coupled) and r for each cycle. As above, the evolution of r shows that the system begins unsynchronized in the first five cycles, increases in synchrony with coupling between cycles 5 and 10, achieves synchrony by cycle 10, and maintains it thereafter. The coupled synchronized population (hour 400 to hour 700 in Fig. 6 A) has 47 sustained oscillators with a mean period of 23.4, while the uncoupled population (hour 0 to hour 100 in Fig. 6 A) has 50 sustained oscillators with a mean period of 23.9 h. As above, there is a significant decrease in the period dispersion when coupling is introduced with the exception of one cell whose period fails to entrain to the rest of the population (Fig. 7). When the outlier is excluded, the standard deviation of the period decreases from 0.49 h to 0.09 h with coupling. The simulation's computation time is 148 min.
FIGURE 7.

Histograms of periods in cell populations. We show the periods of the cells in the FP13 (left column) and FP61 (right column) populations, with coupling (upper row) and without coupling (bottom row). The text in each plot indicates the mean ± standard deviation of the periods measured in hours. For each coupled population, there is one outlier, which is shown in shaded representation. For these plots, the solid text refers to the data without the outlier, and the shaded text refers to data including the outlier.
The coupling parameters were fitted to one particular set of 50 cells. To illustrate the robustness of the population model with respect to additional variability in the population, we simulate the 50-cell population with five additional sets of (core model) parameters (for 100 h uncoupled and 300 h coupled) and find that the cost ζsync is ∼3.5 for all populations (full and reduced). The mean simulation time is 5 min for the reduced model population and 99 min for the full model population. (Note that the simulation times reported here are for 400 h of simulation, whereas they are for 700 h in the simulation data shown above.) Additionally, we demonstrate that the system is capable of synchronizing despite varying population sizes, simulating 10 reduced model and 10 full model populations of sizes 10, 50, 100, and 150. To alleviate the memory requirements for the population's Jacobian matrix, we provide MATLAB's ordinary differential equation solver (ode15s) with its sparsity pattern. The results indicate that the mean cost is relatively constant across all populations, with the mean for the reduced population at 3.4 (with a small reduction to 3 for a population size of 150) and the mean for the full population at 3.5. The simulation speed is 3–4 times faster for the reduced model than the full model populations (see Table S1). For a reduced model population, it ranges from 6 s for 10 cells to 143 s for 150 cells. For a full model population, it ranges from 21 s for 10 cells to 471 s for 150 cells.
DISCUSSION
Phase-based sensitivity analysis supplies high-level predictions regarding the outcome of the model reduction with minimal computation time. (The sensitivity analysis requires between 4 and 8 min using MATLAB on a 2.99-GHz Intel Pentium processor; MATLAB, The MathWorks, Natick, MA.) Both the relative sIPRCs (Fig. 1) and the cumulative phase sensitivity (Fig. 2) reveal the same properties: PER2 dominates, the CRYs are not dramatically different, and REV-ERBα is unnecessary. The relative sIPRCs provide the relative contributions of each state to the timing of the oscillator. In Fig. 1 A, we see that PER2 has a much stronger affect on the system than PER1. The two CRYs are less distinguishable—Fig. 1 B shows that, although the curve with the highest magnitude is related to CRY1, it is not significantly higher than all CRY2 curves. Fig. 1 C shows that the two dimers involving PER2 dominate the system's timing behavior. Additionally, Fig. 1 D shows that all REV-ERBα states are unimportant to the oscillator's timing and will likely be removed in the reduced model. (It should be noted that the amplitudes of the REV-ERBα components are very small in magnitude and that we are not the first to remove them from the system.)
Fig. 2 shows that taking the effects of light into account does not affect our conclusions. Light enters this system by inducing transcription of both Per1 and Per2 mRNA, in both cases as an additive term. Thus, its effect on the rates of transcription are identical and it is not surprising that the relative contributions of PER1 and PER2 are not significantly different between Fig. 1 and Fig. 2. It is more surprising that the CRY measures are similar. This is explained by the dxk/dL component of κ—for this system, dxk/dL and dφ/dxk rank the states in nearly the same order of importance (data not shown). In other words, light has the strongest effect on precisely those states that have the strongest effect on the timing. (One might expect a large value of dxk/dL to enhance the value of κ, showing exaggerated results. However, this does not happen because the traces of dxk/dL and dφ/dxk do not have high magnitudes at precisely the same times.) We do note that the effects of a parametric perturbation over time are difficult to predict in a system with a complicated topology and nonlinear kinetics.
The prediction of sensitivity analysis is that in the reduced model PER2 will be retained, either CRY1 or CRY2 will be retained, and PER1 and REV-ERBα will be removed. The model reduction procedure demonstrates the accuracy of these predictions—it generates FP13 (containing PER2 and CRY2 only) and FP13B (containing PER2 and CRY1 only) with equal frequency. However, we emphasize that sensitivity analysis does not predict precisely which states must be included in the reduced model, but focuses on the feedback loops in their entirety. Sensitivity analysis by itself would not be adequate (and, in some cases could be misleading)—if only sensitivity analysis were used, there would be 17 states in the reduced models. (The sensitivity analysis does not provide a clear difference between important and unimportant states within the feedback loops. This means we would include all states potentially involved in the loops, which for both the PER2:CRY2 and PER2:CRY1 models there would be 17 states.) However, it is a computationally inexpensive analysis that leads us to greater confidence in the fully automated reduction process.
Our model reduction algorithm effectively reduces Forger and Peskin's 61-state mammalian model to 13 states—a fivefold reduction in size. We have also learned that, for this system, simply removing states is sufficient to retain proper pIPRC behavior—the error is ∼0.05, which leads to near-perfect agreement between the scaled reduced model pIPRC and the full model pIPRC (Fig. 5 B). The fittest individual has 13 states, and although 12-state models do exist for the given set of parameters, these models do not achieve small enough period/pIPRC errors to become fitter than the best 13-state models. However, the assumption that the parameters are known and fixed may not be biologically accurate. This raises an important question: How does parametric uncertainty affect the outcome of the reduction? To answer this question thoroughly, we propose an extension of our method (see Data S1 in the Supplementary Material) which allows for parametric variation during the optimization procedure. By including all unknown parameters (parameters that have been measured physically should remain fixed or tightly constrained) as optimization variables, we may find an alternate, fixed set, of parameters that will lead to a new global minimum. If particular configurations of the system are highly sensitive to parameter values and are forced over a bifurcation point (to a steady-state solution), we expect them to be excluded from the population. Thus, we expect parametric variation to exclude candidates that are not robust oscillators and to improve candidates that are robust oscillators but whose parameters are not optimal. Preliminary investigations with FP61 indicate that no configurations are excluded—i.e., that the model is reduced to either the PER2:CRY1 loop or the PER2:CRY2 loop. Additionally, by adding parameter estimation, one additional state may be removed from FP13 or FP13B. The cost of the fittest 12-state model in one run using the extended method was ζreduction = 0.2572, showing only marginal improvement over the costs of FP13 and FP13B. We ran an additional parameter-only estimation for the 12-state model, and further reduced the cost to ζreduction = 0.2083, illustrating that parameter fitting does improve the fitness of a candidate, but for this model the improvement is not significant. These data together suggest that, for FP61, parametric variation has no deleterious effect on the outcome of the reduction.
We have learned that only one of the negative feedback loops is necessary to preserve the essential limit cycle features and light-signal phase response behavior. Fig. 4 shows that either the PER2:CRY1 or PER2:CRY2 loop is retained—a pattern present in all 14 runs of the optimization. We conclude that loops involving PER1 and REV-ERBα are redundant; each optimization removes them from consideration in the early generations. It is also apparent that PER2:CRY1 and PER2:CRY2 are interchangeable—not only is it the case that either one or the other is present in all fit candidates, but further examination of the reduced models reveals that the kinetic expressions for the two loops are structurally equivalent (they are differentiated by parameters only). To determine the roles of states within each loop, we examine the seven unique 12- and 13-state models produced by each of Runs 1 and 2. Both sets of reduced models follow the same pattern, i.e., analogous models have analogous fitness levels (Table S2 and Table S3). They perform best when there are multiple nuclear import pathways or multiple dimerization pathways. Also, the choice of dimerization pathway has little effect on the fitness, while the choice of nuclear important pathway has a moderate effect—models importing the heterodimer by itself are fitter than those importing the heterodimer in complex with a kinase. Significantly, these results are independent of the parameter choices. Many reactions in the PER2:CRY1 and PER2:CRY2 loops use different rate constants, leading to distinct component trajectories. The nearly identical trends in state composition and fitness across the two sets of reduced models indicates that these are properties of the regulatory structure itself.
FP13 is remarkably faithful to FP61. Even though the phase relationships between the various components are not considered by the cost function, they are preserved (Fig. 5 A). Also, even though the phase-mapping is determined by the pIPRCs alone, the peak times of the components are close to those of the full model, e.g., cytoplasmic Per2 mRNA peaks at CT6.9 in the full model and at CT7.9 in the reduced model (Fig. 5 A). The numerical experimental PRCs show that the pIPRC is a good predictor of the phase response behavior (Fig. 5 C) and that preserving it is a good alternative to preserving experimental PRCs to signals of various strengths and waveforms. This is particularly beneficial, because we use the model in the context of intercellular communication. We do not know the intercellular signal shapes a priori, and it is more efficient to compute the pIPRC than to compute PRCs to multiple candidate signals. An important property of the SCN is heterogeneity among the individual cells—in our model the periods in the uncoupled case form a distribution with a standard deviation of ∼0.5 h (Fig. 7). To create that distribution with FP61, we sampled each parameter from a normal distribution with a 5% standard deviation. Performing the procedure on the FP13 population produced nearly the same distribution (Fig. 7). Thus, FP13 inherited its parametric period sensitivity from FP61. The implication of FP13 and FP61 PRC experiments and period distributions is that FP13 shares the same robustness properties as FP61. (Again, we note that the data shows some damped oscillators in uncoupled SCN cells and that FP61 is not close enough to a bifurcation point to simulate this behavior. What is important to this study is that the reduction procedure preserves robustness properties.)
We created a spontaneously synchronizing coupled population with the reduced model, and demonstrated that it was suitable for study in place of a coupled full-model population. The coupling mechanism parameters were fitted to the reduced population, and then imported into the full model population, with the addition of only two scaling factors (one each for the input and output of the signal transduction network). In Fig. 6, we show the population behavior first without and then with intercellular coupling for both populations. The similarity in their emergent behaviors is striking, specifically with regard to the evolution of the degree of synchrony and the period of the synchronized population. In both cases, the population begins in an asynchronous state with mean periods of 23.9 h, takes approximately five cycles to synchronize, and maintains a synchronized state. In the synchronized state, mean periods are 23.5 (FP13) and 23.4 (FP61) h, and the standard deviations (without the outlier cell) are <0.1 h (Fig. 7), demonstrating that coupling confers precision to population timekeeping. In addition to the periods and degree of synchrony, the amplitude response of PER2 is preserved. In both cases, PER2 protein levels decrease in amplitude when coupling is introduced. Levels partially recover over several cycles, but remain at approximately two-thirds the uncoupled amplitude. Both timing and amplitude features are preserved by the reduced model population and the reduced model has large computational advantages over the full model population—the reduced model population uses just over one-fifth the memory and less than one-third the computation time of the full model population. Additionally, we have shown that the same coupling mechanism causes the same behavior (in terms of the synchronization cost function) despite variations in core model parameters and in population sizes. Thus the FP13 population is sufficient to study the synchronization properties of the biological system. The key mechanistic insight here is that only one negative feedback loop (of four negative and one double-negative feedback loops) in each core oscillator is necessary to preserve the synchronization properties of the population. The emergent behaviors are not dependent upon interlocking feedback loops, but on proper phase response behavior. Significantly, these insights were captured by our automated model reduction method.
Biological data show that the mean period increases from 23.5 to 23.98 h and the period variability decreases (from a standard deviation of 1.28 to 0.32 h) with coupling (24). This model captures the decrease in dispersion but not the increase in period. Additional experiments show that PER2 protein levels increase in the presence of signaling (48). Surprisingly, we see the opposite effect in the current model. This is counterintuitive because signaling increases the rate of Per2 mRNA transcription and we expect increased transcription to lead to increased protein levels. Further experimental evidence indicates that 70% of the uncoupled oscillators are damped (49), but we are unable to capture this effect because none of the parameters in FP61 are close to a bifurcation boundary (38), a property inherited by FP13. In contrast, the population model in To et al. (43) reproduces the increase in PER levels, the correct trend in period lengths, and the subpopulation of damped oscillators with the same signal transduction network. The difference in period response is likely due to the difference in pIPRCs between FP13 and the core model in To et al. (43) by Leloup and Goldbeter (44) (LG16). We showed in Taylor et al. (50) that the relationship between signal and pIRPC for a single cell predicts the period of the entire population. In this case the signal shapes are similar, but the pIPRCs are different. The pIPRC in LG16 has a region of large delays when the signals are active (data not shown), whereas the FP13 (and FP61) pIPRC has smaller delays and the signal is active in both delay and advance areas of the pIPRC. The large delay region in the LG16 pIPRC allows intercellular signaling to slow down the oscillators, lengthening the coupled population's period. Neither model matches the data perfectly—the LG16 population has the correct trend, but lengthens the period from 22 to 27 h. To better understand the in vivo mechanism, the differences between the two models should be explored, with special attention paid to the shape of the pIPRC and the distance to a bifurcation boundary, which may require additional modeling. It is beyond the scope of this work to incorporate new elements to the Forger and Peskin model or to do an in-depth analysis of the differences between the reduced Forger and Peskin model and the Leloup and Goldbeter model. The results in this work show that such an analysis is warranted and that it can be accomplished using the reduced rather than the full Forger and Peskin model.
SUPPLEMENTARY MATERIAL
To view all of the supplemental files associated with this article, visit www.biophysj.org.
Acknowledgments
We thank Henry Mirsky for helpful discussions and an anonymous reviewer for insightful comments and questions.
This work was supported by the Institute for Collaborative Biotechnologies through grant No. DAAD19-03-D-0004 from the U.S. Army Research Office (to F.J.D.), National Science Foundation's Integrative Graduate Education and Research Traineeship grant No. DGE02-21715 (to S.R.T., F.J.D., L.R.P.), National Science Foundation/National Institute of General Medical Sciences grant No. GM078993 (to S.R.T., F.J.D., L.R.P.), Army Research Office grant No. W911NF-07-1-0279 (to F.J.D.), and National Institutes of Health grant No. EB007511 (to L.R.P.).
Editor: Jason M. Haugh.
References
- 1.Kepler, T. B., L. F. Abbott, and E. Marder. 1992. Reduction of conductance-based neuron models. Biol. Cybern. 66:381–387. [DOI] [PubMed] [Google Scholar]
- 2.Lam, S. H., and D. A. Goussis. 1994. The CSP method for simplifying kinetics. Int. J. Chem. Kinet. 26:461–486. [Google Scholar]
- 3.Maas, U., and S. B. Pope. 1992. Simplifying chemical kinetics: intrinsic low-dimensional manifolds in composition space. Combust. Flame. 88:239–264. [Google Scholar]
- 4.Fraser, S. J. 1988. The steady state and equilibrium approximations: a geometrical picture. J. Chem. Phys. 88:4732–4738. [Google Scholar]
- 5.Roussel, M. R., and S. J. Fraser. 1990. Geometry of the steady-state approximation: perturbation and accelerated convergence methods. J. Chem. Phys. 93:1072–1081. [Google Scholar]
- 6.Turányi, T. 1990. Sensitivity analysis of complex kinetic systems. Tools and applications. J. Math. Chem. 5:203–248. [Google Scholar]
- 7.Briggs, G. E., and J. B. S. Haldane. 1925. A note on the kinetics of enzyme action. Biochem. J. 19:338–339. [DOI] [PMC free article] [PubMed] [Google Scholar]
- 8.Okino, M., and M. Mavrovouniotis. 1998. Simplification of mathematical models of chemical reaction system. Chem. Rev. 98:391–408. [DOI] [PubMed] [Google Scholar]
- 9.Edwards, K., T. Edgar, and V. Manousiouthakis. 1998. Kinetic model reduction using genetic algorithms. Comput. Chem. Eng. 22:239–246. [Google Scholar]
- 10.Petzold, L. R., and W. Zhu. 1999. Model reduction for chemical kinetics: an optimization approach. AIChE J. 45:869–886. [Google Scholar]
- 11.Androulakis, I. P. 2000. Kinetic mechanism reduction based on an integer programming approach. AIChE J. 46:361–371. [Google Scholar]
- 12.Sirdeshpande, A. R., M. G. Ierapetritou, and I. P. Androulakis. 2001. Design of flexible reduced kinetic mechanisms. AIChE J. 47:2461–2473. [Google Scholar]
- 13.Conzelmann, H., J. Saez-Rodriguez, T. Sauter, E. Bullinger, F. Allgöwer, and E. D. Gilles. 2004. Reduction of mathematical models of signal transduction networks: simulation-based approach applied to EGF receptor signaling. IET Syst. Biol. 1:159–169. [DOI] [PubMed] [Google Scholar]
- 14.Taylor, S. R., R. Gunawan, L. R. Petzold, and F. J. Doyle 3rd. 2008. Sensitivity measures for oscillating systems: application to mammalian circadian gene network. IEEE Trans. Automat. Contr. 153:177–188. [DOI] [PMC free article] [PubMed] [Google Scholar]
- 15.Reference deleted in proof.
- 16.Forger, D. B., and R. E. Kronauer, 2002. Reconciling mathematical models of biological clocks by averaging on approximate manifolds. SIAM J. Appl. Math. 62:1281–1296. [Google Scholar]
- 17.Goussis, D. A., and H. N. Najm. 2006. Model reduction and physical understanding of slowly oscillating processes: the circadian cycle. Multiscale Model Sim. 5:1297–1332. [Google Scholar]
- 18.Tyson, J. J., C. I. Hong, C. D. Thron, and B. Novak. 1999. A simple model of circadian rhythms based on dimerization and proteolysis of PER and TIM. Biophys. J. 77:2411–2417. [DOI] [PMC free article] [PubMed] [Google Scholar]
- 19.Indic, P., K. Gurdziel, R. E. Kronauer, and E. B. Klerman. 2006. Development of a two-dimension manifold to represent high dimension mathematical models of the intracellular mammalian circadian clock. J. Biol. Rhythms. 21:222–232. [DOI] [PubMed] [Google Scholar]
- 20.Winfree, A. T. 2001. The Geometry of Biological Time. Springer, New York.
- 21.Kuramoto, Y. 1984. Chemical Oscillations, Waves, and Turbulence. Springer-Verlag, Berlin.
- 22.Brown, E., J. Moehlis, and P. Holmes. 2004. On the phase reduction and response dynamics of neural oscillator populations. Neural Comput. 16:673–715. [DOI] [PubMed] [Google Scholar]
- 23.Kramer, M., H. Rabitz, and J. Calo. 1984. Sensitivity analysis of oscillatory systems. Appl. Math. Model. 8:328–340. [Google Scholar]
- 24.Herzog, E. D., S. J. Aton, R. Numano, Y. Sakaki, and H. Tei. 2004. Temporal precision in the mammalian circadian system: a reliable clock from less reliable neurons. J. Biol. Rhythms. 19:35–46. [DOI] [PubMed] [Google Scholar]
- 25.Biegler, L. T., and I. E. Grossmann. 2004. Retrospective on optimization. Comput. Chem. Eng. 28:1169–1192. [Google Scholar]
- 26.Grossmann, I. E., and L. T. Biegler. 2004. Part II. Future perspective on optimization. Comput. Chem. Eng. 28:1193–1218. [Google Scholar]
- 27.Goldberg, D. E. 1989. Genetic Algorithms in Search, Optimization, and Machine Learning. Addison-Wesley Publishing Company, Reading, MA.
- 28.Davis, L., editor. 1991. Handbook of Genetic Algorithms. Van Nostrand Reinhold, New York.
- 29.Michalewicz, Z. 1996. Genetic Algorithms + Data Structures = Evolution Programs, 3rd Ed. Springer, New York.
- 30.Goldberg, D. E. 1994. Genetic and evolutionary algorithms come of age. Commun. ACM. 37:113–119. [Google Scholar]
- 31.Locke, J. C. W., A. J. Millar, and M. S. Turner. 2005. Modeling genetic networks with noisy and varied experimental data: the circadian clock in Arabidopsis thaliana. J. Theor. Biol. 234:383–393. [DOI] [PubMed] [Google Scholar]
- 32.Locke, J. C. W., M. M. Southern, L. Kozma-Bognár, V. Hibberd, P. E. Brown, M. S. Turner, and A. J. Millar, 2005. Extension of a genetic network model by iterative experimentation and mathematical analysis. Mol. Syst. Biol. 1:2005.0013. [DOI] [PMC free article] [PubMed] [Google Scholar]
- 33.Locke, J. C. W., L. Kozma-Bognár, P. D. Gould, B. Fehér, E. Kevei, F. Nagy, M. S. Turner, A. Hall, and A. J. Millar. 2006. Experimental validation of a predicted feedback loop in the multi-oscillator clock of Arabidopsis thaliana. Mol. Syst. Biol. 2:59. [DOI] [PMC free article] [PubMed] [Google Scholar]
- 34.Zeilinger, M. N., E. M. Farré, S. R. Taylor, S. A. Kay, and F. J. Doyle 3rd. 2006. A novel computational model of the circadian clock in Arabidopsis that incorporates PRR7 and PRR9. Mol. Syst. Biol. 2:58. [DOI] [PMC free article] [PubMed] [Google Scholar]
- 35.MATLAB. The MathWorks. Natick, MA.
- 36.Varma, A., M. Morbidelli, and H. Wu. 1999. Parametric Sensitivity in Chemical Systems. Oxford University Press, New York, NY.
- 37.Gunawan, R., and F. J. Doyle 3rd. 2006. Isochron-based phase response analysis of circadian rhythms. Biophys. J. 91:2131–2141. [DOI] [PMC free article] [PubMed] [Google Scholar]
- 38.Forger, D. B., and C. S. Peskin. 2003. A detailed predictive model of the mammalian circadian clock. Proc. Natl. Acad. Sci. USA. 100:14806–14811. [DOI] [PMC free article] [PubMed] [Google Scholar]
- 39.Reference deleted in proof.
- 40.Piggins, H. D., M. C. Antle, and B. Rusak. 1995. Neuropeptides phase shift the mammalian circadian pacemaker. J. Neurosci. 15:5612–5622. [DOI] [PMC free article] [PubMed] [Google Scholar]
- 41.Gonze, D., S. Bernard, C. Waltermann, A. Kramer, and H. Herzel. 2005. Spontaneous synchronization of coupled circadian oscillators. Biophys. J. 89:120–129. [DOI] [PMC free article] [PubMed] [Google Scholar]
- 42.Bernard, S., D. Gonze, B. Cajavec, H. Herzel, and A. Kramer. 2007. Synchronization-induced rhythmicity of circadian oscillators in the suprachiasmatic nucleus. PLoS Comput. Biol. 3:e68. [DOI] [PMC free article] [PubMed] [Google Scholar]
- 43.To, T.-L., M. A. Henson, E. D. Herzog, and F. J. Doyle 3rd. 2007. A molecular model for intercellular synchronization in the mammalian circadian clock. Biophys. J. 92:3792–3803. [DOI] [PMC free article] [PubMed] [Google Scholar]
- 44.Leloup, J.-C., and A. Goldbeter. 2003. Toward a detailed computational model for the mammalian circadian clock. Proc. Natl. Acad. Sci. USA. 100:7051–7056. [DOI] [PMC free article] [PubMed] [Google Scholar]
- 45.Schwefel, H.-P. 1993. Evolution and Optimum Seeking: The Sixth Generation. John Wiley & Sons, New York, NY.
- 46.Strogatz, S. H. 2000. From Kuramoto to Crawford: exploring the onset of synchronization in populations of coupled oscillators. Physica D. 143:1–20. http://dx.doi.org/10.1016/S0167−2789(00)00094–4. [Google Scholar]
- 47.Forger, D. B., and C. S. Peskin. 2004. Model based conjectures on mammalian clock controversies. J. Theor. Biol. 230:533–539. [DOI] [PubMed] [Google Scholar]
- 48.Aton, S. J., J. E. Huettner, M. Straume, and E. D. Herzog. 2006. GABA and Gi/o differentially control circadian rhythms and synchrony in clock neurons. Proc. Natl. Acad. Sci. USA. 103:19188–19193. [DOI] [PMC free article] [PubMed] [Google Scholar]
- 49.Aton, S. J., C. S. Colwell, A. J. Harmar, J. Waschek, and E. D. Herzog. 2005. Vasoactive intestinal polypeptide mediates circadian rhythmicity and synchrony in mammalian clock neurons. Nat. Neurosci. 8:476–483. [DOI] [PMC free article] [PubMed] [Google Scholar]
- 50.Taylor, S. R., N. Bagheri, K. Meeker, L. R. Petzold, and F. J. Doyle 3rd. 2007. Robust timekeeping in circadian networks: from genes to cells. In Proceedings of the Foundations of Systems Biology in Engineering 2007. Stuttgart, Germany.