Abstract
With scanning confocal microscopy we obtained three-dimensional (3D) reconstructions of the transverse tubular system (t-system) of rabbit ventricular cells. We accomplished this by labeling the t-system with dextran linked to fluorescein or, alternatively, wheat-germ agglutinin conjugated to an Alexa fluor dye. Image processing and visualization techniques allowed us to reconstruct the t-system in three dimensions. In a myocyte lying flat on a coverslip, t-tubules typically progressed from its upper and lower surfaces. 3D reconstructions of the t-tubules also suggested that some of them progressed from the sides of the cell. The analysis of single t-tubules revealed novel morphological features. The average diameter of single t-tubules from six cells was estimated to 448 ± 172 nm (mean ± SD, number of t-tubules 348, number of cross sections 5323). From reconstructions we were able to identify constrictions occurring every 1.87 ± 1.09 μm along the principal axis of the tubule. The cross-sectional area of these constrictions was reduced to an average of 57.7 ± 27.5% (number of constrictions 170) of the adjacent local maximal areas. Principal component analysis revealed flattening of t-tubular cross sections, confirming findings that we obtained from electron micrographs. Dextran- and wheat-germ agglutinin-associated signals were correlated in the t-system and are therefore equally good markers. The 3D structure of the t-system in rabbit ventricular myocytes seems to be less complex than that found in rat. Moreover, we found that t-tubules in rabbit have approximately twice the diameter of those in rat. We speculate that the constrictions (or regions between them) are sites of dyadic clefts and therefore can provide geometric markers for colocalizing dyadic proteins. In consideration of the resolution of the imaging system, we suggest that our methods permit us to obtain spatially resolved 3D reconstructions of the t-system in rabbit cells. We also propose that our methods allow us to characterize pathological defects of the t-system, e.g., its remodeling as a result of heart failure.
INTRODUCTION
The mammalian ventricular cardiomycocyte t-system appears to have at least three functions. First, it enlarges the surface/volume ratio of the ventricular cell, increasing the exposure of the cell interior to the interstitial fluid. This facilitates the cellular exchange of ions and metabolites. Second, it carries electrical excitation rapidly into the interior of the cell to enable near-synchronous activation across the cell diameter (1,2). Finally, a recent study suggests that caveolae associated with the t-system in adult myocytes (3) constitute specific sites of macromolecular signaling complexes. These functions suggest that the preservation of the t-system architecture is central to normal cell behavior and a structural necessity for cardiac myocyte function. Consequently, greater understanding of the organization of the t-system and of any species differences in that organization is essential to improve our understanding of cardiac myocyte function (4). Moreover, remodeling of transverse tubular (t-tubular) architecture as a result of cardiac disease is particularly amenable to confocal microscopy. Structural studies have already disclosed altered t-tubular architecture in both animal (5–8) and human heart failure (9,10).
In the 1950s, Lindner first described the t-system of mammalian cardiac ventricular myocytes from electron micrographs (EMs) of thin tissue sections (11). With the current improved methods of fixation, preservation, and staining in EM sections it is apparent that the t-system is separated from the sarcoplasmic reticulum at dyadic junctions (12). Subsequent physiological and microscopic studies have shown that the sarcoplasmic reticulum membrane comes into close apposition with the t-tubule membrane at “couplons” (13) where excitation-contraction coupling takes place (14) by the well-established mechanism of calcium-induced calcium release (15). Freeze-fracture EMs produced clear images of the surface openings (ostia) of t-tubules (16) where Na/Ca exchange proteins were also colocalized (17,18). Despite the high resolution afforded by the EM, it nevertheless remains difficult to obtain three-dimensional (3D) reconstructions of the t-system and to appreciate its extent. This is because stereological reconstructions with EM sections require a very large number of sections that have to be processed. In addition, various fixation artifacts can make interpretation of results unreliable.
With scanning confocal microscopy, Frank and Garfinkel (19) were the first to obtain 3D reconstructions of t-tubules in guinea pig ventricular cells. They were also able to localize Na-Ca exchangers on the t-tubules. Soeller and Cannell (20) examined t-system organization in living rat cardiac myocytes and found that much of the t-system was below the resolution of the microscope. Using methods of digital image processing, they were able to obtain estimates of rat t-tubule diameters, which ranged from 50 to 500 nm with a mean of 255 nm in agreement with EMs. In addition, they observed very extensive longitudinal connections between the t-tubules at z-lines. Stereology on image stacks obtained with confocal microscopy has some advantages and may provide information that is complementary to that obtained with EMs. For example, although the resolution of the confocal microscope cannot match that of the electron microscope, one can often work with tissue that does not exhibit significant fixation artifacts (particularly where fixation is unnecessary). Moreover, information can be obtained relatively rapidly, and this includes 3D colocalization of structures involved in cardiac excitation-contraction (EC) coupling (19). Finally, with confocal microscopy, it is in principle possible to obtain 3D images of the relation between, for example, local Ca release events (21) before fixation and the structures that produce them after fixation in the same preparation.
Here, we report a quantitative reconstruction of the t-system in rabbit ventricular cells. These tubules appeared to be larger than those of rat ventricular myocytes. The sparsity of the t-system and the resolution of the confocal imaging system (specified by, e.g., the Rayleigh criterion) allowed us to separate t-tubules. We were therefore able to reveal and quantify novel features of the morphology of single t-tubules. It therefore follows that pathological changes in the cardiac t-system as, for example, a consequence of heart failure can now be measured with greater reliability than hitherto possible. Moreover, because the t-system in rabbit ventricular myocytes is adequately resolved by the confocal microscope, any remodeling of the system may be easier to describe and quantify in this species. A preliminary report of some of this work has already been published (22).
METHODS
Myocyte isolation
Ventricular myocytes were isolated from adult rabbit hearts as previously described (23). The hearts were perfused using the Langendorff technique with a recirculating enzyme solution containing collagenase (1 mg/ml) and protease (0.1 mg/ml). After isolation and until imaging, myocytes were stored at room temperature in a modified Tyrode's solution containing 0.1 mM CaCl2 and 12.5 mM KCl.
Confocal imaging
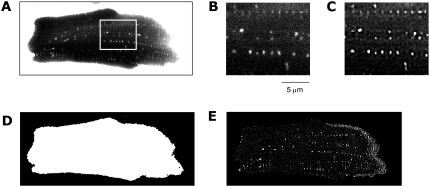
Myocytes were superfused with membrane-impermeant dextran (molecular weight 3,000–10,000) conjugated to fluorescein (excitation wavelength 488 nm, emission wavelength: 524 nm) and imaged with a BioRad MRC-1024 laser-scanning confocal microscope (Bio-Rad Laboratories, Hercules, CA) and a 60× oil immersion objective lens with a numerical aperture of 1.4 (Nikon, Tokyo, Japan) (Fig. 1, A and B). In some experiments, myocytes were exposed to both dextran-linked fluorescein and wheat-germ agglutinin (WGA) conjugated to an Alexa fluor (excitation wavelength 555 nm, emission wavelength 565 nm) and imaged with a Zeiss LSM 510 confocal microscope (Carl Zeiss, Jena, Germany) with a 63× oil immersion objective lens with a numerical aperture of 1.4 (Fig. 2, A and B). A bandpass filter for wavelengths between 505 and 530 nm and a long-pass filter for a wavelength of 560 nm were used to reduce cross talk between the Alexa fluors during imaging of the dextran and WGA signals, respectively. We used the multitrack scanning mode of the Zeiss LSM 510 to obtain virtually simultaneous images of the dual-labeled myocytes. The imaging led to 3D image stacks of fluorescein and fluorescein/Alexa fluor labeling with a spatial resolution of 133 × 133 × 133 nm and 100 × 100 × 100 nm, respectively. The image stacks covered whole cells or large segments of them. The data volume of the stacks ranged from 20 to 250 million voxels.
FIGURE 1.
Image data and processing. (A) An image of a left ventricular myocyte was obtained by applying confocal microscopy and dextran-fluorescein as a marker of the extracellular space. The image consists of 896 × 356 pixels and is part of a stack of 130 images. Enlargement of the region marked in A shows cross sections of t-tubules (B) before and (C) after deconvolution. Image segmentation and correlation led to (D) a mask image and (E) highlighting of tubular structures, respectively.
FIGURE 2.
Image data and deconvolution. (A) Confocal microscopy of cell with WGA conjugated to an Alexa fluor as a marker of glycocalix polysaccharides shows signal intensities associated with the sarcolemma. Enlargement of the region marked in A displays cross sections of t-tubules (B) before and (C) after deconvolution.
Image deconvolution and processing
All image stacks were deconvolved and processed similarly as previously described (24) (Figs. 1 C and 2 C). In summary, the iterative Richardson-Lucy algorithm was applied with point spread functions (PSFs) extracted from images of fluorescent beads 100 nm in diameter (Molecular Probes, Eugene, OR; excitation wavelength 505 nm, emission wavelength 515 nm) residing in the first 10 μm above the coverslip (Supplementary Material Figs. S1 and S2, Data S1). Ten images of isolated beads were averaged, yielding the PSF. Mask images confining the myocytes and their t-system were generated from the dextran-fluorescein images by region-growing techniques and morphological operators (25). Further image processing and visualization were restricted to the regions within the mask image (Fig. 1 E).
T-system reconstruction
The t-system was reconstructed with 3D visualization methods. Isosurface triangular meshes were generated with a modified marching cube algorithm (26). The meshes were visualized using custom software based on OpenGL (27) and Open Inventor (28).
Single t-tubule analysis
T-tubules were segmented in the deconvolved image stack with the region-growing technique (25). The stacks were subdivided into cubes with a volume of ∼1 μm3. Points of maximal intensity were detected in the cubes and used as seed points for region-growing (Fig. 1 E). Region-growing was performed in a six-neighborhood and with a global threshold value, which was determined by inspection of intensity distributions of exemplary t-tubule images. Only t-tubules in the first 10 μm above the coverslip having a length >1 μm and without branching were selected for further analysis. For each t-tubule segment, a center line was fit using a least-squares method, and orthogonal cross sections were extracted. Cross-sectional intensities of the t-tubule segment were projected onto the line. Average intensities in the region adjacent to the t-tubule segment were used for background removal. The analysis of the intensity profiles revealed t-tubule length, number of intensity minima, and distance between minima. For each t-tubule cross section, a principal component analysis gave eigenvectors e1 and e2 associated with eigenvalues λ1 and λ2 (25). The eigenvalues were applied to describe the flattening of a cross section by calculating the square root of the eigenvalue ratio E:
 |
The ratio E has values between 0 and 1; the eigenvalue ratio for a circle is 1, and lower values indicate increasing flattening. The measure is similar to the ratio of minor to major axis length of ellipses used to characterize their shape. The minor eigenvector e2 was applied to describe the orientation Δ of the cross section with respect to the myocyte long axis m1 defined as parallel to the x axis:
 |
The orientation Δ has values between −90° and 90° with an orientation 0° indicating that the minor eigenvector e2 is parallel to the myocyte long axis m1.
Colocalization
Two measures of correlation were used to quantify colocalization in the images from dextran-fluorescein S1 and WGA-Alexa fluor S2: Pearson's correlation coefficient Rr and Manders' overlap coefficient R (29):
 |
 |
The measures were applied after background removal and noise reduction with a linear averaging filter. For each voxel, an averaged value was determined by the mean value of this voxel and its six direct neighbors.
EM imaging
Isolated rabbit myocytes were allowed to settle by gravity into small conical tubes. The fluid was gently removed, and the tubes were refilled with 2% glutaraldehyde, rinsed, and then postfixed with 2% osmium tetroxide. The myocytes were dehydrated with graded alcohols and embedded in Epon. Ultrathin (silver colored) sections were stained with uranyl acetate and lead citrate and imaged in a JEOL 100CX (JEOL, Tokyo, Japan). The freeze-fracture EM was produced by quick freezing of unfixed rabbit papillary muscle. The muscle was dissected in low-Ca oxygenated Ringer's solution and within 10 s of removal from the heart placed on a moisten filter paper attached to the specimen holder. The muscle was frozen by bringing it into rapid and firm contact with a highly polished surface of a pure copper block cooled to a temperature of −196°C with liquid nitrogen. Care was taken to cushion the specimen from impact with gelatin pads and to limit the flattening with the appropriate plastic rings between the tissue and the copper block. In addition, deep etching of some of the quick frozen specimens was performed as previously described (30–32).
Coordinate system
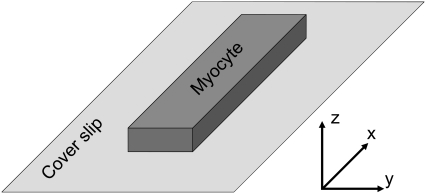
To make our results clearer, we defined a coordinate system for the cell geometry (Fig. 3). The cell may be regarded as a solid cuboid with a length of ∼120 μm, a width of ∼25 μm, and a height of ∼15 μm. In Fig. 3, the cell is depicted lying flat on the coverslip. In the description that follows the x axis is referred to the long axis of the cell. The transverse horizontal direction is aligned with the y axis. The vertical direction, which is perpendicular to the coverslip surface and also parallel to the laser beam direction, is referred to as the z axis.
FIGURE 3.
Coordinate system of image stacks. The myocyte's long axis is parallel to the x axis, and the laser beam with the z axis.
RESULTS
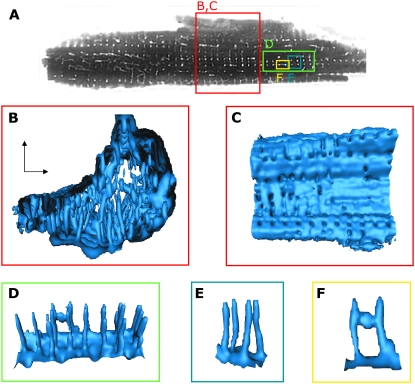
To identify the t-system, we took confocal xy image stacks of quiescent rabbit ventricular myocytes immersed in a solution containing fluorescein conjugated to dextran. The dextran-linked fluorescein rapidly penetrated the t-system and revealed tubular structures throughout the cell (Fig. 4 A). This single xy image was taken from a stack of 148 images. We show four regions of interest on it (delineated by the colored boxes) for examination in three dimensions. In the region enclosed by the red box (Fig. 4 B), the arrangement of tubules is apparent, and tubules penetrate the cell interior from its surface. Generally, these surfaces are roughly parallel and orthogonal to the coverslip (xy and xz planes), although this cell is clearly a distortion of an idealized solid rectangle. The arrangement of t-tubules is clearer when we examine Fig. 4, D and E. Many of the t-tubules are regularly arranged in the long axis of the cell. However, a number of t-tubules appear to progress from the sides of the cell (xz plane in Fig. 4 A), although the nature of the PSF ensures that these will be distorted and difficult to discern in Fig. 4 B. Inspection of the cell surface (delineated by an isosurface rendering of fluorescent intensity, Fig. 4 C) shows that tubules are generally arranged in rows and columns (see Fig. 4 D), consistent with the foregoing observations. The ostia (surface openings) of the t-tubules occur where “grooves” in the cell surface are apparent and suggest that the tubules develop where the outer cell surface is able to penetrate the cell more deeply. The arrangement of ostia is also consistent with a row by column arrangement of t-tubules. In some cases, the tubule extended from a wide invagination of the cell surface (Fig. 4, D and F) that formed cisterns. However, there are also regions on the surface that contain no t-tubule ostia. In the region displayed in Fig. 4 D, t-tubules were approximately perpendicular (orthogonal) to the cell surface. Although many t-tubules showed an ordered structure, they varied significantly in length, diameter, and topology. In thicker parts of the cell, t-tubules were truncated so that they did not pass through the entire thickness of the cell. In some regions, we saw connections between adjacent tubules, which run in both longitudinal and transverse cell axes. The connection in Fig. 4, D and F, is running in the longitudinal axis. These connections were of limited extent, generally not extending for more than one sarcomere length. We refer to them as t-tubule anastamoses. Thus, although a single confocal section appears similar to that seen in rat (20), the overall 3D structure is less complex, and the limited number of anastamoses shows that the rabbit t-system is quite unlike the “z-rete” described for rat (19).
FIGURE 4.
Visualization of t-system in myocyte based on dextran-fluorescein straining. (A) Cross-sectional image indicates invaginations of the sarcolemma. (B) 3D visualization of cell interior reveals that t-tubules penetrate mostly from bottom and top of the cell. (C) A view from the exterior on the sarcolema indicates that t-tubule ostia are partly regularly organized, but in some regions ostia are missing. (D and E) In part, regions with regularly spaced t-tubules of simple topology are exhibited. (F) An anastomosis forming a longitudinal connection between two t-tubules is shown.
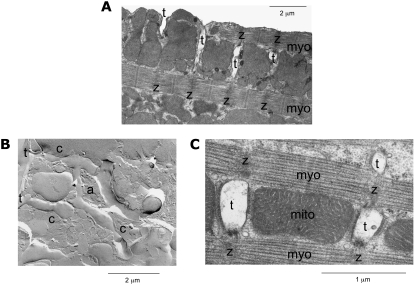
EMs are consistent with the t-tubular structure that we have already described (Fig. 5). In this example, t-tubules enter the cell in the transverse axis as invaginations of the sarcolemma at the level of z-lines and run approximately orthogonal to the outer cell surface (Fig. 5 A). The freeze fracture (Fig. 5 B) confirmed that the entrance of the tubule is continuous with the cell surface. In addition, we see anastamoses (Fig. 5 B) between two adjacent tubules. This is consistent with those observed in our confocal images (Fig. 4 F). The tubules also appeared to have variations in width, although this interpretation is complicated because of possible variations in fracture depth. Fig. 5 C shows that the cross section of the t-tubules was not circular but somewhat flattened. We will deal with this issue shortly.
FIGURE 5.
Electron micrographs of rabbit ventricular myocytes. (A) The cross-sectional image shows t-tubules (t) and their relation to z-disks (z) and myofilaments (myo). The image indicates that t-tubules invaginate the outer sarcolemma and are closely associated to z-disks. (B) The freeze fracture shows two t-tubules (t) connected by an anastomosis (a). Furthermore, the freeze fracture gives indications for constrictions (c) of the t-tubules. (C) A cross-sectional cut through three t-tubules is displayed in relation to z-disks, myofilaments, and mitochondria (mito). The cut through t-tubules indicates noncircular cross sections.
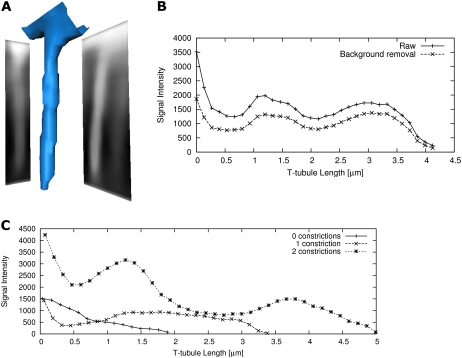
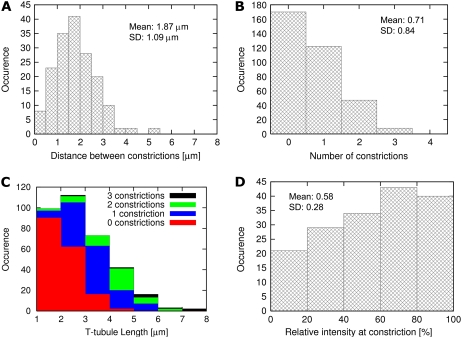
We investigated the morphological characteristics of single t-tubules by analyzing central projections of fluorescent intensity. In projections onto xz and yz planes, it was already obvious that the dextran-linked fluorescein intensity was not uniform along the length of the t-tubule (Fig. 6 A). There were periodic reductions in signal intensity, which remained after removal of the fluorescent intensity of the background (Fig. 6 B), so that the intensity decreased significantly in comparison with the adjacent maximum (Fig. 6 C). Such reductions in intensity must correspond to a local reduction in t-tubule volume and, consequently, their mean diameter. As pointed out by Soeller and Cannell (20), it is possible to measure mean tubule diameter from fluorescein intensity provided one assumes a circular t-tubular cross section. Here, we used a thresholding approach to calculate mean cross-sectional area. Assuming circular cross sections, we estimated a mean diameter of 448 ± 172 nm from 5323 cross sections in six cells. This diameter was consistent with our impression that rabbit t-tubules were considerably larger than those in rat myocytes, where the mean tubule diameter was calculated to be 255 nm (and therefore generally below the resolution of the light microscope) by a similar method. The number of constrictions depended on the length of t-tubules, and from analysis of 348 t-tubules the distance between constrictions was 1.87 ± 1.09 μm (Fig. 7 A). The histogram in Fig. 7 B shows that more than half of the t-tubules have at least one constriction along their length, and we found no t-tubules with more than four constrictions. Further analysis (Fig. 7 C) showed that longer t-tubules exhibited more constrictions, whereas short t-tubules (1–2 μm in length) contained only a small number of detectable constrictions. The extent of the constriction was also highly variable (Fig. 7 D) with the average constriction resulting in a decrease in signal intensity to 57.7 ± 27.5% calculated from a set of 170 constrictions.
FIGURE 6.
Visualization and analysis of single t-tubules. (A) A t-tubule and projected dextran-fluorescein signal on xy and xz planes are visualized in 3D. (B) Profiles of raw and background-subtracted cross-sectional integrated signals are shown along the t-tubule. The analysis exhibits two constrictions with reduced signal intensity at 0.5 and 2 μm. (C) The plot displays exemplary background-subtracted profiles with zero, one, and two constrictions.
FIGURE 7.
Statistical analysis of constrictions in t-tubules (number of cells 6, number of t-tubules: 348, number of constrictions: 170).
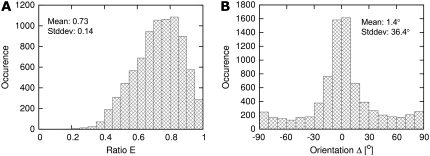
Because rabbit t-tubules were considerably larger than those of rat, we are able to characterize geometric features of the cross section. Because the EMs in Fig. 5 suggest that t-tubules are not circular in cross section, we used principal component analysis (see Methods) to measure the deviation of the t-tubule geometry from that of a simple circular tube. Fig. 8 shows histograms that describe the shape and orientation of t-tubule cross sections in terms of their eigenvectors and eigenvalues. The eigenvalue ratio E of 0.73 ± 0.14 is consistent with a moderate degree of flattening (Fig. 8 A). There was a considerable variation in the degree of flattening of t-tubules with very few displaying a circular cross section (E = 1) and also a small number that were so flattened that they had an almost ribbon-like structure (E = 0). Fig. 8 B shows that, in most cases, the minor axis of the t-tubule (associated with the smaller eigenvalue) was aligned within a few degrees to the long axis of the cell. This is also suggested by the EM in Fig. 5 C.
FIGURE 8.
Statistical analysis of (A) cross-sectional flattening and (B) orientation (number of cells: 6, number of cross sections: 5323).
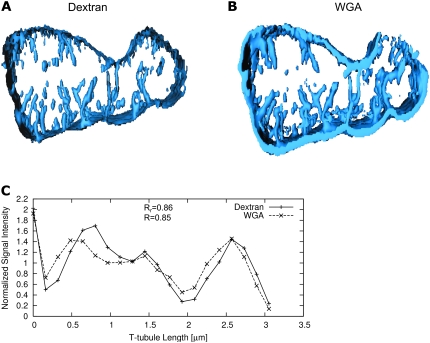
Although the dextran-linked fluorescein intensity reports local volume accessible to the dye, it is possible that the presence of the glycocalyx might reduce the local free volume within the t-tubule. This would greatly complicate the interpretation of such soluble dye signals in terms of constrictions in t-tubule diameter (even though the free volume would still be correct). To examine this possibility, we simultaneously labeled t-tubules with WGA, which binds to sialic acid residues in the glycocalyx (33). Fig. 9 shows cell cross sections labeled with dextran-linked fluorescein (Fig. 9 A) and WGA (Fig. 9 B), and, as expected, there is good agreement between the borders of dextran-linked fluorescein-labeled compartments and the WGA signal. More important, examination of local signal intensity along t-tubules showed that the local constriction in local volume reported by the dextran-linked fluorescein was mirrored by a similar drop in WGA labeling intensity (Fig. 9 C). In a compartment including the myocyte and its t-system, the two labels showed a high degree of colocalization (Table 1). From these data we suggest that it is correct to interpret the local drop in labeling intensity in terms of a constriction in t-tubule diameter with a consequent reduction in local t-tubule volume.
FIGURE 9.
Visualization of t-system based on (A) dextran-fluorescein and (B) WGA conjugated to an Alexa Fluor. (C) The intensity profiles show that reductions of the dextran-associated signal correlate with reduction in the WGA signal.
TABLE 1.
Correlation of dextran and WGA signals
| Pearson's correlation coefficient Rr | Manders' overlap coefficient R | |
|---|---|---|
| Image | 0.08 ± 0.05 | 0.43 ± 0.06 |
| Myocyte and t-system | 0.57 ± 0.07 | 0.66 ± 0.05 |
| Extracellular space | -0.07 ± 0.14 | 0.52 ± 0.07 |
For all data, n = 7.
DISCUSSION
We have quantified t-tubule topology and morphology in rabbit ventricular myocytes from 3D reconstructions of confocal microscopic image stacks. This work shows that the architecture of the t-system in rat and rabbit is quite different. The t-system in rats displays an extensive and complex “rete-like” structure (19). Although this complexity may have a significant bearing on EC coupling in rat, our results suggest that this t-tubular “rete” is not characteristic of all species. Not only were rabbit t-tubules less abundant and arranged more simply, they were also considerably larger in cross section. The increased cross-sectional diameter allowed us to carry out the first measure of flattening of t-tubules, which will be important for computer modeling because this requires an understanding of the geometry of individual t-tubules. The surface/volume ratio increases with flattening and is greater than the surface/volume ratio of a t-tubule with circular cross sections. In addition, we were able to observe frequent constrictions (Fig. 7) in t-tubule diameter along their length. These may be similar to the apparently random local increases and decreases in t-tubular diameter for rat myocytes (20). It is not clear what function the constrictions (or the bulges that must occur between them) serve. We speculate that either the bulges or constrictions are the sites of dyadic junctions. If this is the case, they would prove to be valuable geometric markers for colocalization studies.
Limitations
Several limitations of confocal imaging systems constrain our conclusions. The first of these is spatial resolution, which can be specified by, e.g., the Rayleigh criterion and estimated from measured PSFs (34). PSFs from confocal imaging systems typically display directional anisotropy with transversal isotropy. The full width at half-maximum is 2–3 times larger in the direction of the laser beam than orthogonal to it (20,34). This anisotropy exacerbates distortion of t-tubule images parallel to the laser beam direction, which is obvious in Fig. 4 B and in particular the reconstruction of an anastomosis in Fig. 4 F. These distortions can cause overestimation of t-tubule length and diameter. Furthermore, these distortions can cause underestimation of reduction of cross-sectional area in the reported constrictions. Our measurement of the PSF of the Zeiss LSM 510 confocal microscope suggests that we can separate points having a distance of 0.28 and 0.83 μm in xy and z direction, respectively. In a complex rete-like structure as found in rats, separation of t-tubules is more difficult than in rabbit myocytes with a sparse t-system.
In this work, detection of t-tubule edges was applied for measurement of t-tubule diameters. We used the region-growing method with a global threshold for edge detection. Our analysis was restricted to t-tubules in the first 10 μm above the coverslip to reduce depth-dependent attenuation and its effects on the threshold value. Our somewhat arbitrary approach for threshold selection (see Methods) was based on the observation that the sensitivity of the threshold parameter to edge detection and diameter estimation was small for our selection of t-tubules. Small variations of the threshold led to similar cross sections. Theoretically, the PSFs make it possible to characterize blurring of t-tubule edges and thus would permit development of methods for objective edge detection. However, application of these methods would necessitate making assumptions regarding t-tubule shape and fluor distributions, which are at the moment difficult to justify. We cannot exclude the possibility that our region-growing method has removed very small t-tubules. However, inspection of our EM data on rabbit ventricular cells suggests that this is not the case.
Our estimate of t-tubule diameters was based on the measurement of cross-sectional areas and the assumption that these cross sections were circular. Also, the calculation of standard deviations of t-tubule diameters was based on this assumption. Our data on t-tubule flattening showed that this assumption is a simplification. This simplification is convenient for comparison of t-tubule diameter with those from other species. The assumption was also applied by Soeller and Cannell (20) for estimating t-tubule diameters in rat. More accurate measures could be derived from the described principal component analysis of t-tubule flattening. However, these measures would complicate a comparison with previously published data.
Distribution and morphology of t-tubules
In rabbit ventricular myocytes lying flat on a coverslip (the bottom of the cell is in contact with the coverslip), t-tubules generally run from the top and bottom of the cell toward its center and, in places where the cell is thin, may completely cross the cell. T-tubule length appears to be quite variable (Fig. 4 B). Although the length of some tubules may be limited by nuclei, this was not the case for most of the t-tubules we measured. When we compare our data to those from rat, it is clear that the rabbit myocyte is less well served by the t-system whose t-tubules are about twice the diameter of those in rat. When rabbit and rat myocytes were rapidly exposed to a zero Ca solution, the decline in triggered Ca transients was ∼5 times slower in rats (35). This is consistent with a more complex and narrow t-tubular system in rats. 3D reconstruction of the t-system in rats shows far more anastomoses forming “rete-like” structures. Thus, although the rabbit and rat are similar in so far as the majority of t-tubules are found at the z-line, the rat has more longitudinal elements as well as “t-tubules that run in all directions” (19). From the complexity of the t-tubular system in rats, Soeller and Cannell (20) went so far as to suggest that a “sarcolemmal z rete” might provide a more descriptive term for the nature of the t-tubular system. From our data, such a description would not be suitable for the t-system in rabbit ventricular myocytes.
We were able to detect local variations in t-tubule diameter and showed that principal component analysis of the fluorescence signal is consistent with t-tubules that are flattened. The fact that WGA labeling reported similar changes in t-tubule morphology strengthens this finding. Without other information, local changes in the extent of the obstruction of the t-system lumen by glycocalyx could not be simply interpreted in terms of local volume changes. Nevertheless, the agreement between the dextran- and WGA-linked dye signal was not perfect, which suggests that local variations in the amount of glycocalyx still are present. The cause of such variations and even the role of the glycocalyx in the t-tubule are unknown.
Contributions of constrictions and flattening to t-system function
Because the t-tubules are often located next to mitochondria (e.g., Fig. 5, A and C) and dyads, we can speculate that the local variation in t-tubule diameter may contribute to the supply of nutrients and calcium signaling. This is consistent with one of the proposed functions of the t-system that we mentioned in the Introduction. The flattening of t-tubules that we have detected by principal component analysis may be related to the cells being at a slack length. If this is the case, it suggests that when cells shorten or lengthen a local volume change within the t-system should take place. If this proves correct, then our data suggest that during myocyte contraction and relaxation, extracellular fluid may actually move by a pumping action in and out of the t-system to accelerate and augment diffusional transport. If the L-type calcium current is to cause any local depletion within the t-system, then the pumping action would seem to make sense. With a simple calculation based on the approximation of cylindrical t-tubules and a homogeneous distribution of calcium channels, we can directly address this point. If the tubule diameter is 400 nm, and a peak L-type calcium current density is 10 pA/pF, then the local Ca flux is equivalent to 0.005 mM/ms for a specific membrane capacitance of 1 μF/cm2. For a calcium current lasting for 5 ms, this represents a negligible depletion and is easily controlled by diffusion. Thus, depletion of calcium per se is not an issue. However, this calculation does not account for localized distributions of calcium channels and the distribution of constrictions. We suggest that modeling studies based on detailed t-tubule geometry and calcium channel distribution will be required to address this point with greater reliability.
Implications for colocalization studies
Our studies showing a similar distribution of dextran-linked fluorescence and WGA suggest additional opportunities for colocalization studies. We showed that the distribution of WGA and dextran intensities are similar in the t-system. Moreover, both markers detect constrictions in the same locations (Fig. 9 C). Our finding that dextran and WGA colocalize may prove extremely valuable in future dual-labeling experiments. Because WGA can be used to label fixed cells, the WGA label may now be used as a reliable marker of t-tubules and their local geometry while simultaneously labeling other proteins that are associated with t-tubules and are essential for EC coupling. The 3D reconstruction of t-tubules may ultimately prove to be essential to understand the geometry of t-tubular remodeling in cells from hearts exhibiting, among other pathologies, congestive heart failure (7).
SUPPLEMENTARY MATERIAL
To view all of the supplemental files associated with this article, visit www.biophysj.org.
Acknowledgments
The work was supported by the Richard A. and Nora Eccles Harrison endowment, awards from the Nora Eccles Treadwell Foundation, and National Institutes of Health research grants HL62690 and HL70828.
Editor: Michael D. Stern.
References
- 1.Cheng, H., M. B. Cannell, and W. J. Lederer. 1994. Propagation of excitation-contraction coupling into ventricular myocytes. Pflugers Arch. 428:415–417. [DOI] [PubMed] [Google Scholar]
- 2.Nelson, D. A., and E. S. Benson. 1963. On the structural continuities of the transverse tubular system of rabbit and human myocardial cells. J. Cell Biol. 16:297–313. [DOI] [PMC free article] [PubMed] [Google Scholar]
- 3.Balijepalli, R. C., J. D. Foell, D. D. Hall, J. W. Hell, and T. J. Kamp. 2006. Localization of cardiac L-type Ca(2+) channels to a caveolar macromolecular signaling complex is required for beta(2)-adrenergic regulation. Proc. Natl. Acad. Sci. USA. 103:7500–7505. [DOI] [PMC free article] [PubMed] [Google Scholar]
- 4.Brette, F., and C. Orchard. 2007. Resurgence of cardiac t-tubule research. Physiology (Bethesda). 22:167–173. [DOI] [PubMed] [Google Scholar]
- 5.Page, E., and L. P. McCallister. 1973. Quantitative electron microscopic description of heart muscle cells. Application to normal, hypertrophied and thyroxin-stimulated hearts. Am. J. Cardiol. 31:172–181. [DOI] [PubMed] [Google Scholar]
- 6.He, J., M. W. Conklin, J. D. Foell, M. R. Wolff, R. A. Haworth, R. Coronado, and T. J. Kamp. 2001. Reduction in density of transverse tubules and L-type Ca(2+) channels in canine tachycardia-induced heart failure. Cardiovasc. Res. 49:298–307. [DOI] [PubMed] [Google Scholar]
- 7.Louch, W. E., H. K. Mork, J. Sexton, T. A. Stromme, P. Laake, I. Sjaastad, and O. M. Sejersted. 2006. T-tubule disorganization and reduced synchrony of Ca2+ release in murine cardiomyocytes following myocardial infarction. J. Physiol. 574:519–533. [DOI] [PMC free article] [PubMed] [Google Scholar]
- 8.Song, L. S., E. A. Sobie, S. McCulle, W. J. Lederer, C. W. Balke, and H. Cheng. 2006. Orphaned ryanodine receptors in the failing heart. Proc. Natl. Acad. Sci. USA. 103:4305–4310. [DOI] [PMC free article] [PubMed] [Google Scholar]
- 9.Wong, C., C. Soeller, L. Burton, and M. B. Cannell. 2001. Changes in transverse-tubular system architecture in myocytes from diseased human ventricles. Biophys. J. 2001:588c. (Abstr.) [Google Scholar]
- 10.Kaprielian, R. R., S. Stevenson, S. M. Rothery, M. J. Cullen, and N. J. Severs. 2000. Distinct patterns of dystrophin organization in myocyte sarcolemma and transverse tubules of normal and diseased human myocardium. Circulation. 101:2586–2594. [DOI] [PubMed] [Google Scholar]
- 11.Lindner, E. 1957. Submicroscopic morphology of the cardiac muscle. Z. Zellforsch. Mikrosk. Anat. 45:702–746. [PubMed] [Google Scholar]
- 12.Fawcett, D. W., and N. S. McNutt. 1969. The ultrastructure of the cat myocardium. I. Ventricular papillary muscle. J. Cell Biol. 42:1–45. [DOI] [PMC free article] [PubMed] [Google Scholar]
- 13.Stern, M. D., G. Pizarro, and E. Rios. 1997. Local control model of excitation-contraction coupling in skeletal muscle. J. Gen. Physiol. 110:415–440. [DOI] [PMC free article] [PubMed] [Google Scholar]
- 14.Franzini-Armstrong, C., F. Protasi, and V. Ramesh. 1999. Shape, size, and distribution of Ca(2+) release units and couplons in skeletal and cardiac muscles. Biophys. J. 77:1528–1539. [DOI] [PMC free article] [PubMed] [Google Scholar]
- 15.Fabiato, A. 1985. Mechanism of Ca2+-induced release of Ca2+ from the sarcoplasmic reticulum of a skinned cardiac cell from the rat ventricle. J. Physiol. 358:58P. (Abstr.) [Google Scholar]
- 16.Severs, N. J. 2000. The cardiac muscle cell. Bioessays. 22:188–199. [DOI] [PubMed] [Google Scholar]
- 17.Frank, J. S., G. Mottino, D. Reid, R. S. Molday, and K. D. Philipson. 1992. Distribution of the Na+-Ca2+ exchange protein in mammalian cardiac myocytes: An immunofluorescence and immunocolloidal gold-labeling study. J. Cell Biol. 117:337–345. [DOI] [PMC free article] [PubMed] [Google Scholar]
- 18.Kieval, R. S., R. J. Bloch, G. E. Lindenmayer, A. Ambesi, and W. J. Lederer. 1992. Immunofluorescence localization of the Na-Ca exchanger in heart cells. Am. J. Physiol. Cell Physiol. 263:C545–C550. [DOI] [PubMed] [Google Scholar]
- 19.Frank, J. S., and A. Garfinkel. 1997. Immunolocalization and structural configuration of membrane and cytoskeletal proteins involved in excitation-contraction coupling of cardiac muscle. In The Myocardium. G. A. Langer, editor. Academic Press, San Diego, CA.
- 20.Soeller, C., and M. B. Cannell. 1999. Examination of the transverse tubular system in living cardiac rat myocytes by 2-photon microscopy and digital image-processing techniques. Circ. Res. 84:266–275. [DOI] [PubMed] [Google Scholar]
- 21.Cheng, H., W. J. Lederer, and M. B. Cannell. 1993. Calcium sparks: elementary events underlying excitation-contraction coupling in heart muscle. Science. 262:740–744. [DOI] [PubMed] [Google Scholar]
- 22.Savio-Galimberti, E., J. Frank, M. Inoue, J. I. Goldhaber, M. B. Cannell, J. H. B. Bridge, and F. B. Sachse. 2007. High-resolution three-dimensional confocal microscopy reveals novel structures in rabbit ventricular myocyte t-tubules. Biophys. J. 2007:136a. (Abstr.) [Google Scholar]
- 23.Cordeiro, J. M., K. W. Spitzer, W. R. Giles, P. R. Ershler, M. B. Cannell, and J. H. Bridge. 2001. Location of the initiation site of calcium transients and sparks in rabbit heart Purkinje cells. J. Physiol. 531:301–314. [DOI] [PMC free article] [PubMed] [Google Scholar]
- 24.Savio, E., J. I. Goldhaber, J. H. B. Bridge, and F. B. Sachse. 2007. A framework for analyzing confocal images of transversal tubules in cardiomyocytes. In Lecture Notes in Computer Science. F. B. Sachse and G. Seemann, editors. Springer, Berlin. 110–119.
- 25.Gonzalez, R. C., and R. E. Woods. 1992. Digital Image Processing. Addison-Wesley, Reading, MA.
- 26.Heiden, W., T. Goetze, and J. Brickmann. 1991. ‘Marching-Cube’-algorithms for fast generation of iso-surfaces based on three-dimensional data fields. In Visualization of Volumendaten. Springer, Berlin. 112–117.
- 27.Shreiner, D., M. Woo, J. Neider, and T. Davis. 2003. OpenGL Programming Guide: The Official Guide to Learning OpenGL. Addison-Wesley, Reading, MA.
- 28.Wernecke, J. 1994. The Inventor Mentor: Programming Object-Oriented 3D Graphics with Open Inventor. Addison-Wesley, Reading, MA.
- 29.Manders, E. M., J. Stap, G. J. Brakenhoff, R. van Driel, and J. A. Aten. 1992. Dynamics of three-dimensional replication patterns during the S-phase, analysed by double labelling of DNA and confocal microscopy. J. Cell Sci. 103:857–862. [DOI] [PubMed] [Google Scholar]
- 30.Heuser, J. 1981. Preparing biological samples for stereomicroscopy by the quick-freeze, deep-etch, rotary-replication technique. Methods Cell Biol. 22:97–122. [DOI] [PubMed] [Google Scholar]
- 31.Frank, J. S., G. Mottino, and P. Nievelstein-Post. 1995. Early events in atherosclerosis captured by quick freeze/deep etch. In Rapid Freezing, Freeze-Fracture and Deep Etching. N. J. Severs and D. M. Shotton, editors. John Wiley & Sons, Hoboken, NJ. 335–343.
- 32.Heuser, J. E., T. S. Reese, M. J. Dennis, Y. Jan, L. Jan, and L. Evans. 1979. Synaptic vesicle exocytosis captured by quick freezing and correlated with quantal transmitter release. J. Cell Biol. 81:275–300. [DOI] [PMC free article] [PubMed] [Google Scholar]
- 33.Bhavanandan, V. P., and A. W. Katlic. 1979. The interaction of wheat germ agglutinin with sialoglycoproteins. The role of sialic acid. J. Biol. Chem. 254:4000–4008. [PubMed] [Google Scholar]
- 34.Bolte, S., and F. P. Cordelieres. 2006. A guided tour into subcellular colocalization analysis in light microscopy. J. Microsc. 224:213–232. [DOI] [PubMed] [Google Scholar]
- 35.Yao, A., K. W. Spitzer, N. Ito, M. Zaniboni, B. H. Lorell, and W. H. Barry. 1997. The restriction of diffusion of cations at the external surface of cardiac myocytes varies between species. Cell Calcium. 22:431–438. [DOI] [PubMed] [Google Scholar]


