Abstract
Tumor necrosis factor-related apoptosis-inducing ligand (TRAIL) has been shown to induce apoptosis through caspase activation in a number of cancer cell lines while displaying minimal or no toxicity on normal cells, suggesting that this protein may hold potential for development as a new cancer therapeutic agent. Moreover, TRAIL can activate mitogen-activated protein kinases (MAPKs) in addition to caspases. However, it has not been clearly understood how MAPKs are activated by TRAIL and the biological significance of their activation.
Here we show that TRAIL-induced MAPKs activation is dependent on caspase activation and that mammalian sterile 20-like kinase 1 (Mst1) functions as a mediator between caspase activation and MAPKs activation. Activation of MAPKs (JNK, p38, ERK) is differentially regulated by cleavage size (40 kDa and 36 kDa) of Mst1, which is controlled by caspase-7 and -3.
Keywords: Mst1, TRAIL, caspase, MAPK
1. Introduction
Tumor necrosis factor-related apoptosis-inducing ligand (TRAIL) consists of 281 and 291 amino acids in the human and murine forms, respectively. TRAIL is expressed as a type II integral membrane protein belonging to the tumor necrosis factor (TNF) superfamily (4-1BBL, APRIL, BAFF, CD27L, CD30L, CD40L, EDA1, EDA2, FasL, GITRL, LIGHT, lymphotoxin α, lymphotoxin αβ, OX40L, RANKL, TL1A, TNF, TWEAK, and TRAIL). TRAIL is related most closely to a Fas/APO-1 ligand among TNF superfamily members. Like Fas ligand (FasL) and TNF, the C-terminal extracellular region of TRAIL (amino acids 114–281) exhibits a homotrimeric subunit structure [1]. The apoptotic signal of TRAIL is transduced by binding to the death receptors TRAIL-R1 (DR4) and TRAIL-R2 (DR5), which are members of the TNF receptor superfamily. Both DR4 and DR5 contain a cytoplasmic death domain that is required for TRAIL receptor-induced apoptosis. TRAIL also binds to TRAIL-R3 (DcR1) and TRAIL-R4 (DcR2), which act as decoy receptors by inhibiting TRAIL signaling [2–8]. Unlike DR4 and DR5, DcR1 does not have a cytoplasmic domain and DcR2 retains a cytoplasmic fragment containing a truncated form of the consensus death domain motif [6]. Previous studies suggest that DRs and DcRs interact through their extracellular domains to form homometric and/or heterometric complexes [9]. TRAIL binding to death receptors is thought to result in conformational changes that expose a binding surface for Fas-associated death domain (FADD), an adaptor protein [10, 11]. TRAIL triggers apoptosis by recruiting the apoptosis initiator procaspase-8 through the adaptor FADD [12]. Caspase-8 can directly activate downstream effector caspases including procaspase-3, -6, and -7 [13]. Caspase-8 also cleaves Bidx and triggers mitochondrial damage that in turn leads to cytochrome c release [14]. Cytochrome c in the cytoplasm binds to Apaf-1, which then permits recruitment of procaspase-9. Caspase-9 cleaves and activates procaspase-3 [15]. Thus, TRAIL induces apoptosis through caspase activation [16].
Mitogen-activated protein kinases (MAPKs) belong to a family of proteins which consists of three family members: c-Jun NH2-terminal kinase (JNK), p38-MAPK, and extracellular signal-regulated kinase (ERK). Previous studies have shown that caspase-8 is regarded to be important not only for induction of apoptosis but also for activation of the MAPK signaling pathway during treatment with TRAIL [17]. However, the molecular mechanism of how TRAIL induces MAPK activation through caspase-8 has not been completely understood. Previous reports reveal that a high degree of cross talk between proteolysis and kinase activation occurs during treatment with TRAIL [18]. It has been suggested that caspase activation induced by TRAIL most likely contributes to activation of protein kinases. Protein kinases have emerged as direct substrates and effectors of caspases. Among them, caspase cleavage engenders the production of a more active kinase by removal of the inhibitory domains [10]. In response to apoptotic stimuli, the cleaved, caspase-activated kinases then serve to propagate apoptotic signals through phosphorylation of relevant substrates such as MAPK.
Mst1 (mammalian sterile 20-like kinase 1) is a ubiquitously expressed serine/threonine kinase having a molecular weight of 59 kD [19]. It is a mammalian homolog of the budding yeast Ste20 kinase [20]. Mst1 is involved in a variety of cellular processes such as morphogenesis, motility, proliferation, stress response, and apoptosis [20–22]. Previous studies have revealed that Mst1 is cleaved by caspase-mediated proteolysis in response to apoptotic stimuli such as FasL treatment [23]. Here, we observe that Mst1 is involved as a mediator of MAPK activation. The C-terminus regulatory region of Mst1 contains two distinct functional domains, which are required for homo- and/or hetero-dimerization and the regulation of kinase activity. Interestingly, two caspase-cleavage sites have also been identified between the regulatory and catalytic domains at the sequences DEMD326S and TMTD349G [24]. Cell-free studies suggest that these sites may be selectively cleaved by caspase-3, -6, -7 and -9 at DEMD326S and caspase-6 and -7 at TMTD349G, to generate catalytically active enzymes of 36 and 40 kDa, respectively [23]. In this study, we clearly demonstrate that caspase-7 preferentially activated JNK and p38 through 40 kDa cleaved forms of Mst1, while caspase-3 preferentially activated ERK through 36 kDa cleaved forms of Mst1.
2. Materials and methods
2.1. Cell culture and survival assay
Human prostate adenocarcinoma DU-145 cells and human breast cancer MCF-7 cells were cultured in Dulbecco’s modified Eagle’s medium (DMEM) with 10% fetal bovine serum (FBS) (HyClone, Logan, UT, USA) and 26 mM sodium bicarbonate for monolayer cell culture. The cells were maintained in a humidified atmosphere containing 5% CO2 and air at 37°C.
2.2. Reagents and antibodies
Polyclonal anti-Mst1, anti-phospho-ERK, anti-ERK, anti-p38, monoclonal anti-phospho-p38, anti-caspase 8, and anti-caspase 7 were purchased from Cell Signaling (Beverly, MA, USA), and anti-ACTIVE (phosphoT183 and phosphoY185) JNK was purchased from Promega (Madison, WI, USA). Polyclonal anti-JNK1 and anti-caspase 3 were purchased from Santa Cruz Biotechnology, Inc. (Santa Cruz, CA, USA). Monoclonal anti-PARP was purchased from Biomol International, L.P. (Plymouth Meeting, PA, USA). Monoclonal anti-actin was purchased from ICN (Costa Mesa, CA, USA).
2.3. Transfection
In order to generate caspase 3 overexpressing MCF-7 cells in a dose-dependent manner, cells were transfected with 0.5 µg ~ 3 µg of pTracer CMV-caspase 3 using Lipofectamine Plus (Gibco-BRL Life Technologies, Grand Island, NY, USA). The expression level was determined by immunoblot analysis.
2.4. Protein extracts and polyacrylamide gel electrophoresis (PAGE)
Cells were lysed with 1 x Laemmli lysis buffer (2.4 M glycerol, 0.14 M Tris, pH 6.8, 0.21 M sodium dodecyl sulfate, 0.3 mM bromophenol blue) and boiled for 10 min. Protein content was measured with BCA Protein Assay Reagent (Pierce, Rockford, IL, USA). The samples were diluted with 1 x lysis buffer containing 1.28 M β-mercaptoethanol, and equal amounts of protein were loaded on 8–12 % sodium dodecyl sulfate (SDS)-polyacrylamide gels. SDS-PAGE analysis was performed according to Laemmli using a Hoefer gel apparatus.
2.5. Immunoblot analysis
Proteins were separated by SDS-PAGE and electrophoretically transferred to nitrocellulose membrane. The nitrocellulose membrane was blocked with 5 % nonfat dry milk in PBS-Tween-20 (0.1 %, v/v) at 4°C overnight. The membrane was incubated with primary antibody (diluted according to the manufacturer’s instructions) for 2 h. Horseradish peroxidase conjugated anti-rabbit or anti-mouse IgG was used as the secondary antibody. Immunoreactive protein was visualized by the chemiluminescence protocol (ECL, Amersham, Arlington Heights, IL, USA).
2.6. ROS generation and FACS analysis
For the determination of ROS generation induced by metabolic oxidative stress or TRAIL (200 ng/ml), hydrogen peroxide generation was measured by incubation with 20 mM fluorescence probe 2’,7’-dichlorofluorescein diacetate (DCF-DA) for 1 h. For the FACS analysis for hydrogen peroxide production induced by TRAIL, hydrogen peroxide generation was measured by incubation with 20 mM fluorescence probe 2’,7’-dichlorofluorescein diacetate (DCF-DA) for 1 h.
2.7. siRNA of Mst1
To construct siRNA of Mst1, pSilencer 2.1-U6 hygro vector (Ambion, Inc., Austin, TX, USA) was used for expressing siRNA for Mst1. The insert for hairpin siRNA into pSilencer was prepared by annealing two oligonucleotides. For human Mst1 siRNA, the top strand sequence was 5′-GATCCGTGCAGCAATGTGACAGCCCTTCAAGAGAGGGCTGTCACATTGCTGCATTTTTTGGAAA-3′, and the bottom strand sequence was 5′-AGCTTTTCCAAAAAATGCAGCAATGTGACAGCCCTCTCTTGAAGGGCTGTCACATTGCTGCACG-3′. The annealed insert was cloned into pSilencer 2.1-U6 hygro digested with BamH I and Hind III. The correct structure of pSilencer 2.1-U6 hygro-Mst1 was confirmed by nucleotide sequencing. The resultant plasmid, pSilencer-Mst1, was transfected into DU-145 cells. The interference of Mst1 protein expression was confirmed by immunoblot using anti-Mst1 antibody.
2.8. Site-directed mutagenesis
The QuickChange XL Site-Directed Mutagenesis Kit (Stratagene, La Jolla, CA, USA) was used to make point mutations in Mst1 protein. One Asp residue in Mst1 (Asp-349 Mst1) was replaced with Glu (Glu-349 Mst1). Sense primer (5′-CAGCACCATGACTGAAGGAGCCAATACTATG-3′) and antisense primer (5′-CATAGTATTGGCTCCTTCAGTCATGGTGCTG-3′) were used for site-directed mutagenesis. PCR reaction was prepared by adding 5 µl of 10X reaction buffer, 20 ng of dsDNA template (pCMV5M-Myc-Mst1 wild type or pCMV5M-Myc-Mst1 323NEMN326 which were both kindly provided by Dr. Chernoff (Fox Chase Cancer Center, Philadelphia, PA, USA)), 125 ng of each sense primer, 125 ng of each antisense primer, 1 µl of deoxyribonucleotide triphosphate mix, 3 µl QuickSolution, double-distilled water to a final volume of 50 µl, and 1 µl of Pfu Turbo DNA polymerase (2.5 U/µl). PCR was performed with 18 cycles (95°C for 50 sec; 60°C for 50 sec; 68°C for 7 min) with initial incubation at 95°C for 1 min. Following temperature cycling, the reaction was placed on ice for 2 min to cool the reaction. After PCR, 1 µl of Dpn I restriction enzyme (10 U/µl) was added directly to each amplification reaction and incubated at 37°C for 1 h to digest the parental supercoiled dsDNA. The Dpn I-treated dsDNA was transformed into Epicurian coli XL1-Blue supercompetent cells. Colonies were selected and the resultant plasmid was sequenced using primer (5′-GCAATCTTCATGATTCCTAC-3′) to confirm mutation.
2.9. Construction of Mst1 deletion mutants
Various Mst1 deletion mutants myc-tagged at their N-terminal and with restriction enzyme recognition sites at the flanking sides (5′, Hind III; 3′, BamHI) were produced by PCR. For Mst1-Myc 1–349 (amino acids 1–349) or Mst1-Myc 1–349 with D326N, sense primer was 5′-TAATAAGCTTATGGAACAGAAACTCATCTCTGAAG-3′, and antisense primer was 5′-CGATGGATCCTCAATCAGTCATGGTGCTGGCTACTC-3′. As a PCR template, pCMV5M-Myc-Mst1 wild type or pCMV5M-Myc-Mst1 with D326N was used, respectively. For Mst1-Myc 1–326 (amino acids 1–326), sense primer was 5′-TAATAAGCTTATGGAACAGAAACTCATCTCTGAAG-3′, and antisense primer was 5′- CAGAGGATCCTTAATCCATTTCATCCTCTTCTGAG -3′, and pCMV5M-Myc-Mst1 wild type was used as a template. pcDNA3.1hygro-Myc-Mst1 1–349 wild type or 1–349 with D326N or 1–326 was made by inserting the Hind III/BamHI-cleaved PCR product of various deletion mutants into Hind III/BamHI-cut pcDNA3.1hygro vector.
3. Results
3.1. TRAIL-induced MAPKs activation was not caused by ROS generation
In contrast to the well-known mechanism of TRAIL-induced caspase activation followed by PARP cleavage, TRAIL-induced MAPK activation and its relation to apoptosis is not well understood. Nevertheless, several researchers reported that ROS generation played a role as an upstream mediator of caspases as well as MAPK activation during TRAIL-induced apoptosis [25, 26]. To verify these reports, in the first step, we examined whether TRAIL treatment activated MAPKs. We observed that three kinds of MAPK (JNK, p38, and ERK) were phosphorylated in accordance with caspase-8 activation and PARP cleavage during TRAIL treatment (Fig. 1). In the next step, we attempted to determine ROS generation, as measured by hydrogen peroxide generation, during TRAIL treatment. We used 2′, 7′-dichlorofluorescein diacetate (DCF-DA), a ROS-sensing molecule, which is oxidized in the presence of ROS, causing the dyes to fluoresce. Figure 2A and 2B demonstrate that ROS is not generated during TRAIL treatment. To confirm that ROS was not involved in TRAIL-induced MAPKs activation, activation of MAPKs was examined after TRAIL treatment of DU-145 cells in which catalase had been overexpressed for the purpose of decreasing the intracellular level of ROS (Fig. 2C). Figure 2C shows that the level of phosphorylation of MAPKs (JNK, p38, ERK) is not decreased in catalase-overexpressed cells after TRAIL treatment, implying that TRAIL-induced MAPKs are not related to ROS generation, at least in DU-145 cells.
Figure 1. TRAIL-induced MAPK activation.
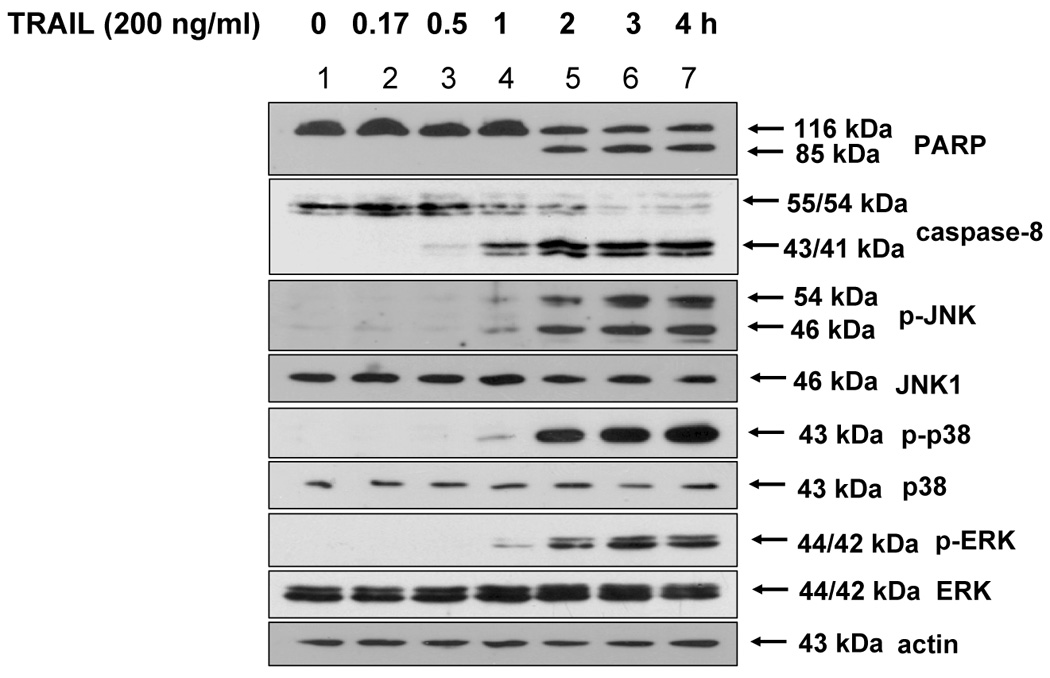
DU-145 cells were treated with 200 ng/ml of TRAIL for various times, and the cell lysates were analyzed for the detection of phosphorylated JNK, p38, and ERK as well as PARP and caspase-8. Western blots shown are representative of three independent experiments.
Figure 2. Determination of ROS generation induced by TRAIL.
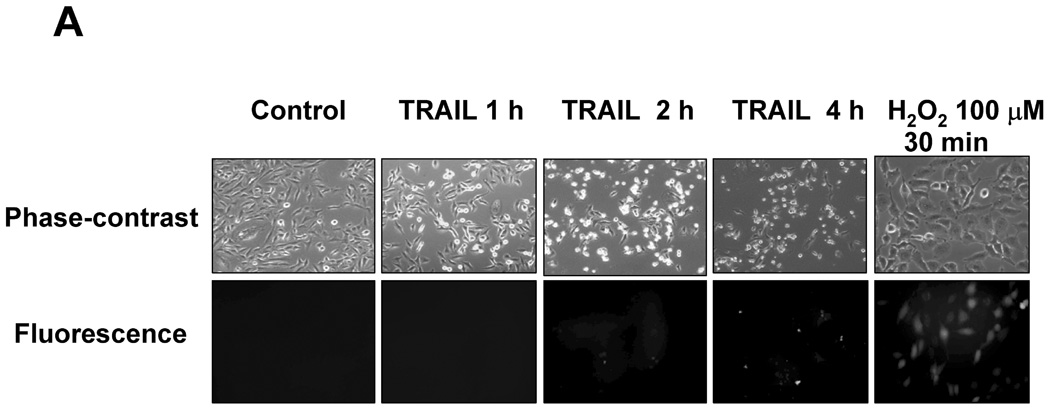
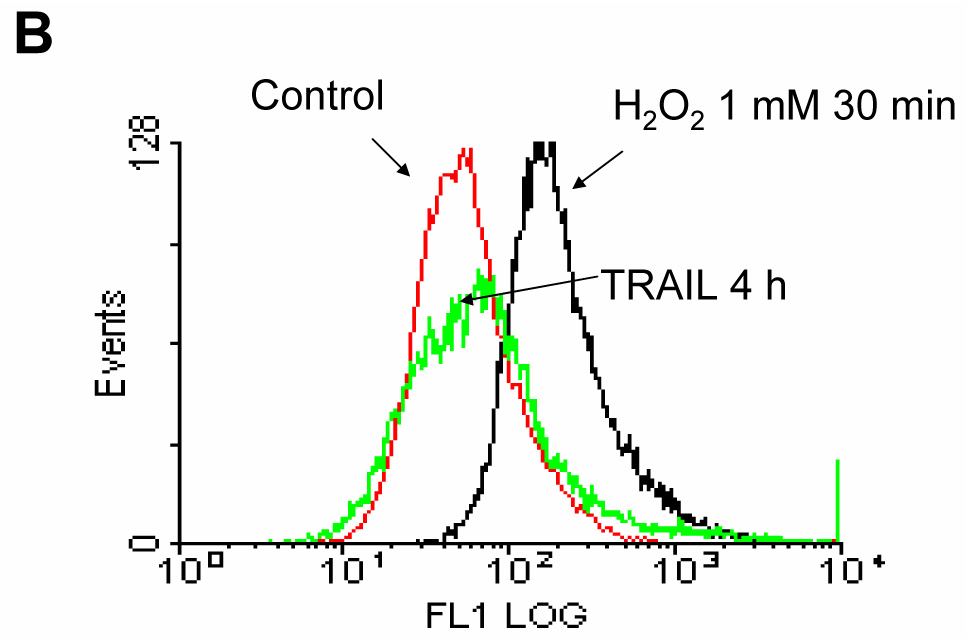
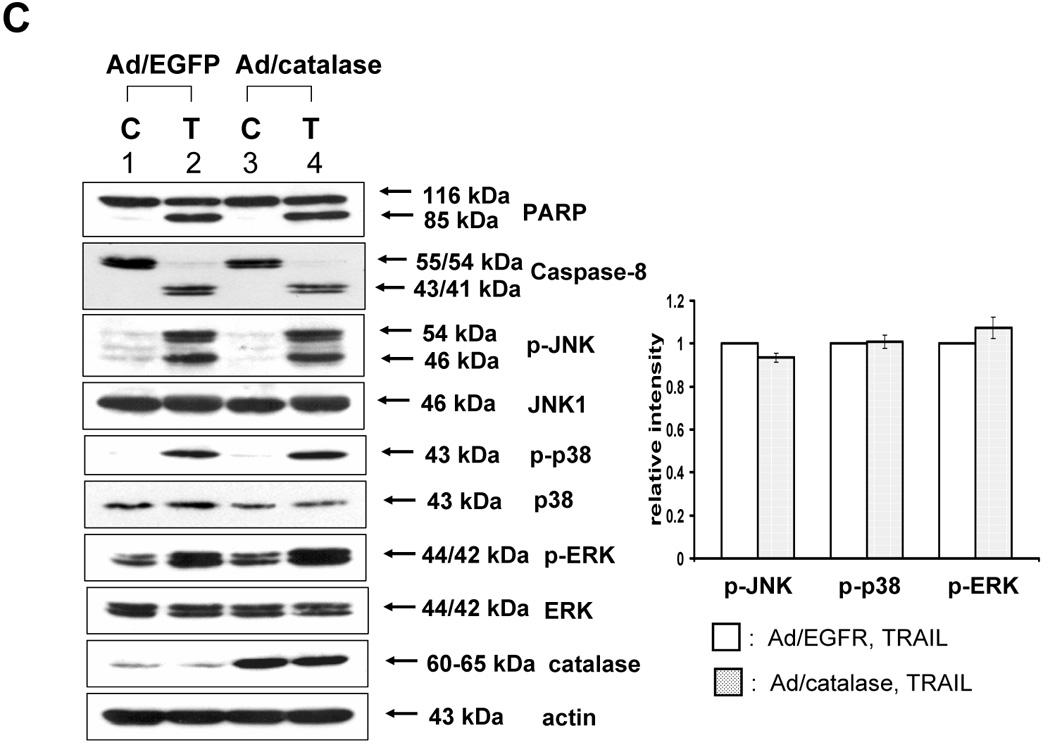
(A) DU-145 cells were treated with TRAIL (200 ng/ml) for indicated times, and hydrogen peroxide generation was measured by incubation with 20 mM fluorescence probe 2’,7’-dichlorofluorescein diacetate (DCF-DA) for 1 h using fluorescence microscope. (B) As an alternative way of measurement of hydrogen peroxide generation, flow cytometry was used. After TRAIL-treated DU-145 cells were incubated with 20 mM fluorescence probe 2’,7’-dichlorofluorescein diacetate (DCF-DA) for 1 h, stained cells were analyzed with FACscan flow cytometer. (C) After catalase-overexpressed DU-145 cells by adenoviral infection expressing catalase (100 moi) or EGFP-overexpressed DU-145 cells by adenoviral infection expressing EGFP as a control (100 moi) were treated with TRAIL (200 ng/ml, 4 h), various MAPKs were examined. Left panel: Western blot analysis, C, control; T, TRAIL. Right panel: The ratio of the phosphorylated MAPKs to total protein of corresponding MAPKs in TRAIL-treated EGFP-overexpressed cells was set equal to 1, and the ratio of the phosphorylated MAPKs to total protein of corresponding MAPKs in TRAIL-treated catalase-overexpressed cells was compared to this. Data are expressed as mean ± SE of the densitometry data from three independent experiments.
3.2. TRAIL induced caspase-8-dependent MAPKs activation
After eliminating ROS involvement with MAPKs activation by TRAIL, we examined whether caspases acted as MAPKs activators. We first tested caspase-8, since Varfolomeev et al [17] has already documented its ability to activate kinases. We tried to demonstrate that three kinds of MAPK (JNK, p38, ERK) were phosphorylated in accordance with caspase-8 activation during TRAIL treatment (Fig. 3). As shown in figure 3A, phosphorylation of MAPKs induced by TRAIL was decreased by caspase-8 inhibitor (Z-IETD-FMK), and caspase-8 involvement in TRAIL-induced MAPKs activation was confirmed by downregulating caspase-8 using siRNA caspase-8 (Santa Cruz) (Fig. 3B).
Figure 3. Involvement of caspase-8 during TRAIL-induced MAPKs activation in DU-145.
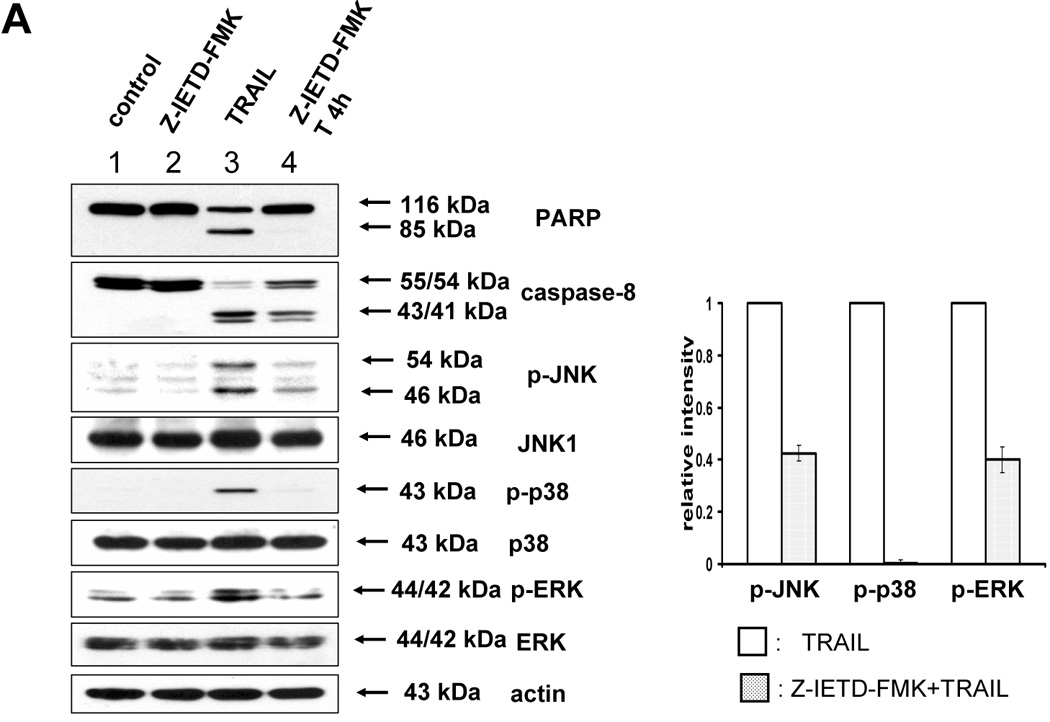
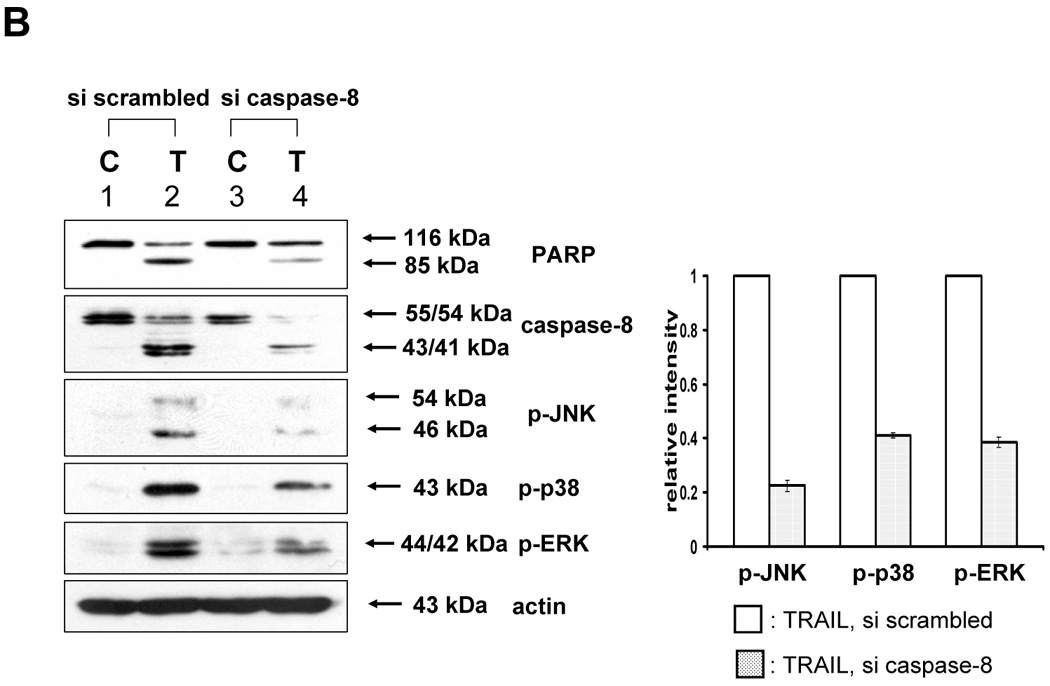
(A) After caspase-8 inhibitor (Z-IETD-FMK 20 µM) was pretreated for 30 min, followed by TRAIL treatment (200 ng/ml) for 4 h, various MAPKs were examined. Left panel: Western blot analysis. Right panel: The ratio of the phosphorylated MAPKs to total protein of corresponding MAPKs in TRAIL-treated DU-145 cells was set equal to 1, and the ratio of the phosphorylated MAPKs to total protein of corresponding MAPKs in TRAIL-treated DU-145 cells with caspase-8 inhibitor pretreatment was compared to this. Data are expressed as mean ± SE of the densitometry data from three independent experiments. (B) After caspase-8 was downregulated by siRNA of caspase-8, TRAIL was treated for the examination of various MAPKs. Left panel: Western blot analysis, C, control; T, TRAIL. Right panel: The ratio of the phosphorylated MAPKs to corresponding actin in TRAIL-treated si scrambled RNA-transfected cells was set equal to 1, and the ratio of the phosphorylated MAPKs to corresponding actin in TRAIL-treated si caspase-8 RNA-transfected cells was compared to this. Data are expressed as mean ± SE of the densitometry data from three independent experiments.
3.3. TRAIL induced different MAPKs activation for caspase-7 and caspase-3
Next, we investigated caspase-7 and caspase-3 as executor caspases of caspase-8 to determine whether caspase-7 or -3 was also involved in the TRAIL-induced MAPKs activation. For this purpose, caspase-7 or -3 was downregulated by using siRNA of caspase-7 or -3 in DU-145 cells, and then TRAIL-induced phosphorylation of MAPKs was examined (Fig. 4A, 4B). Figure 4A demonstrates that caspase-7 plays an important role as a mediator of TRAIL-induced MAPKs phosphorylation. However, unexpectedly, when caspase-3 was downregulated, phosphorylation of JNK and p38 was increased, and phosphorylation of ERK was decreased (Fig. 4B). To confirm that caspase-7 and caspase-3 have different roles in MAPKs activation during TRAIL treatment, MCF-7 cells that lack caspase-3 were used. As shown in DU-145 cells, phosphorylation of all MAPKs was decreased in the cells with caspase-8 inhibition and caspase-7 downregulation (Figs. 5A and 5B). However, when caspase-3 was overexpressed, phosphorylation of JNK and p38 was decreased, but conversely, phosphorylation of ERK was increased (Figs. 5C and 5D), which suggests that caspase-3 functions as a critical negative mediator of JNK and p38 phosphorylation.
Figure 4. Involvement of caspase-7 or -3 during TRAIL-induced MAPKs activation in DU-145.
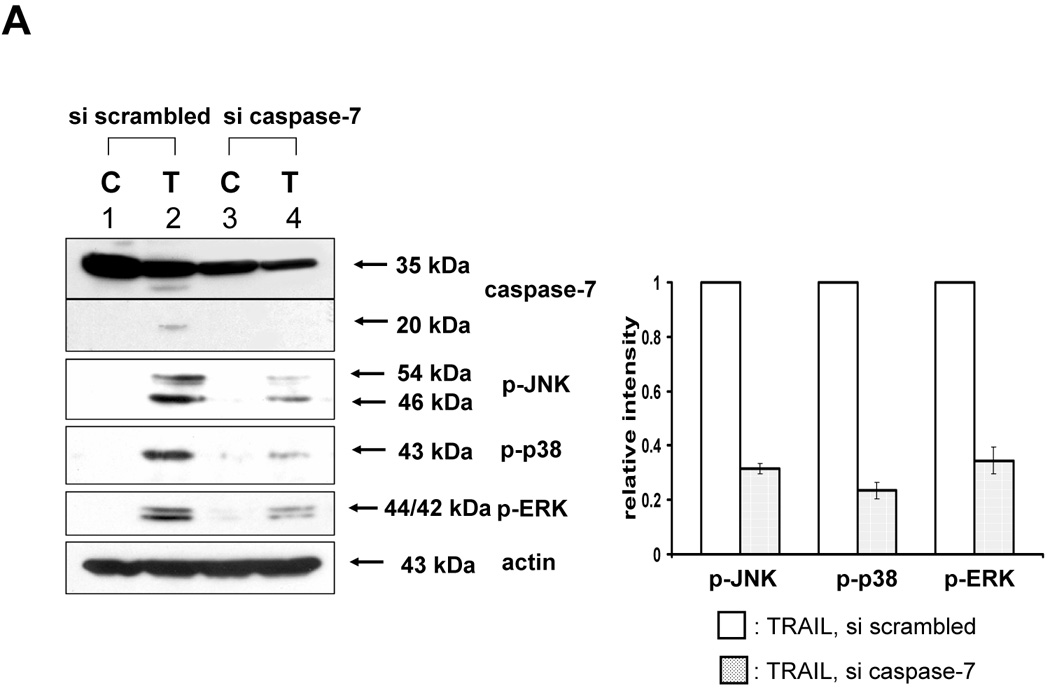
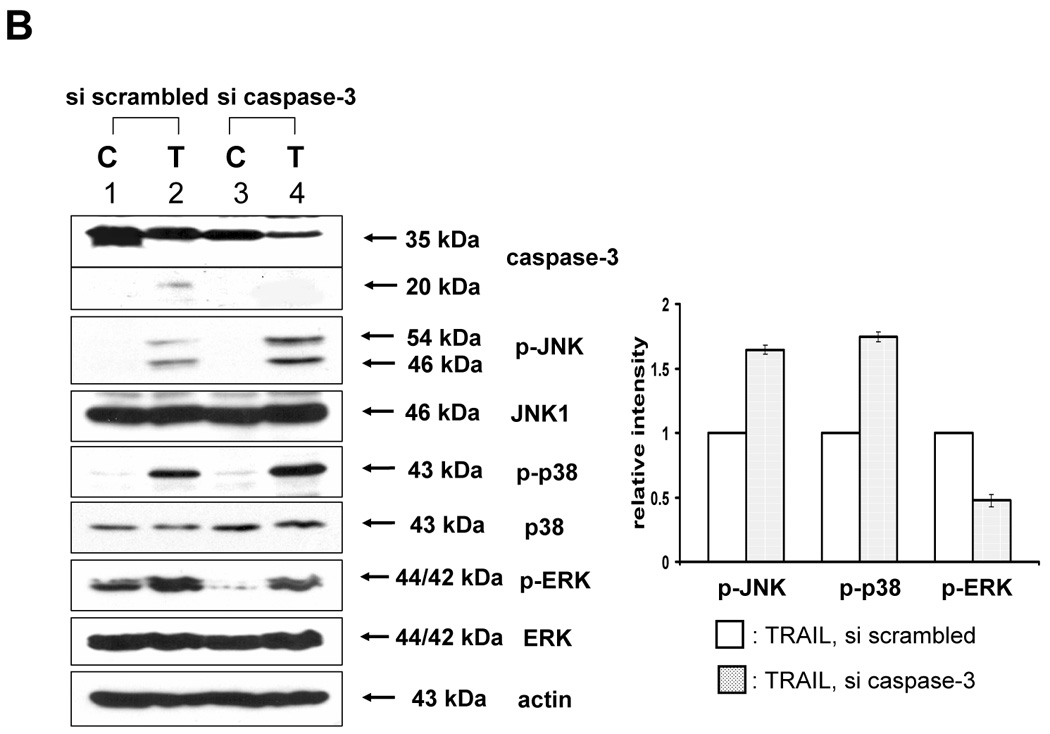
(A) MAPKs phosphorylation induced by TRAIL treatment (200 ng/ml, 4 h) was examined after caspase-7 was downregulated by siRNA of caspase-7. Left panel: Western blot analysis, C, control; T, TRAIL. Right panel: The ratio of the phosphorylated MAPKs to corresponding actin in TRAIL-treated si scrambled RNA-transfected cells was set equal to 1, and the ratio of the phosphorylated MAPKs to corresponding actin in TRAIL-treated si caspase-7 RNA-transfected cells was compared to this. Data are expressed as mean ± SE of the densitometry data from three independent experiments. (B) MAPKs phosphorylation induced by TRAIL treatment (200 ng/ml, 4 h) was examined after caspase-3 was downregulated by siRNA of caspase-3. Left panel: Western blot analysis, C, control; T, TRAIL. Right panel: The ratio of the phosphorylated MAPKs to total protein of corresponding MAPKs in TRAIL-treated si scrambled RNA-transfected cells was set equal to 1, and the ratio of the phosphorylated MAPKs to total protein of corresponding MAPKs in TRAIL-treated si caspase-3 RNA-transfected cells was compared to this. Data are expressed as mean ± SE of the densitometry data from three independent experiments.
Figure 5. Involvement of caspase-8, -7 and -3 during TRAIL-induced MAPKs activation in MCF-7.
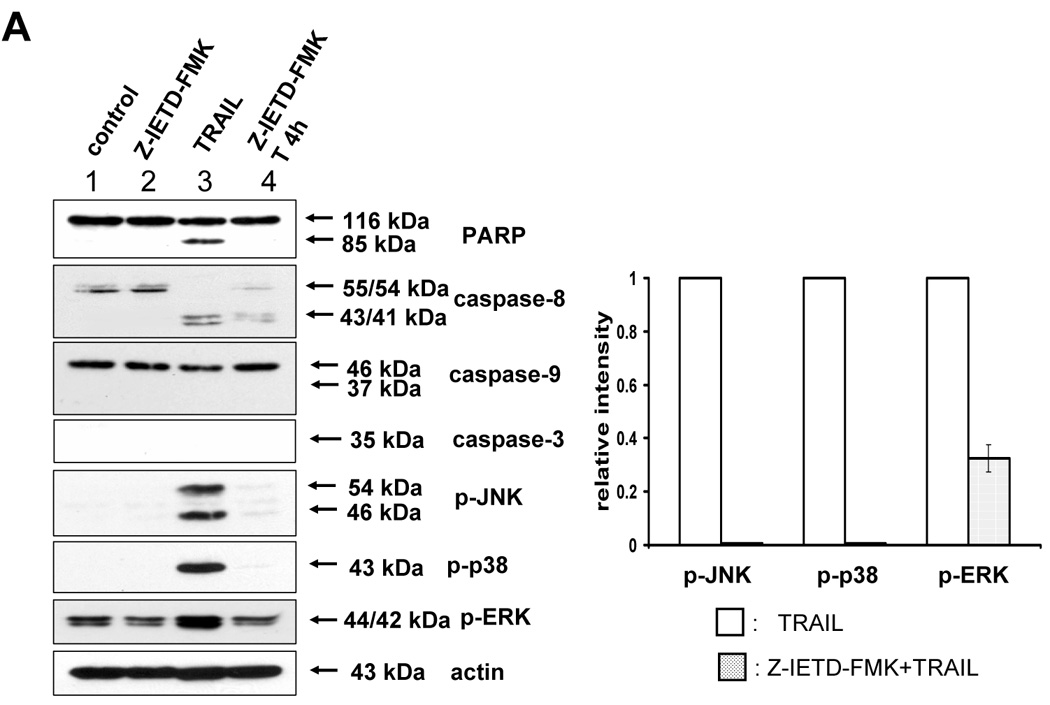
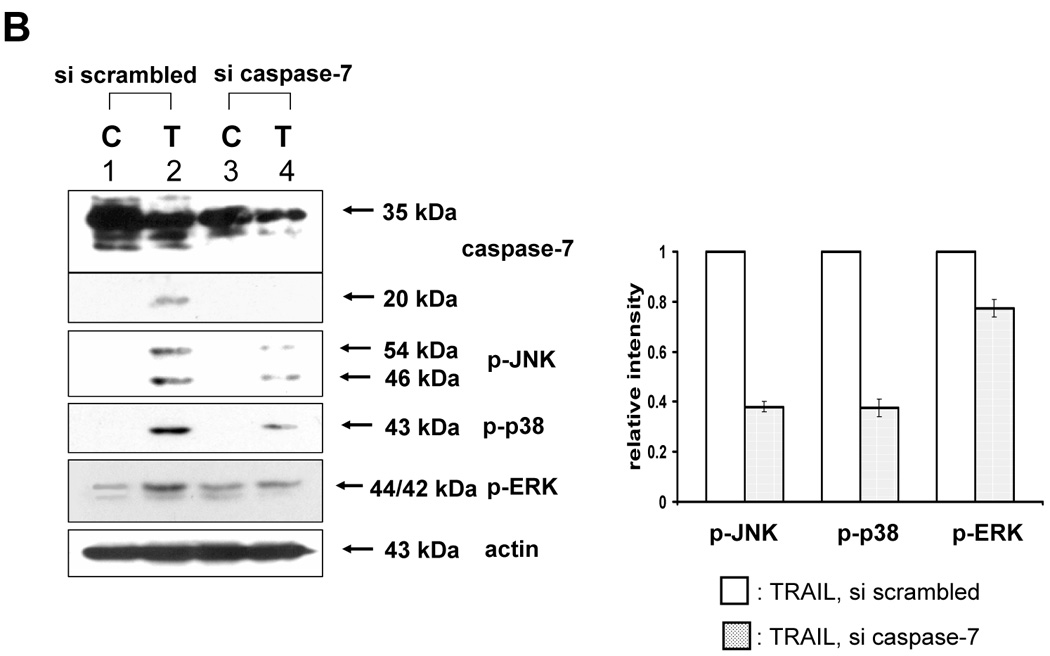
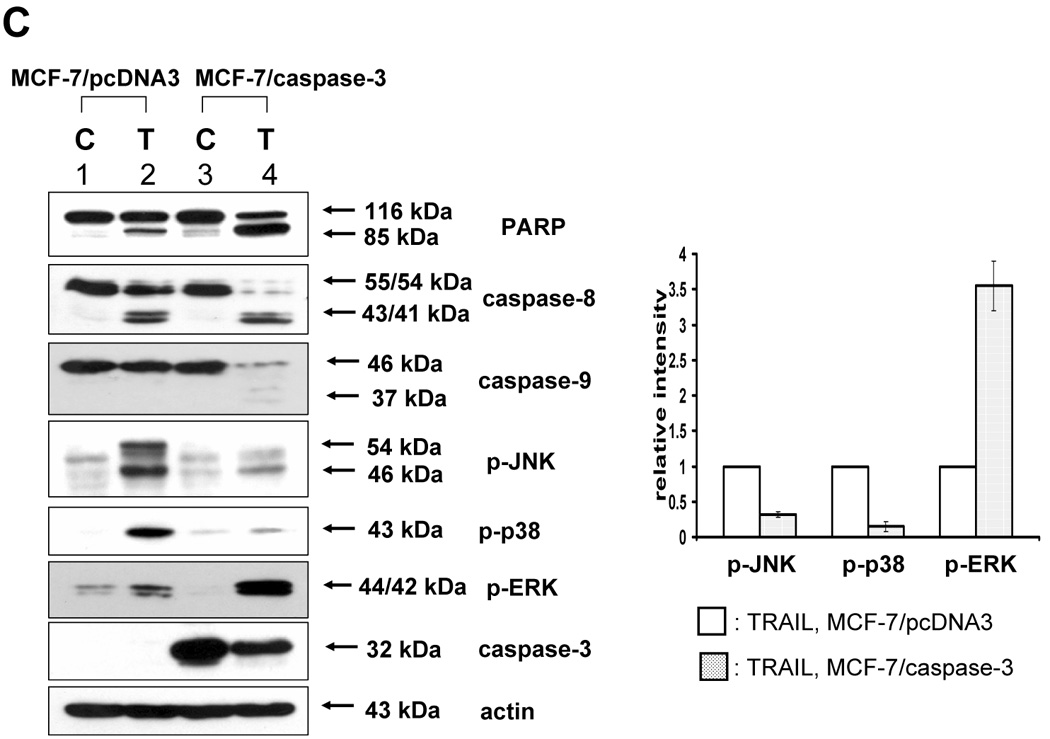
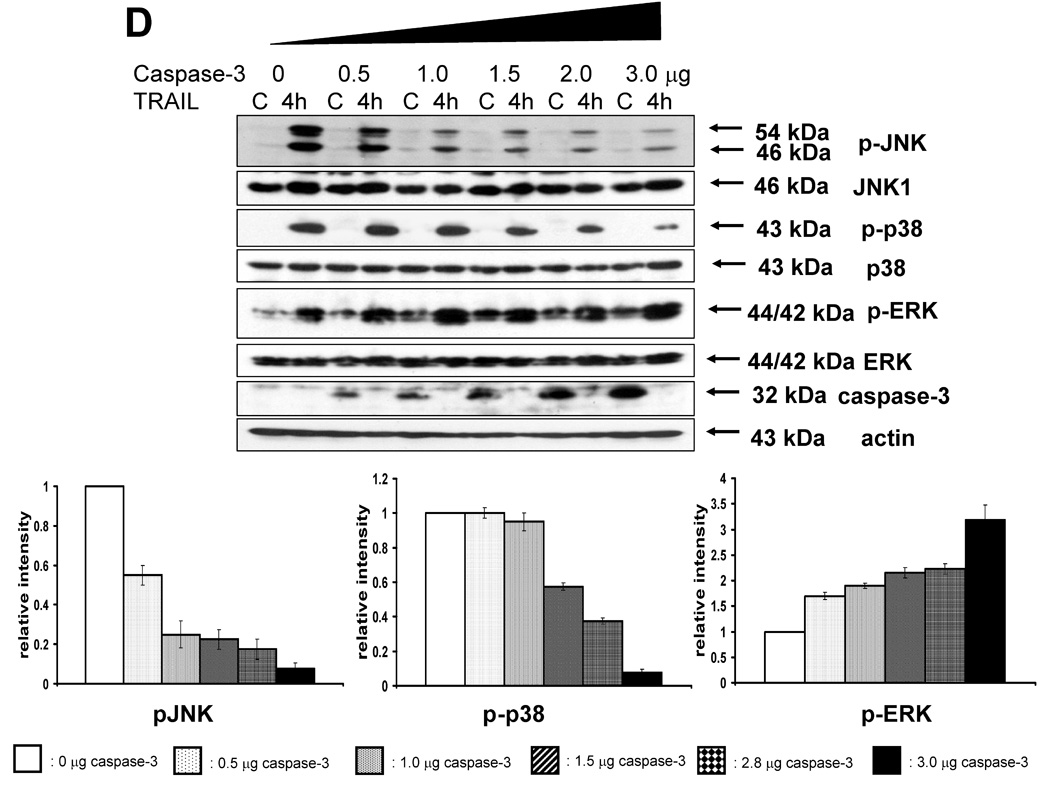
(A) After caspase-8 inhibitor (Z-IETD-FMK 20 µM) was pretreated for 30 min, MAPKs phosphorylation induced by TRAIL treatment (200 ng/ml, 4 h) was examined in MCF-7 cells that lack caspase-3. Left panel: Western blot analysis. Right panel: The ratio of the phosphorylated MAPKs to corresponding actin protein in TRAIL-treated MCF-7 cells was set equal to 1, and the ratio of the phosphorylated MAPKs to corresponding actin protein in TRAIL-treated MCF-7 cells with caspase-8 inhibitor pretreatment was compared to this. Data are expressed as mean ± SE of the densitometry data from three independent experiments. (B) MAPKs phosphorylation induced by TRAIL treatment (200 ng/ml, 4 h) was examined after caspase-7 was downregulated by siRNA of caspase-7 in caspase-3-deficient MCF-7 cells. Left panel: Western blot analysis, C, control; T, TRAIL. Right panel: The ratio of the phosphorylated MAPKs to corresponding actin protein in TRAIL-treated si scrambled RNA-transfected cells was set equal to 1, and the ratio of the phosphorylated MAPKs to corresponding actin protein in TRAIL-treated si caspase-7 RNA-transfected cells was compared to this. Data are expressed as mean ± SE of the densitometry data from three independent experiments. (C) MAPKs phosphorylation induced by TRAIL treatment (200 ng/ml, 4 h) was examined in MCF-7 cells overexpressing caspase-3. Left panel: Western blot analysis, C, control; T, TRAIL. Right panel: The ratio of the phosphorylated MAPKs to corresponding actin protein in TRAIL-treated MCF-7/pcDNA3 cells was set equal to 1, and the ratio of the phosphorylated MAPKs to corresponding actin protein in TRAIL-treated MCF-7/caspase-3 cells was compared to this. Data are expressed as mean ± SE of the densitometry data from three independent experiments. (D) After caspase-3 transfection in dose-dependent manner, MAPKs phosphorylation was examined after TRAIL treatment (200 ng/ml, 4 h) in MCF-7 cells overexpressing caspase-3. Upper panel: Western blot analysis, C, control. Lower panel: The ratio of the phosphorylated MAPKs to total protein of corresponding MAPKs in TRAIL-treated cells with no caspase-3 transfection was set equal to 1, and the ratio of the phosphorylated MAPKs to total protein of corresponding MAPKs in TRAIL-treated cells with different amounts of caspase-3 transfection was compared to this. Note the difference in vertical scale of the three subpanels. Data are expressed as mean ± SE of the densitometry data from three independent experiments.
3.4. Mst1 was a bridge between caspase and kinase activation
The previous results revealed that TRAIL-activated caspase was involved in the activation of MAPK. We further examined how activated caspase regulated MAPK activation. Previous studies suggest that the kinase Mst1 acts as a bridge between proteolysis and kinase activation. Thus it might act as a bridge between caspase-3 and -7 and ERK, JNK, and p38. For confirmation of the involvement of Mst1 as an upstream initiator of the MAPKs (JNK, p38, and ERK), loss of function by siRNA was used. After incorporating the sequences for siRNA of Mst1 into pSilencer 2.1-U6 hygro vector, the resultant plasmid pSilencer/si-Mst1 was transfected into DU-145 cells and phosphorylated MAPKs were investigated after TRAIL treatment (Fig. 6A). Figure 6A shows that knockdown of Mst1 expression led to inhibition of MAPKs activation during TRAIL treatment. These results suggest that Mst1 functioned as a mediator of TRAIL-induced MAPKs activation. To make a stable cell line of siRNA of Mst1, the transfected DU-145 cells were incubated with hygromycin B (250 µg/ml), and hygromycin B-resistant cell clones were isolated. Then, the interference of Mst1 protein expression was confirmed by immunoblot using anti-Mst1 antibody (Fig. 6B). We selected several stable transfectants and chose one transfectant (clone #6) for the confirmation of involvement of Mst1 in TRAIL-induced MAPKs activation (Fig. 6C, left). To exclude the possibility that single clone # 6 is derived from a sensitive parent cell, a pool of selected clones (#6, #7, and #8) was again examined for the involvement of Mst1 in TRAIL-induced MAPKs (Fig. 6C, right). Figures 6C and 6D clearly show that TRAIL-induced MAPKs are dependent on Mst1, and Mst1 cleavage is also dependent on caspase-8 activation.
Figure 6. Mst1 as a mediator of caspase activation to MAPKs phosphorylation during TRAIL treatment.
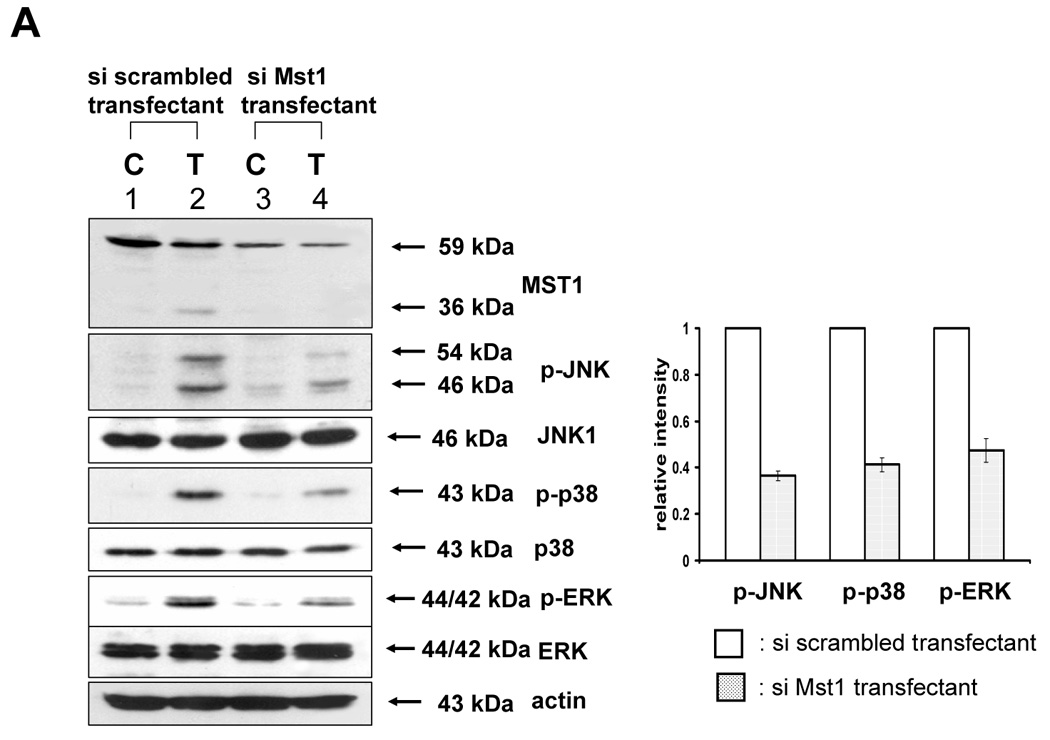
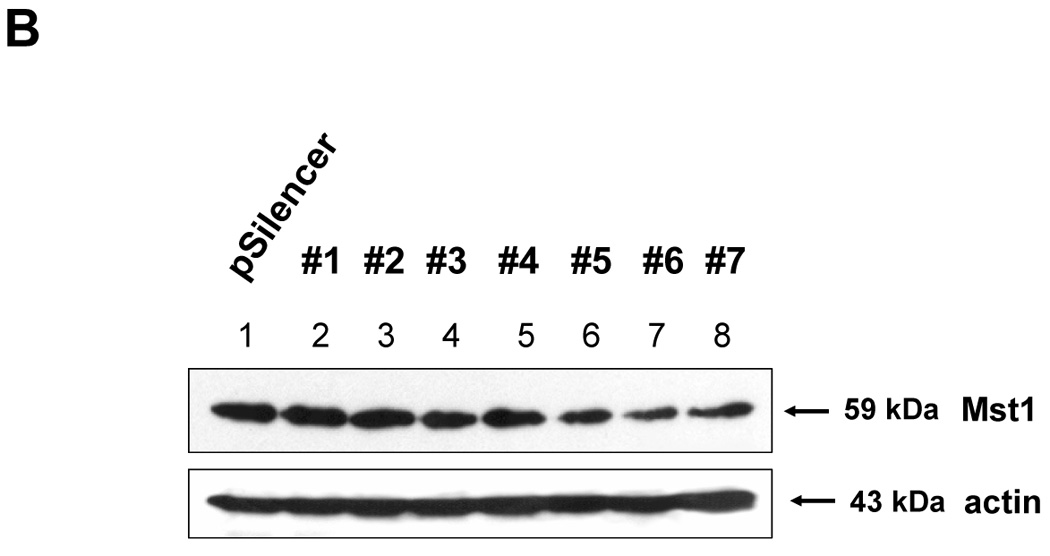
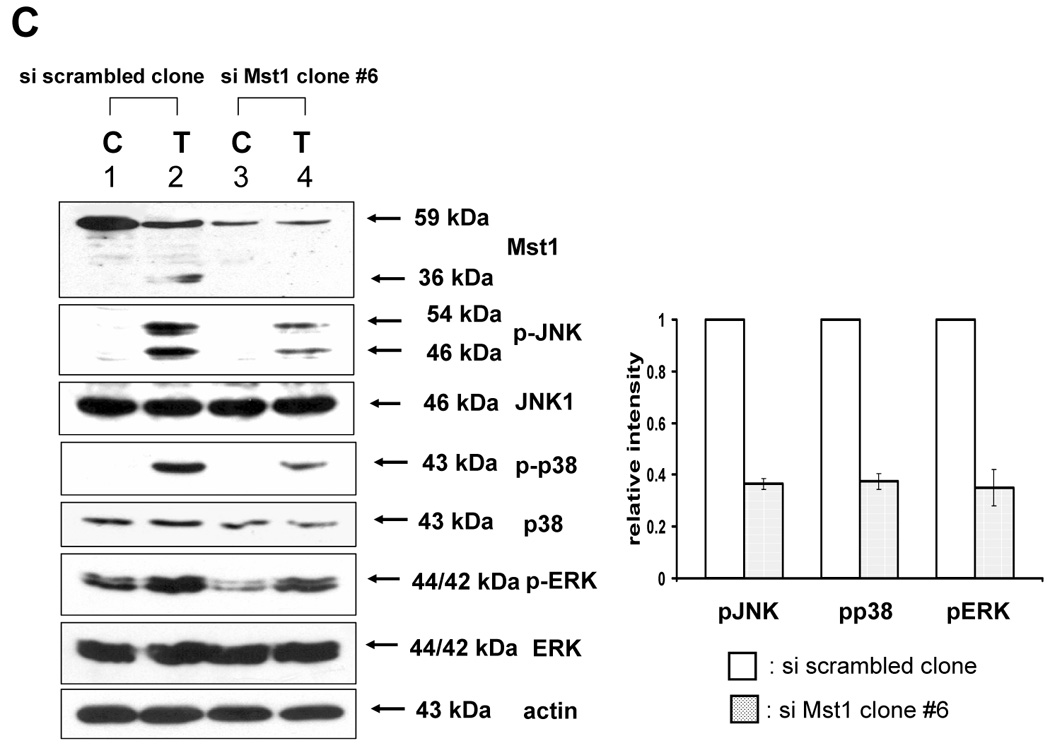
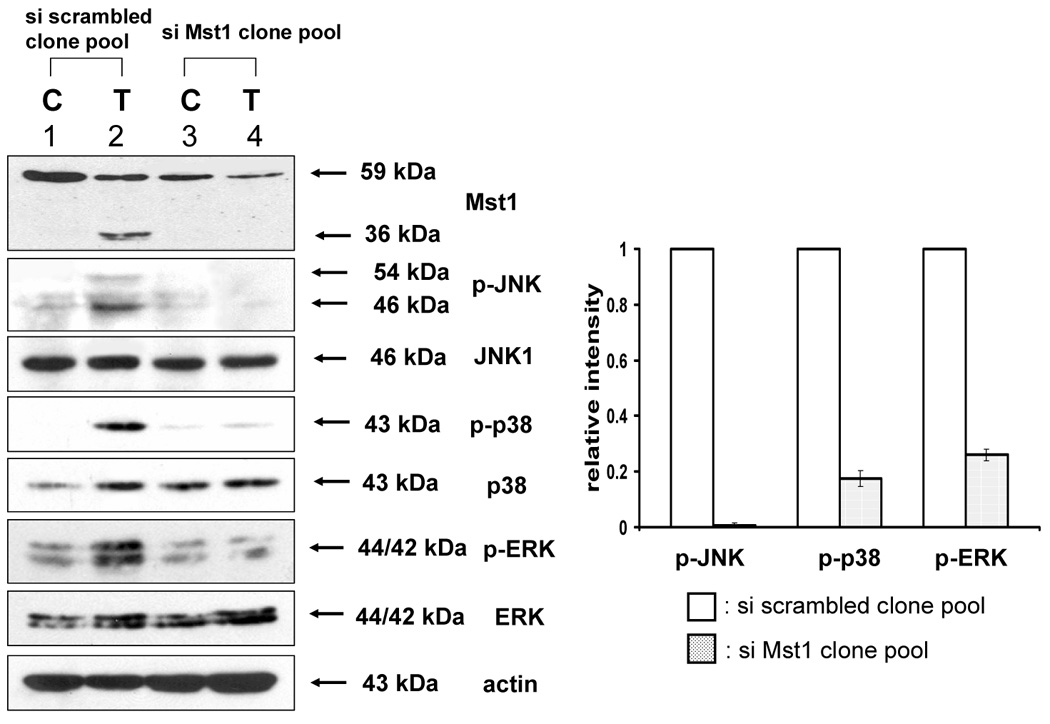
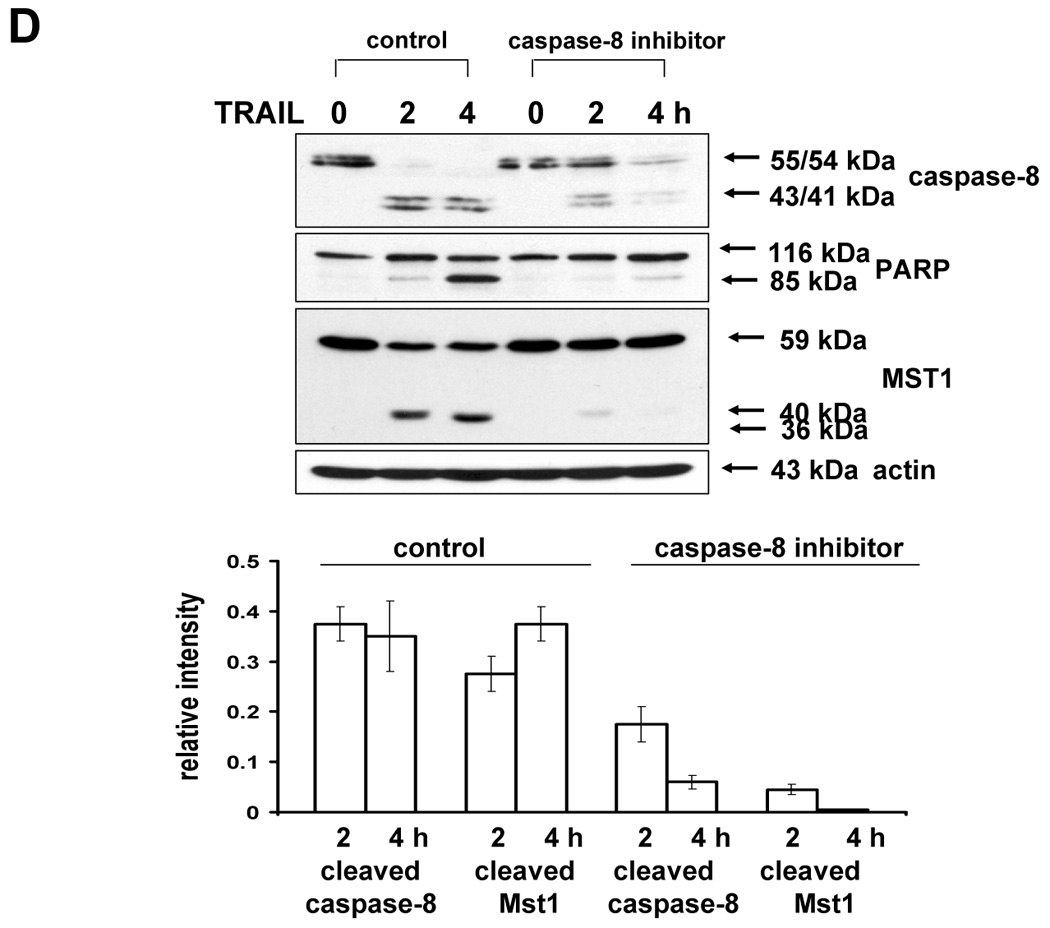
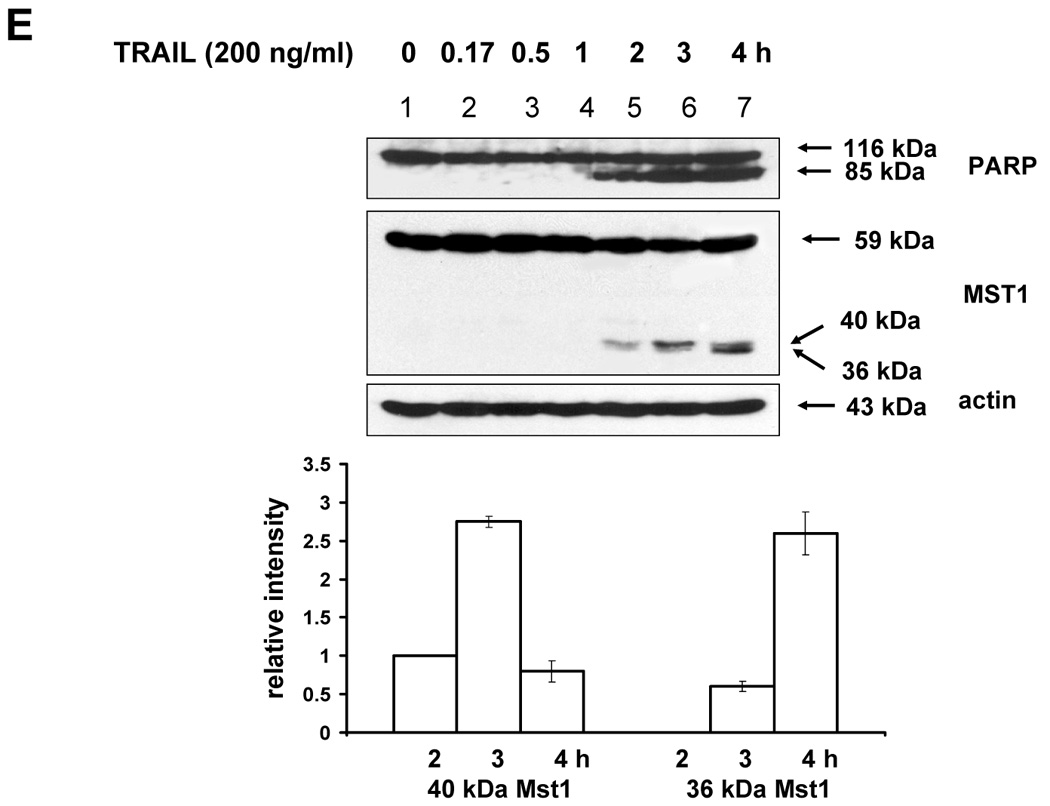
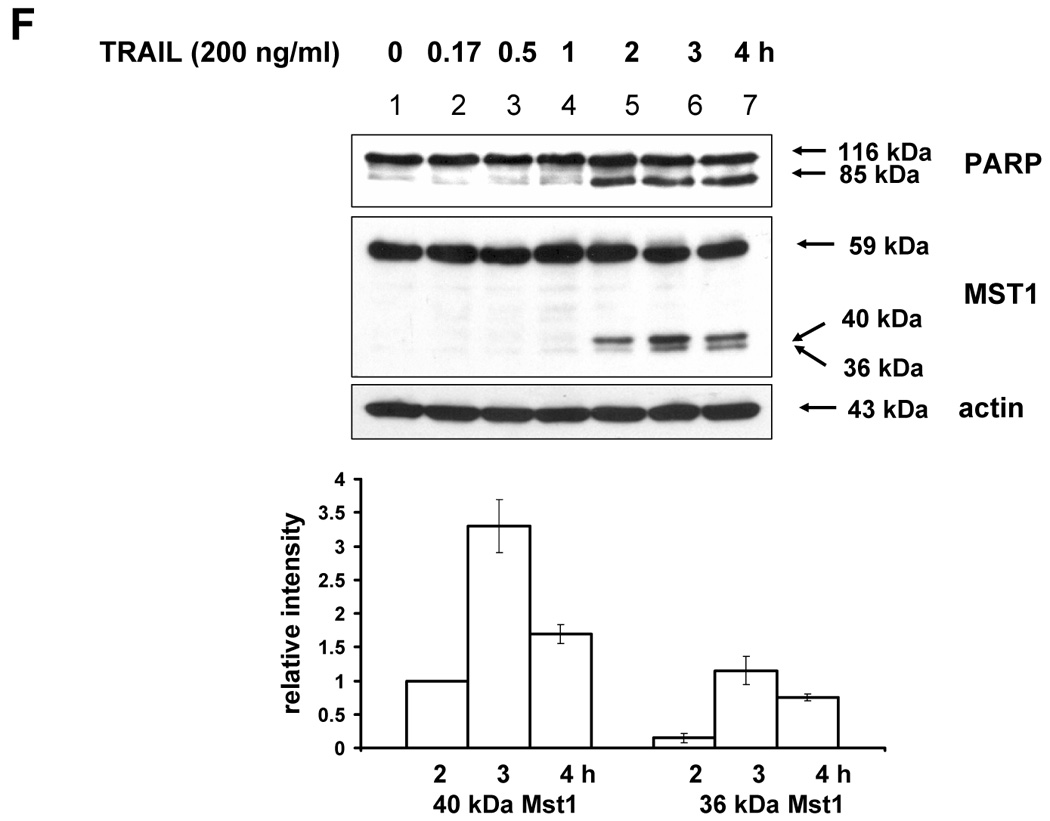
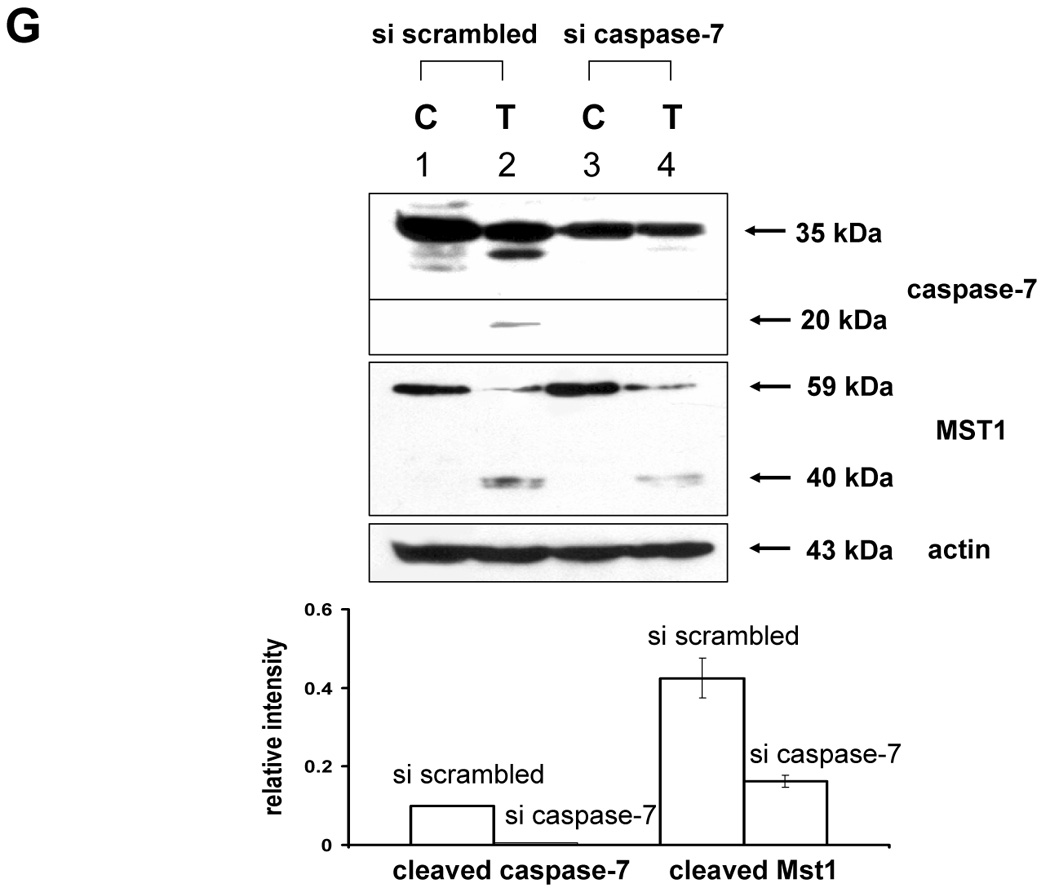
(A) MAPKs phosphorylation induced by TRAIL treatment (200 ng/ml, 4 h) was examined after transfection of control vector (pSilencer) or pSilencer-siMst1 into DU-145 cells. Left panel: Western blot analysis, C, control; T, TRAIL. Right panel: The ratio of the phosphorylated MAPKs to total protein of corresponding MAPKs in TRAIL-treated si scrambled plasmid-transfected cells was set equal to 1, and the ratio of the phosphorylated MAPKs to total protein of corresponding MAPKs in TRAIL-treated si caspase-7 plasmid-transfected cells was compared to this. Data are expressed as mean ± SE of the densitometry data from three independent experiments. (B) Immunoblots were made of Mst1 expression in control vector transfected (pSilencer) or pSilencer-siMst1 stably transfected single cell clones from DU-145 cells. Lysates containing equal amounts of proteins (20 µg) were separated by SDS-PAGE and immunoblotted with anti-Mst1 antibody. (C) Control plasmid (pSilencer) or pSilencer-siMst1 stably transfected cells (clone #6) or a pool of selected clones (#6, #7, and #8) was treated with TRAIL (200 ng/ml) for 4 h, and phosphorylation of MAPKs was examined. Left panel: Western blot analysis, C, control; T, TRAIL. Right panel: The ratio of the phosphorylated MAPKs to total protein of corresponding MAPKs in TRAIL-treated si scrambled plasmid-transfected stable cell clone or clone pool was set equal to 1, and the ratio of the phosphorylated MAPKs to total protein of corresponding MAPKs in TRAIL-treated si Mst1 plasmid-transfected stable clone or pool was compared to this. Data are expressed as mean ± SE of the densitometry data from three independent experiments. (D) Mst1 cleavage was examined in the presence of caspase-8 inhibitor (Z-IETD-FMK 20 µM, 30 min) pretreatment before TRAIL treatment (200 ng/ml, 2 h or 4 h) in DU-145 cells. Upper panel: Western blot analysis. Lower panel: The ratio of the uncleaved caspase-8 or Mst1 to corresponding actin at 0 h was set equal to 1 (not shown), and the ratio of the cleaved caspase-8 or cleaved Mst1 to corresponding actin at 2 h and 4 h of TRAIL treatment was compared to this. Data are expressed as mean ± SE of the densitometry data from three independent experiments. (E, F) Shift of cleaved forms of Mst1 during TRAIL treatment (200 ng/ml, 0–4 h) was examined in by Western blot analysis in DU-145 cells or MCF-7 cells, respectively. Lower panel: The ratio of the 40 kDa cleaved Mst1 to corresponding actin at 2 h was set equal to 1, and the ratio of the 40 kDa cleaved Mst1 to corresponding actin at 3 h and 4 h was compared to this, then again the 40 kDa cleaved Mst1 at 2 h was set equal to 1, and compared with 36 kDa cleaved Mst1 for hours 2, 3 and 4. Data are expressed as mean ± SE of the densitometry data from three independent experiments. (G) Involvement of caspase-7 with the cleaved forms of Mst1 during TRAIL treatment (200 ng/ml, 2 h) was examined in DU-145 cells after caspase-7 was downregulated by siRNA of caspase-7. Upper panel: Western blot analysis, C, control; T, TRAIL. Lower panel: The ratio of the 20 kDa cleaved caspase-7 (or 40 kDa cleaved Mst1) in TRAIL-treated si scrambled RNA-transfected cells to 35 kDa uncleaved caspase-7 (or 59 kDa uncleaved Mst1) in TRAIL-treated si scrambled RNA-transfected cells was compared to the ratio of the 20 kDa cleaved caspase-7 (or 40 kDa cleaved Mst1) in TRAIL-treated si caspase-7 RNA-transfected cells to 35 kDa uncleaved caspase-7 (or 59 kDa uncleaved Mst1) in TRAIL-treated si caspase-7 RNA-transfected cells. Data are expressed as mean ± SE of the densitometry data from three independent experiments.
3.5. Differential regulation of MAPKs activation by Mst1 depended on Mst1 cleavage site
The next question was how MAPKs activation might be regulated differentially by Mst1. A previous report [23] demonstrated that the two cleavage sites of Mst1 recognized by caspases had a differential caspase sensitivity; namely, caspase-3 or caspase-7 cleaved Mst1 at D326 in vitro, while only caspase-7 cleaved Mst1 at D349 in vitro. Moreover, we observed that the different sizes of the cleaved forms of Mst1 appear sequentially (40 kDa, then 36 kDa) during TRAIL treatment (Fig. 6E), which suggests that caspase-7 which cleaves mainly D349 (40 kDa) is first activated and then caspase-3 activation for the cleavage of D326 (36 kDa) follows. In caspase-3-deficient-MCF-7 cells, a smaller amount of 36 kDa appeared at the later time of TRAIL incubation (Fig. 6F). Furthermore, 40 kDa of Mst1 was decreased in caspase-7-downregulated DU-145 after TRAIL treatment (2 h) (Fig. 6G). Figures 6F and 6G strengthen the fact that caspase-7 for D349 and caspase-3 for D326 are consecutively activated. From our results (Fig. 3–Fig. 6), we hypothesized that the 40 kDa of Mst1 cleaved by caspase-7 preferentially activated JNK or p38, whereas the 36 kDa of Mst1 cleaved by caspase-3 preferentially activated ERK. To test this hypothesis, we first generated mutants of Mst1, in which D326, D349, and both D326 and D349 were point-mutated. After generation of various mutants, each construct was transfected into a Mst1-knockdown selected cell clone (#6) to maximally exclude the MAPK activation derived from endogenous Mst1, then phosphorylation of various MAPKs was examined after TRAIL treatment (Fig. 7A). As shown in Figure 7A, depending on the cleavage size of Mst1 after TRAIL treatment, each MAPK was differentially activated. To confirm that MAPKs activation depends on Mst1 cleavage site, we designed several deletion mutants of Myc-tagged Mst1 (1–349 amino acids of Myc-Mst1, 1–349 amino acids with D326N of Myc-Mst1, and 1–326 amino acids of Myc-Mst1). After transfection to Mst1-knockdown selected cell clone (#6), phosphorylation of the three MAPKs was examined. Figure 7B shows that JNK and p38 were more activated in the cells expressing 40 kDa of Mst1, whereas ERK was more activated in the cells expressing 36 kDa of Mst1 during TRAIL treatment. However, Figure 7B also shows that the appearance of cleaved forms of Mst1 was not sufficient to induce MAPKs activation, which suggests that another factor is necessarily involved for the full activation accompanying cleaved Mst1 during TRAIL treatment. Taken together, these experiments have shown that the cleaved size of Mst1 selects the MAPK to be activated.
Figure 7. Differential MAPKs regulation by Mst1 cleavage size in DU-145.
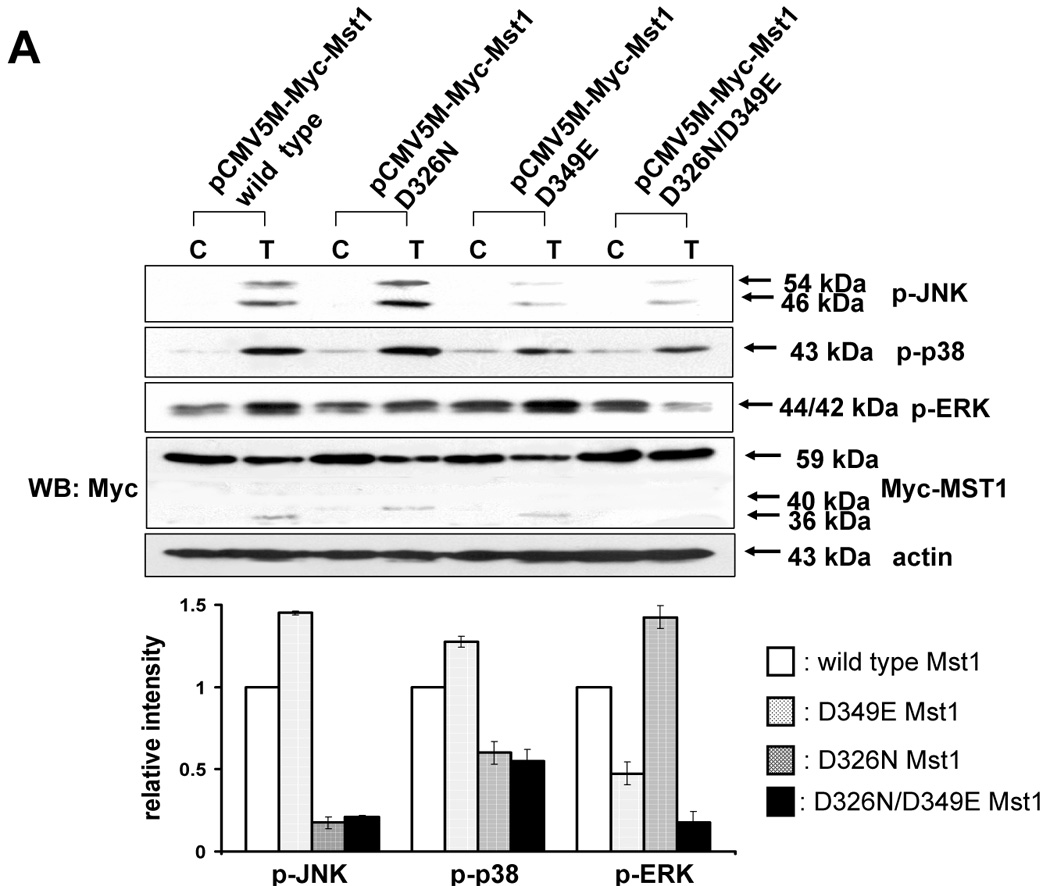
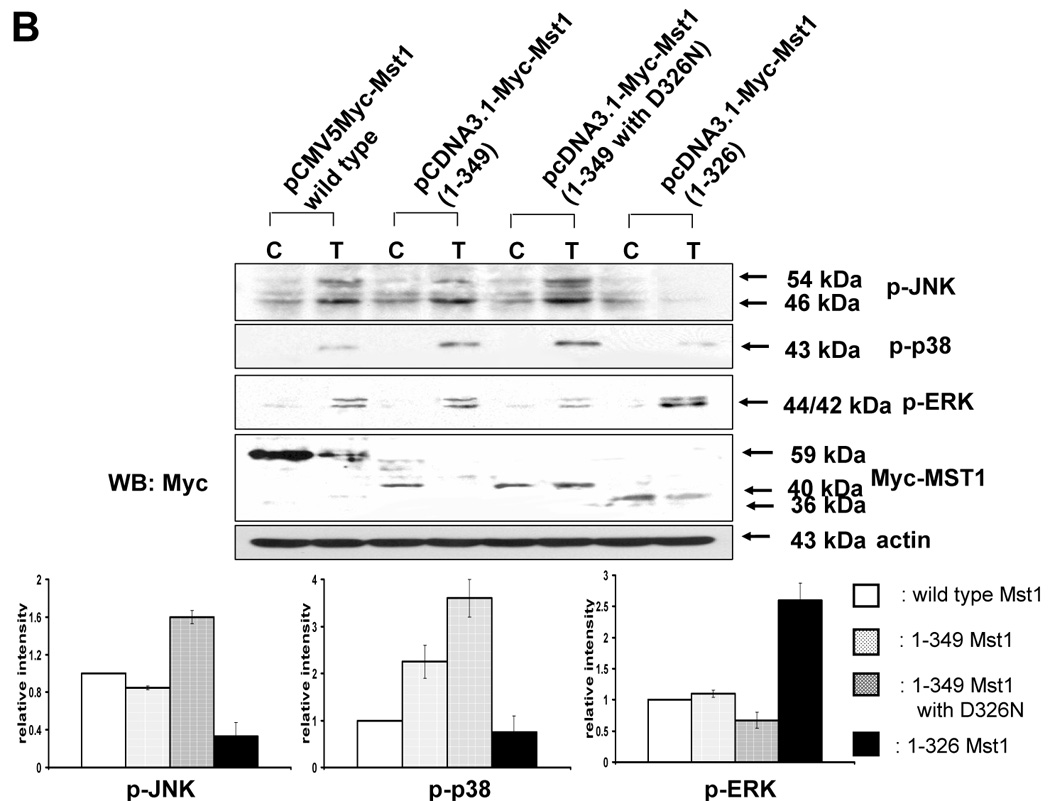
(A) MAPKs phosphorylation was examined after transfection of various mutants of Mst1 in which D326, D349, and both D326 and D349 were mutated. Each construct was transfected into Mst1-knockdown selected cell clone (#6), then after 48 h of transfection, phosphorylation of various MAPKs was examined after the cells were treated with TRAIL (200 ng/ml, 4 h). Upper panel: Western blot analysis, C, control; T, TRAIL. Lower panel: The ratio of the phosphorylated MAPKs to corresponding actin in TRAIL-treated cells was set equal to 1 in wild-type, and the ratio of the phosphorylated MAPKs to corresponding actin in TRAIL-treated cells with different Mst1 deletions was compared to this. Data are expressed as mean ± SE of the densitometry data from three independent experiments. (B) After construction of several deletion mutants of Myc-tagged Mst1 (Myc-tagged 1–349 amino acids of Mst1, Myc-tagged 1–349 amino acids with D326N of Mst1, and Myc-tagged 1–326 amino acids of Mst1), each deletion mutant was transfected into Mst1-knockdown selected cell clone (#6). After 48 h of transfection, phosphorylation of various MAPKs was examined after the cells were treated with TRAIL (200 ng/ml, 4 h). Upper panel: Western blot analysis, C, control; T, TRAIL. Lower panel: The ratio of the phosphorylated MAPKs to corresponding actin in TRAIL-treated cells in wild-type was set equal to 1, and the ratio of the phosphorylated MAPKs to corresponding actin in TRAIL-treated cells with different Myc-tagged Mst1 deletions was compared to this. Note the difference in vertical scale of the three sub-panels. Data are expressed as mean ± SE of the densitometry data from three independent experiments.
3.6. Mst1 can be seen as a mediator between TRAIL-induced caspase activation and MAPK activation
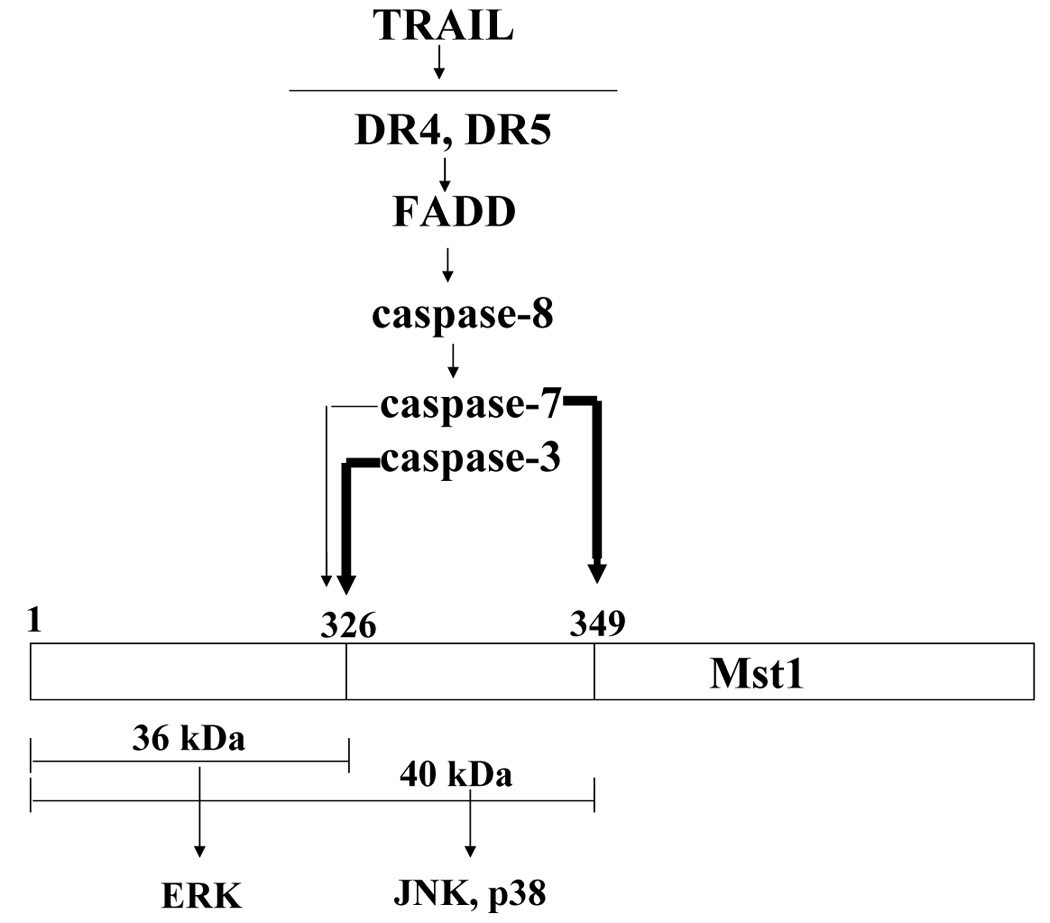
Our experimental data are summarized in Figure 8. From our studies, it was revealed that Mst1 is a key mediator between TRAIL-induced caspase activation and TRAIL-induced MAPKs activation. After cleavage by caspases, Mst1 phosphorylates MAPKs: the 40 kDa of Mst1 cleaved by caspase-7 selectively phosphorylates JNK and p38, while 36 kDa of Mst1 cleaved by mainly caspase-3 selectively phosphorylates ERK.
Figure 8. Schematic diagram of Mst1 as a mediator between TRAIL-induced caspase activation and MAPK activation.
4. Discussion
Contradictory to previous reports that ROS generation was the main cause of apoptosis through caspase activation during TRAIL treatment [25, 26], we could not observe either the meaningful generation of ROS (Figs. 2A and 2B) or the inhibition of apoptosis by catalase overexpression (Fig. 2C). This discrepancy suggests that there is not enough ROS generation to activate caspases and MAPKs during TRAIL treatment, at least in DU-145 cells. In agreement with this line of reasoning, Varfolomeev et al. [17] proposed that caspase-8 was regarded to be important not only for apoptosis induction but also for MAPK kinase pathway activation by TRAIL. It seems to be that MAPK activation induced by TRAIL is not dependent on ROS but dependent on caspase-8 activation. Our results strengthen the implication that MAPKs phosphorylation during TRAIL treatment is dependent on caspase activation (Fig. 3–Fig. 5). However, the molecular mechanism by which TRAIL induces MAPK activation through caspase-8 has not been completely understood, while MAPK activation induced by ROS generation is relatively well known even though it seems not to be a factor in TRAIL treatment. In this study, we demonstrate that Mst1 plays an essential role as a mediator between caspase activation and MAPK phosphorylation during TRAIL treatment. Mst1 has been reported, in response to a wide variety of apoptotic stimuli, to be a prominent stimulator during apoptosis [27], playing an important role as a caspase effector that contributes to apoptosis. Mst1 has also been shown to act upstream of MAPK kinase kinase (MAPKKK) that regulates p38 and JNK activities, acting as a putative MAPK kinase kinase kinase (MAPKKKK) [19], thus, functioning in a positive feedback pathway that amplifies the apoptotic response through MAPK activation. However, the biological significance of MAPK activation has been emphasized for only its apoptotic effects, in spite of being known to have anti-apoptotic effects as well. Figures 6A, 6C, and 6D confirmed that Mst1 acted downstream of caspase-8 and upstream of MAPKs activation during TRAIL treatment. The differential activation of MAPKs during TRAIL treatment was clearly observed in caspase-3-deficient MCF-7 and caspase-3 overexpressed MCF-7 cells. Caspase-7 selectively activated JNK and p38 through 40 kDa cleaved forms of Mst1, while caspase-3 selectively activated ERK through 36 kDa cleaved forms of Mst1. However, as shown in Figure 7B, TRAIL treatment enhanced the ability of Mst1 deletion mutants to phosphorylate MAPKs, which strengthens the previous report [23] that both caspase cleavage and phosphorylation contributed to the activation of Mst1. These results raise the question of whether Mst1 is phosphorylated prior to the Mst1 cleavage during TRAIL treatment. Glantschnig et al [28] suggested that Mst1 activation is induced by existing, active Mst kinase which phosphorylates Mst1. In this case, however, it is difficult to interpret how TRAIL-induced caspase activation initiates phosphorylation of Mst1 via preexisting active Mst1 kinase. As an alternative, Praskova et al. [29] found that Mst1 was activated by an intramolecular autophosphorylation catalyzed within an activation loop of Mst dimer, and NORE and RASSF1A which are bound to Mst1 suppressed this process. Therefore, we are currently investigating the possibility that TRAIL-induced caspase activation can cleave NORE and/or RASSF1A, resulting in dissociation from Mst1, which can induce Mst1 autophosphorylation followed by Mst1 cleavage. Another important question is how cleaved forms of Mst1 can activate MAPKs differentially. Mst1 was shown to act upstream of MAPK kinases that regulate MAPK, functioning as MAPKKKK, upstream of MEKK1 [23]. Currently, we also observed that among MAP3K, MEKK1 and MEKK4 were related to MAPKs activation during TRAIL treatment (data not shown). We are examining the possibility of differential phosphorylations of the MEKK family by cleaved forms of Mst1, which will result in selective recruitment of MEKK downstream cascades.
Although, from our experiment, Mst1 is revealed as a mediator between caspase activation and MAPKs activation, the outcome of MAPKs activation is not yet clear. It appears that the JNK pathway functions in a cell-type and stimulus-dependent manner and its different components can sometimes play opposing roles in apoptosis. The observation that the JNK pathway can be either pro-apoptotic or anti-apoptotic suggests that JNK is likely to act as a modulator, rather than as an intrinsic component of the apoptotic machinery [30–32]. In the case of p38, the role of p38 in the regulation of cell survival and apoptosis is also controversial. Taken together, these findings suggest that it is the context in which the MAPK signal is generated, as well as the magnitude and duration of the signal, that determines the biological effect on a cell. Varfolomeev et al. [17] suggested that kinase pathway activation by TRAIL which includes JNK and p38 was associated with increased production of the chemokines interleukin-8 (IL-8) and monocyte chemotactic proteins-1 (MCP-1) and with enhanced macrophage migration. Interestingly, it has been reported that MCP-1 in addition to IL-6 or -8 was upregulated in prostate cancer metastasis [4], which suggests that MAPK activation during TRAIL treatment may function in several ways. Based on our previous report [33], we believe that Mst1 is responsible for acquired TRAIL resistance, and even metastasis, by functioning as a mediator between TRAIL-induced caspase activation and MAPK activation, and this possibility is under investigation.
Abbreviations
- EGFP
enhanced green fluorescence protein
- PAGE
polyacrylamide gel electrophoresis
- PARP
poly (ADP-ribose) polymerase
- PBS
phosphate-buffered saline
- SDS
sodium dodecyl sulfate
- si
small interference
Footnotes
This work was supported by the following grants: NCI grant funds (CA95191, CA96989 and CA121395), DOD prostate program funds (PC020530 and PC040833), Susan G. Komen Breast Cancer Foundation fund (BCTR60306), and Samuel & Emma Winters Foundation.
Publisher's Disclaimer: This is a PDF file of an unedited manuscript that has been accepted for publication. As a service to our customers we are providing this early version of the manuscript. The manuscript will undergo copyediting, typesetting, and review of the resulting proof before it is published in its final citable form. Please note that during the production process errors may be discovered which could affect the content, and all legal disclaimers that apply to the journal pertain.
References
- 1.Pitti RM, Marsters SA, Ruppert S, Donahue CJ, Moore A, Ashkenazi A. J. Biol. Chem. 1996;271:12687. doi: 10.1074/jbc.271.22.12687. [DOI] [PubMed] [Google Scholar]
- 2.Degli-Esposti MA, Smolak PJ, Walczak H, Waugh J, Huang CP, DuBose RF, Goodwin RG, Smith CA. J. Exp. Med. 1997a;186:1165. doi: 10.1084/jem.186.7.1165. [DOI] [PMC free article] [PubMed] [Google Scholar]
- 3.Degli-Esposti MA, Dougall WC, Smolak PJ, Waugh JY, Smith CA, Goodwin RG. Immunity. 1997b;7:813. doi: 10.1016/s1074-7613(00)80399-4. [DOI] [PubMed] [Google Scholar]
- 4.Lu Y, Cai Z, Xiao G, Keller ET, Mizokami A, Yao Z, Roodman GD, Zhang J. Cancer Res. 2007;67:3646. doi: 10.1158/0008-5472.CAN-06-1210. [DOI] [PubMed] [Google Scholar]
- 5.Pan G, Ni J, Wei YF, Yu G, Gentz R, Dixit VM. Science. 1997a;277:815. doi: 10.1126/science.277.5327.815. [DOI] [PubMed] [Google Scholar]
- 6.Pan G, O'Rourke K, Chinnaiyan AM, Gentz R, Ebner R, Ni J, Dixit VM. Science. 1997b;276:111. doi: 10.1126/science.276.5309.111. [DOI] [PubMed] [Google Scholar]
- 7.Sheridan JP, Marsters SA, Pitti RM, Gurney A, Skubatch M, Baldwin D, Ramakrishnan L, Gray CL, Baker K, Wood WI, Goddard AD, Godowski P, Ashkenazi A. Science. 1997;277:818. doi: 10.1126/science.277.5327.818. [DOI] [PubMed] [Google Scholar]
- 8.Walczak H, Degli-Esposti MA, Johnson RS, Smolak PJ, Waugh JY, Boiani N, Timour MS, Gerhart MJ, Schooley KA, Smith CA, Goodwin RG, Rauch CT. EMBO J. 1997;16:5386. doi: 10.1093/emboj/16.17.5386. [DOI] [PMC free article] [PubMed] [Google Scholar]
- 9.Lee HW, Lee SH, Lee HW, Ryu YW, Kwon MH, Kim YS. Biochem. Biophys. Res. Commun. 2005;330:1205. doi: 10.1016/j.bbrc.2005.03.101. [DOI] [PubMed] [Google Scholar]
- 10.Huang CY, Wu YM, Hsu CY, Lee WS, Lai MD, Lu TJ, Huang CL, Leu TH, Shih HM, Fang HI, Robinson DR, Kung HJ, Yuan CJ. J. Biol. Chem. 2002;277:34367. doi: 10.1074/jbc.M202468200. [DOI] [PubMed] [Google Scholar]
- 11.Thomas LR, Henson A, Reed JC, Salsbury FR, Thorburn A. J. Biol. Chem. 2004;279:32780. doi: 10.1074/jbc.M401680200. [DOI] [PubMed] [Google Scholar]
- 12.Bodmer JL, Holler N, Reynard S, Vinciguerra P, Schneider P, Juo P, Blenis J, Tschopp J. Nat. Cell Biol. 2000;2:241. doi: 10.1038/35008667. [DOI] [PubMed] [Google Scholar]
- 13.Cohen GM. Biochem. J. 1997;326:1. doi: 10.1042/bj3260001. [DOI] [PMC free article] [PubMed] [Google Scholar]
- 14.Li P, Nijhawan D, Budihardjo I, Srinivasula SM, Ahmad M, Alnermri ES, Wang X. Cell. 1997;91:479. doi: 10.1016/s0092-8674(00)80434-1. [DOI] [PubMed] [Google Scholar]
- 15.Slee EA, Harte MT, Kluck RM, Wolf BB, Casiano CA, Newmeyer DD, Wang HG, Reed JC, Nicholson DW, Alnemri ES, Green DR, Martin SJ. J. Cell Biol. 1999;144:281. doi: 10.1083/jcb.144.2.281. [DOI] [PMC free article] [PubMed] [Google Scholar]
- 16.Almasan A, Ashkenazi A. Cytokine & Growth Factor Rev. 2003;14:337. doi: 10.1016/s1359-6101(03)00029-7. [DOI] [PubMed] [Google Scholar]
- 17.Varfolomeev E, Maecker H, Sharp D, Lawrence D, Renz M, Vucic D, Ashkenazi A. J. Biol. Chem. 2005;280:40599. doi: 10.1074/jbc.M509560200. [DOI] [PubMed] [Google Scholar]
- 18.Krebs E, Graves JD. Advan, Enzyme Regul. 2000;40:441. doi: 10.1016/s0065-2571(99)00030-8. [DOI] [PubMed] [Google Scholar]
- 19.de Souza PM, Lindsay MA. Biochem. Soc. Trans. 2004;32:485. doi: 10.1042/BST0320485. [DOI] [PubMed] [Google Scholar]
- 20.Creasy CL, Chernoff J. J. Biol. Chem. 1995a;270:21695. doi: 10.1074/jbc.270.37.21695. [DOI] [PubMed] [Google Scholar]
- 21.Creasy CL, Chernoff J. Gene. 1995b;167:303. doi: 10.1016/0378-1119(95)00653-2. [DOI] [PubMed] [Google Scholar]
- 22.Dan I, Watanabe NM, Kusumi A. Trends Cell Biol. 2001;11:220. doi: 10.1016/s0962-8924(01)01980-8. [DOI] [PubMed] [Google Scholar]
- 23.Graves JD, Draves KE, Gotoh Y, Krebs EG, Clark EA. J. Biol. Chem. 2001;276:14909. doi: 10.1074/jbc.M010905200. [DOI] [PubMed] [Google Scholar]
- 24.Lee KK, Ohyama T, Yajima N, Tsubuki S, Yonehara S. J. Biol. Chem. 2001;276:19276. doi: 10.1074/jbc.M005109200. [DOI] [PubMed] [Google Scholar]
- 25.Lee MW, Park SC, Kim JH, Kim IK, Han KS, Kim KY, Lee WB, Jung YK, Kim SS. Cancer Lett. 2002;182:75. doi: 10.1016/s0304-3835(02)00074-5. [DOI] [PubMed] [Google Scholar]
- 26.Perez-Cruz I, Cárcamo JM, Golde DW. Apoptosis. 2007;12:225. doi: 10.1007/s10495-006-0475-0. [DOI] [PubMed] [Google Scholar]
- 27.Ura S, Masuyama N, Graves JD, Gotoh Y. Genes Cells. 2001;6:519. doi: 10.1046/j.1365-2443.2001.00439.x. [DOI] [PubMed] [Google Scholar]
- 28.Glantschnig H, Rodan GA, Reszka AA. J. Biol. Chem. 2002;277:42987. doi: 10.1074/jbc.M208538200. [DOI] [PubMed] [Google Scholar]
- 29.Praskova M, Khoklatchev A, Ortiz-Vega S, Avruch J. Biochem. J. 2004;381:453. doi: 10.1042/BJ20040025. [DOI] [PMC free article] [PubMed] [Google Scholar]
- 30.Lin A, Dibling B. Aging Cell. 2002;1:112. doi: 10.1046/j.1474-9728.2002.00014.x. [DOI] [PubMed] [Google Scholar]
- 31.Liu J, Lin A. Cell Res. 2005;15:36. doi: 10.1038/sj.cr.7290262. [DOI] [PubMed] [Google Scholar]
- 32.Vlahopoulos S, Zoumpourlis VC. Biochemistry. 2004;69:844. doi: 10.1023/b:biry.0000040215.02460.45. [DOI] [PubMed] [Google Scholar]
- 33.Song JJ, An JY, Kwon YY, Lee YJ. J. Biol. Chem. 2007;282:319. doi: 10.1074/jbc.M608065200. [DOI] [PubMed] [Google Scholar]


