

Abstract
During the entry process many icosahedral viruses must adopt a lower-order symmetry or incur a symmetry mismatch to release their genome through a single site. A membrane model system in which poliovirus was bound to receptor-decorated liposomes was used to pioneer techniques that studied the break in the symmetry of the initial attachment complex by cryo-electron microscopy. Novel methods involving a fiducial marker for the membrane contact point were developed to objectively determine the symmetry of this complex and provide a starting model to initiate a bootstrap orientation refinement. Here we analyze how errors in the subjective assignment of this position affect the determination of symmetry, and the accuracy of calculating Euler angles for each raw image. In this study we have optimized the method and applied it to study the membrane-attachment complex of Semliki Forest virus (SFV), a model system for enveloped virus fusion. The resulting reconstruction of the SFV-membrane complex with a fiducial provides the first experimental evidence that this pre-fusion cell entry intermediate approaches the membrane along the viral 5fold axis. The analysis reported here, and its subsequent application to enveloped virus fusion, indicate that this is a robust tool for solving the structures of mixed-symmetry complexes.
Keywords: cryo-electron microscopy, non-enveloped virus, enveloped virus, three-dimensional electron microscopy, virus cell entry, image processing, mixed symmetry, unknown symmetry
Introduction
Icosahedral reconstructions of virus particles have provided an important tool for studying viral life cycles (Baker et al., 1999). Cryo-electron microscopy has been used to study the structures of virions (Crowther, 1970) as well as intermediate particles in assembly (Conway et al., 2001; Lata et al., 2000; Wikoff et al., 2006) and uncoating (Belnap et al., 2000a; Bubeck et al., 2005a). The 60-fold averaging that occurs during an icosahedrally symmetric reconstruction has permitted high-resolution structures to be obtained from relatively few particles (Chiu et al., 2005; Saban et al., 2005). However, along with the strengthening of icosahedrally symmetric components through averaging, comes a loss of information about non-icosahedral features.
The largest non-icosahedral feature of a virus is its genome. If the viral capsid remains intact during assembly or infection, DNA or RNA must be packaged or extruded through a single opening, possibly at a vertex. The higher-order symmetry of a virus can be disrupted by this symmetry mismatch on one of its vertices. In several tailed bacteriophages, a portal protein located at a single vertex is involved in genome translocation (Bohm et al., 2001; Cerritelli et al., 2003; Fokine et al., 2005; Jiang et al., 2006; Morais et al., 2001; Tao et al., 1998).
Such symmetry mismatches have been addressed using a variety of approaches. In the case of many tailed phages, the break in icosahedral symmetry occurs with the portal proteins. To generate the lower-symmetry reference for these viruses, preliminary models often assumed 5fold symmetry. For epsilon 15 bacteriophage, the initial reference was generated by cylindrically averaging a 2D image, extracting the tail, and grafting it on to an icosahedral reconstruction of the reference model at the 5fold (Jiang et al., 2006). For bacteriophage phiKZ, portal proteins were simulated as a cylinder of constant density and similarly grafted (Fokine et al., 2005). For other viruses, where the asymmetric feature is less pronounced, icosahedral features of the virus have been used to locate non-icosahedral components by assuming they lay on certain vertices (Briggs et al., 2005) or objectively determining that they coincide with a given vertex (Cerritelli et al., 2003). The asymmetric density can then be characterized using traditional single-particle analysis after subtracting the contribution from the icosahedral virus. To visualize viral features that are flexible as well as non-icosahedral, cryo-electron tomography has been used to study translocation of the T5 phage genome into proteoliposomes through a tail portal protein (Bohm et al., 2001), though the resolution was limited. Visualizing the cell entry mechanisms of viruses in the context of a membrane is inherently challenging not only because of the complexity of the sample preparation and low contrast between the membrane and transmembrane proteins, but also because of the difficulties experienced in orienting the 2D images of mixed or unknown symmetry. To overcome these challenges, a novel method that uses fiducial markers as proxies for the membrane-contact points was developed to solve the structure of the poliovirus-receptor-liposome complex, the first step in virus cell entry (Bubeck et al., 2005b). At the time, questions were posed about whether the approach was generally applicable, how robust it was, and whether the manual placement of fiducials required any particular expertise. The current study is an in-depth analysis of the potential errors introduced by this technique and how they affect the angular assignment of 2D images. The method, now optimized, has been applied to Semliki Forest virus (SFV) to investigate the initial steps in enveloped virus fusion.
Viruses can be classified into two major groups based on the presence or absence of a viral membrane. The two viruses chosen for this study, poliovirus and SFV, are excellent model systems for exploring the cell entry mechanisms of each class. The icosahedral structures of their native conformations have been well characterized. Poliovirus has a single stranded RNA genome enclosed by an icosahdral viral capsid consisting of 3 proteins: VP1, VP2, VP3 and VP4 (Hogle et al. 1985; Belnap et al., 2000a). SFV, also an RNA virus, has an icosahedral nucleocapid composed of protein C enveloped by a lipid bilayer. Transmembrane glycoproteins E1 and E2 penetrate the viral membrane and form heterodimeric lobes on trimeric spikes that cover the viral surface (Fuller et al., 1995; Mancini et al., 2000).
In both cases, the biochemistry of their cell entry mechanisms can be resolved into discrete steps. The attachment of poliovirus to its cell surface receptor (PVR) initiates cell entry. At physiological temperature, receptor binding acts as a catalyst for an irreversible conformational change to the expanded 135S particle (Joklik and Darnell, 1961). This process has been reproduced in an in vitro liposome model system described in Bubeck et al (2005b) and Tuthill et al (2006). In this system, solubly expressed poliovirus receptor that is tethered to NTA-containing liposomes via its C-terminal (membrane proximal) His tag binds to native virus. The complex is stable at room temperature (as in the EM studies), but can successfully convert to entry intermediates at physiological temperature (Tuthill et al., 2006). For SFV, fusion is mediated by the exposure of the E1 fusion peptide (Gibbons et al., 2004), followed by low pH triggered-dissociation of E2 and insertion of the E1 monomer into the membrane (Glomb-Reinmund and Kielian, 1998; Liao and Kielian 2006). Subsequently, the E1 protein undergoes a conformational change that leads to the formation of E1 homotrimers and fusion of the host and viral membranes (Gibbons et al., 2004; Liao and Kielian, 2006). This process is highly dependent on the presence of cholesterol and sphingomyelin in the host membrane and can occur in a liposome model system in the absence of receptor when the pH is below 6 (White and Helenius, 1980). The structures of soluble forms of SFV at low pH have provided some insights into viral fusion (Fuller et al., 1995; Paredes et al., 2004; Wu et al., 2006), but lack the context of a membrane and average out nonicosahedral features.
This report presents an optimized method for determining the orientation of complexes of mixed or unknown symmetry based on an in-depth analysis of the error and potential bias introduced when using post-imaging fiducial markers. We have now 1) calculated the error introduced by manually placing dots; 2) assessed how errors in dot placement, and in the intensity of the dot, affect the determination of symmetry and the calculation of a dot-based preliminary model; 3) applied this optimized procedure to determine the attachment symmetry of a pre-fusion SFV-membrane complex, thus providing the first experimental evidence demonstrating that SFV binds to membranes along its 5fold axis.
Materials and Methods
Sample preparation
Poliovirus
The type 1 Mahoney strain of poliovirus was propagated in HeLa cells and purified on a CsCl gradient (Yeates et al., 1991). The extracellular region (residues 1–337) of Poliovirus receptor (sPVR) was expressed with a C-terminal (membrane proximal) His tag and purified as described previously (McDermott et al., 2000). 100µm liposomes containing phosphatidylethanolamine, phosphatidylcholine, sphingomyelin, cholesterol and phosphatidic acid in molar ratios of 1:1:1:1.5:0.3 with 10% (w/w) DOGS-NTA and 1% (w/w) rhodamine-PE were formed by extrusion as reported by Bubeck et al. (2005b) and Tuthill et al. (2006). 50µl of 1mg/ml liposomes were incubated with 0.03µg of sPVR for 10 minutes before adding 16.5µg of native poliovirus. Complexes were formed at room temperature to ensure that virus remained in its native conformation. Samples were loaded onto Quantifoil® holey carbon grids (SPI) that were glow discharged, and flash frozen in liquid ethane (Dubochet et al., 1988).
SFV
SFV was grown in baby hamster kidney 21 cells and purified by sedimentation through a discontinuous sucrose gradient as described previously (Fuller, 1987). 100µm liposomes containing phosphatidylethanolamine, sphingomyelin, and cholesterol in molar ratios of 1:1:3 (Gibbons et al., 2003; Gibbons et al., 2004) were rehydrated in 150mM NaCl, 20mM Tris (pH 7) and formed by extrusion as described above. 30µl of 1.25mg/ml liposomes were incubated with 4µg of native SFV at pH 7 to enable attachment without fusion. Samples were applied to Quantifoil® holey carbon grids that were coated in a thin layer of carbon and glow discharged, before plunge freezing in liquid ethane.
Image acquisition and processing
Poliovirus
Images were recorded at a magnification of 50,000 and defocus range of −2 to −4 µm on an FEI Tecnai F20 microscope. 10 micrographs were digitized using a SCAI scanner (Z/I Imaging) at a step size of 7 µm (2.8 Å per pixel after binning by 2). 139 images were windowed at 251×251 pixels with X3D (Conway and Steven, 1999) and corrected for the phase reversal of the CTF using SUMPS, CTFZEROS, and CTFMIX (Conway and Steven, 1999).
SFV
Images were recorded at a magnification of 39,000 and defocus range of −4 to −6.5 µm on an FEI Tecnai F30 microscope. 98 micrographs were digitized using a SCAI scanner at a step size 7 and binned by 2 (3.6 Å per pixel). 390 images were windowed at 261×261 pixels using BSHOW (Heymann, 2001). A subset of these was used for the icosahedral dotted reconstructions.
All image manipulations described in later steps for both viruses were done using the BSOFT (Heymann, 2001) software package. Orientations were determined using a version of the Polar Fourier Transform method (Baker and Cheng, 1996), PFT2, that was modified to include both phase and amplitude information. Reconstructions were calculated with a Fourier-Bessel algorithm using the program EM3DR2 (Crowther et al., 1970; Fuller et al., 1996) and rendered in CHIMERA (Pettersen, et al., 2004).
Adding spots to 2D images
Intensities of 2D images were scaled to a 0-to-255 range. A spot with a radius of 4 pixels and an intensity value between 100 and 20,000 was then added to the image at the point of the membrane closest to the virus. Initial experiments (i.e., the original, previously reported structure determination) assessed the membrane contact position visually and the X-Y coordinates were recorded using X3D (Conway and Steven, 1999) or BSHOW (Heymann, 2001). In later experiments (including the present analysis of errors) the “correct” position of the membrane contact point was calculated by making the assumption that the final Eulerian angles θ and ψ from the published poliovirus-receptor-liposome complex (Bubeck et al., 2005b) were correct. In certain experiments (see below), random Gaussian errors with a particular variance were calculated by the Box-Muller procedure (Box and Muller, 1958), and were added to these expected X-Y coordinates before spotting.
Determining the symmetry of the poliovirus-receptor-liposome complex
A cryo-EM reconstruction of native poliovirus (Belnap et al., 2000a) was used to orient 2D images in an icosahedrally symmetric reference frame. Orientation searches were done in PFT2 by projection matching, within resolution limits of 1000-25 Å. To maximize the influence of the icosahedrally symmetric viral components, only radial ranges between 105–161 Å from the virus center were searched. Parameter refinement was run in two stages. In the first round, image centers were identified by cross-correlation with a rotationally averaged reference projection. In the second stage, those centers were refined and angular information was obtained from projection matching. In the angular searches, 300 orientations were tested per particle using both amplitude and phase information.
2D images were then prepared in which a dot with an intensity of 20,000, representing the position of the membrane contact point, was placed on the image, as described above. These dotted images were incorporated into 3D reconstructions with EM3DR2, using icosahedral orientations obtained from the undotted versions of the same images.
To identify the extra 3D density due to dots, and to assess its statistical significance, density from the dotted reconstruction was integrated within a series of small sliding windows, along various radial vectors. Vectors of particular interest were the 5fold, 2fold, and 3fold axes (where noise tends to accumulate in symmetry-averaging calculations, and where some of the higher density values were actually seen), and along the quasi-3fold direction (a more general position that is roughly equidistant from the symmetry axes). Along each vector, successive rectangular boxes with dimensions of 7×11×7 pixels were masked from the 3D reconstructions using MAPMASK in CCP4 (Collaborative Computational Project, 1994); the average intensity within each box was calculated; and the resulting series of values was plotted in GNUPLOT (Thomas and Kelley, 1991).
Creating fivefold-symmetric reference models
Bubeck et al (2005b) found that 3D dot density for poliovirus had accumulated preferentially along each viral 5fold axis, with the density peak at 221Å radius. That dotted reconstruction was rotated around the virus center to bring one of the 5fold axes to be coincident with the Z-axis. 3D dot density was sampled from this unique axis by multiplying by a spherical mask that appeared large enough to enclose the observed dot. The mask was 28 Å in radius, and centered on the point along Z that was located 221Å (84 pixels) from the virus center. Density from the native virus reconstruction (Belnap et al., 2000a) was sampled by multiplying by a spherical mask that was slightly larger than the virus (168 Å in radius), and oriented in the same way. Various linear combinations of these two maps could then be used as 3D reference models for orientation searches in PFT2, operated in 5fold-symmetric (C5) mode.
Orientation Searches using dotted images and reference models
A 3D reference consisting of native virus and a single spot was used to determine orientation parameters for 2D spotted images, assuming C5 symmetry in PFT2. For each image, virus centers were initially derived from the icosahedral orientation search, but were further refined here. Angular orientations were determined de novo. Orientation searches by projection matching were carried out for resolution ranges between 1000 and 25 Å. As in the icosahedral reconstruction, the inner radial limit for cross correlation excluded pixels less than 80 Å from the center of the virus, where non-symmetric RNA dominates; but the outer radial limit was extended to 242 Å to include the membrane. In normal operation, PFT2 generates candidate orientations in an inexpensive way (ignoring one of the three orientation angles) and checks some number of the best-scoring possibilities in a much more expensive way, using a "phased" residual. As recommended (PFT2 tutorial, D. Belnap), we tested a smaller number of possibilities (30 orientations per particle) early on, and an increased number (100 or more orientations) as refinement converged. We speculate that our need to run such large numbers of phased trials may be related to the relative lack of surface relief in poliovirus, as compared with other viruses on which PFT2 has been tested.
Determining the symmetry and initial reconstruction of the SFV-membrane complex
Broadly, the same procedure was followed for SFV to generate both the icosahedral-dotted reconstruction and initial reconstruction with membrane density. Spots with an intensity value of 500 were added to the membrane-contact positions of scaled raw images. The cryo-EM reconstruction of native SFV (Mancini et al., 2000) was used to orient unmodified 2D images using a radial range between 169 and 340 Å from the virus center. Angular searches testing 100 orientations per particle using both phase and amplitude information were performed. These orientations were then applied to the corresponding dotted 2D images to calculate a 3D reconstruction. The reconstruction was multiplied by one mask (340 Å radius) to extract the virus and by a second mask to extract a single 3D dot located 373Å from the virus center. The ratio of the density values was 1:10 respectively. The resulting lower-order-symmetry reference model was used to determine orientations for dotted 2D images using a radial range between 169 and 450 Å. These angles were applied to the original unmodified 2D images to calculate 3D reconstruction of the SFV-membrane complex.
Assessing the accuracy of PFT2-based orientation information
In the C5-symmetric mode of PFT2, the Eulerian angles θ and ψ together specify the direction of the unique 5fold axis. To provide a visual read-out of these angles, with which to compare the dot placement in the 2D images, a dotted 3D model (or simply an isolated dot on the Z axis at 221 Å radius, for the poliovirus-membrane complex) was rotated by these angles using BINT (BSOFT), and projected onto the X-Y plane with BPROJECT (BSOFT). BFILTER (BSOFT) was used to apply a temperature factor to the projected spot image, ensuring that its brightest point was the spot center.
In practice (due to software problems that have since been corrected), it was not always possible to calculate the X-Y coordinate of a spot reliably from its Euler angles. As a practical work-around, we chose instead to use PEAKPICK (Collaborative Computational Project, 1994) to identify the X-Y coordinate of each density maximum, and to use shell-script-based ASCII text string manipulations to generate its input maps, and to extract the needed information from log files.
In C5 symmetry mode, the Eulerian angle, ϕ, corresponds to the rotation of the model around its unique 5fold axis. To assess the accuracy of the ϕ determination, calculated ϕ values were compared to the reference ϕ angles, by evaluating the cosine of five times the ϕ difference. As the absolute ϕ differences range between 0° (minimum) and 36° (maximum), the cosine statistic ranges between 1 and −1. This is simply a convenient way to assess the accuracy of PFT2 results, taking into account the periodicity of the Eulerian angle.
Results
An overview of the technique
The current study details the implementation of post-imaging fiducial markers in 1) objectively determining the lower-order symmetry of a complex containing icosahedral features and 2) the use of these fiducials in obtaining an initial reference with which to initiate a bootstrap orientation refinement. The procedure (as summarized in Figure 1) begins by visually identifying the approximate location of some symmetry-breaking feature in the 2D images, such as a membrane-contact point, and marking that location with a high intensity dot. An icosahedral virus reconstruction is used as a reference to determine the orientations of the virus component of the complex in the original unmodified images. The resulting Euler angles are applied to 2D dotted images to compute an icosahedral 3D reconstruction with dots. That step objectively determines what lower symmetry, if any, is characteristic of the symmetry-broken complex. Next, the icosahedral virus and a single 3D dot are combined to create a reference image, which is used to estimate the Eulerian angles of the dotted 2D images in the context of the lower-symmetry group. These orientations are then applied to original unmodified images to produce a preliminary lower-order-symmetric reconstruction free from dots. Subsequently more images are added and the refinement procedure is iterated until convergence.
Figure 1.
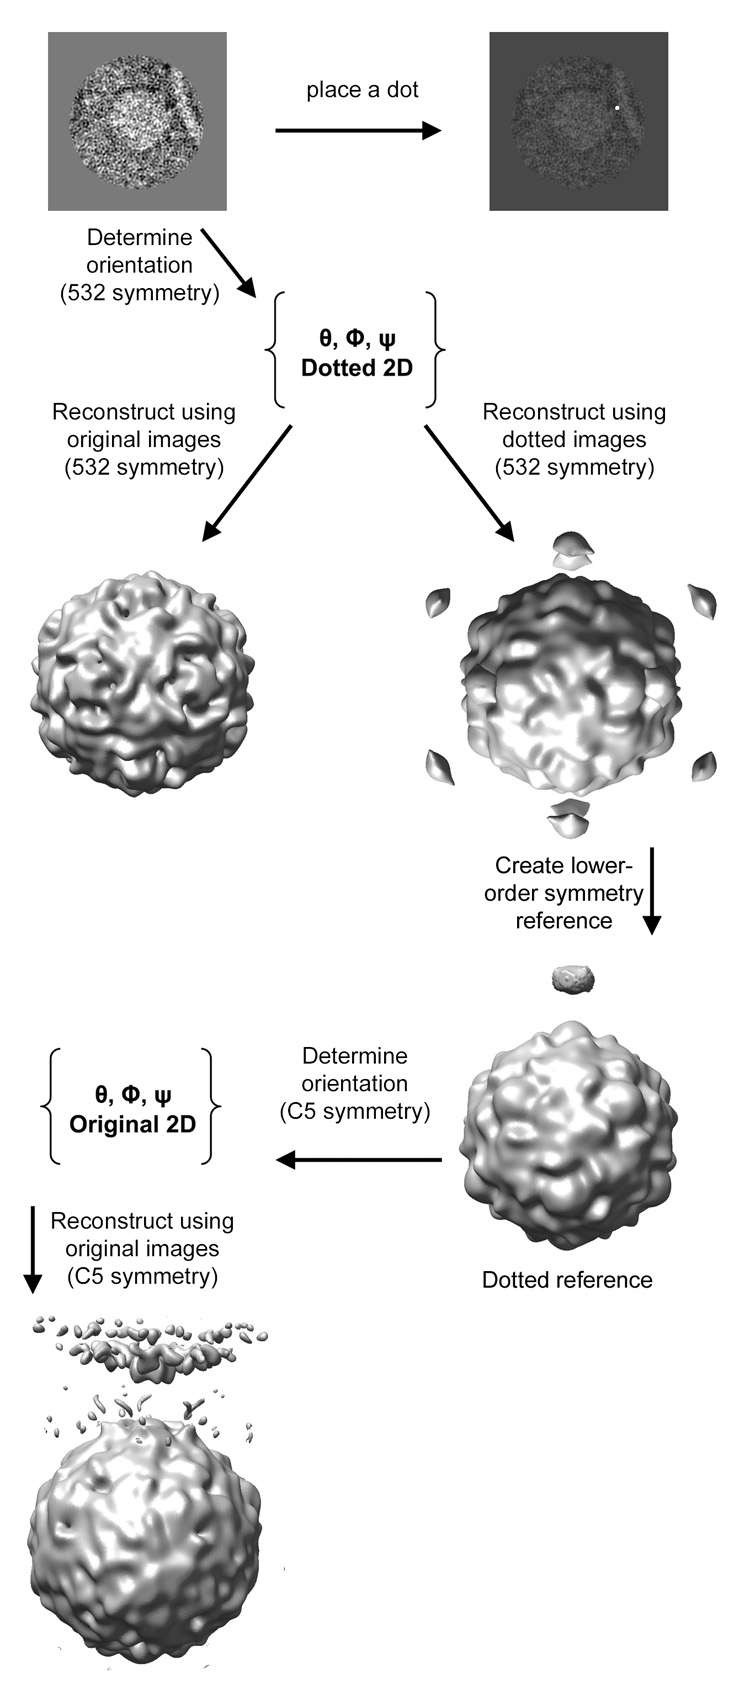
Schematic outlining the use of post-imaging fiducial markers for determining the lower-order symmetry of a complex, and for generating an initial reference to be used in further refinement.
Tolerance for error in the 2D dot placement
Visual identification of the lower-order symmetry component of the complex is prone to error. To assess the effects of mis-spotting the 2D images, random Gaussian error was added to the optimal X-Y coordinate of the contact position, as determined for the poliovirus case (Bubeck et al., 200b; Figure 2b) and reconstructions were re-calculated from the mis-spotted images (Figure 3b). In each experiment, the level of RMS error in the population of images was specified, and then checked to ensure that the amount of coordinate variation was as expected (data not shown). Plots of intensities along the symmetry axes demonstrate that even with as much as 10 pixels error applied to the spot position (where the virus is approximately 114 pixels in diameter), the peak above the viral 5fold is still significantly above background (Figure 3e), and clearly discernable in a three-dimensional view (Figure 3b). However, at RMS error levels of 45 pixels (about 40 percent of the virus diameter), no signal was detectable from dots (Figure 3f). This analysis demonstrates the method is surprisingly robust and could easily tolerate errors of about 10% of the virus size.
Figure 2.
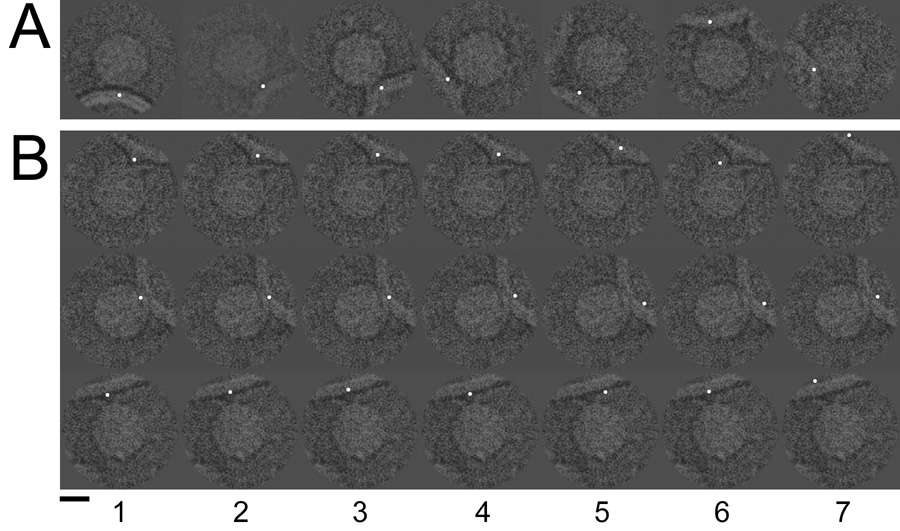
Cryo-electron microscope images of poliovirus-receptor-liposome complexes were artificially dotted to indicate the membrane contact point. The coordinate of this contact could be identified visually (A) as well as be defined by the final Eulerian angles reported for each image by Bubeck et al. 2005 (B, column 1). Column 2 illustrates the addition of random Gaussian error with an RMSD of 5 pixels. Columns 3–7 show error levels of 10, 20, 30, 40, and 50 RMSD. Scale bar, 150 Å.
Figure 3.
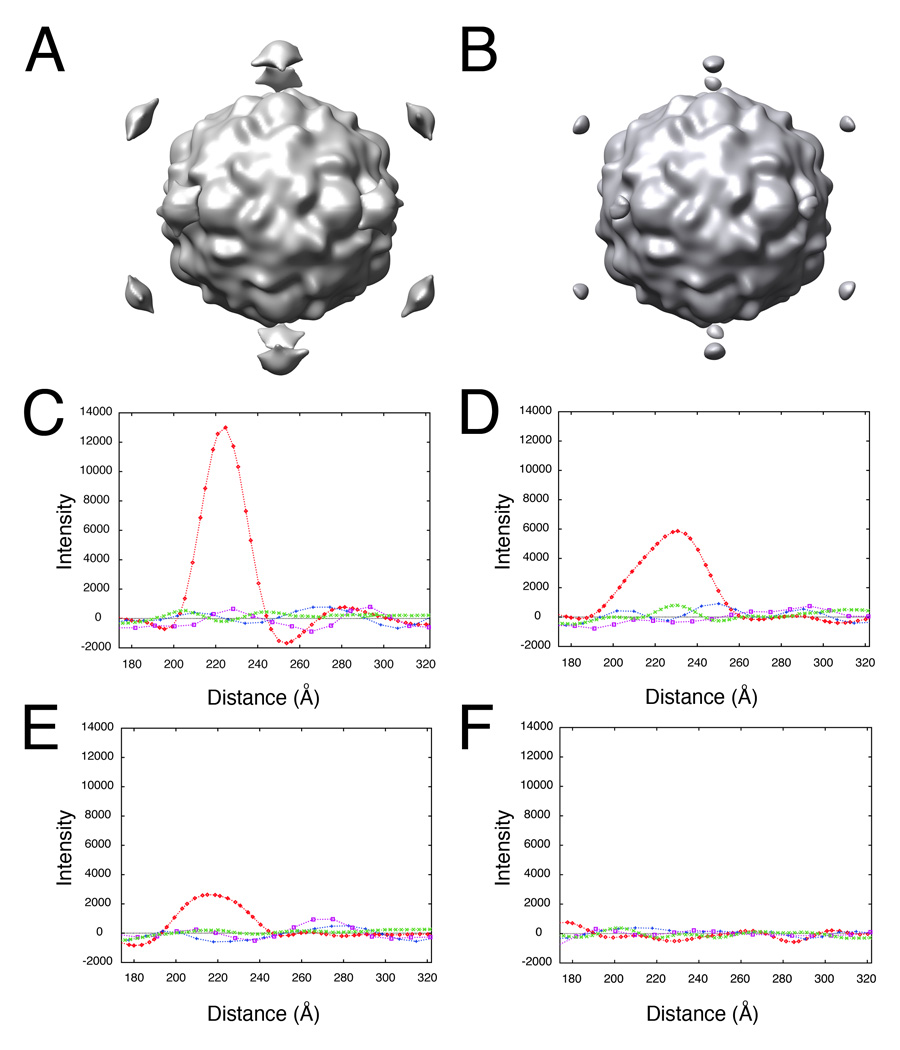
Determining the lower-order symmetry of the virus-receptor-liposome complex is a robust procedure that tolerates high levels of error in 2D spot placement. Random Gaussian error of 0 (A, C), 5 (D), 10 (B, E), and 45 (F) pixels deviation from the true membrane contact point were applied to the 2D spot coordinates of raw images. Icosahedral orientations for unspotted images, obtained using native virus as a reference, were used to compute 3D icosahedral reconstructions from these dotted 2D images (A, B). (C–F) Intensities in each reconstruction were sampled along the 5fold (red diamonds), 2fold (blue plusses), 3fold (purple squares), and quasi-3fold (green crosses) symmetry axes. Elevated density appearing approximately 220 Å from the center of the virus along a 5fold axis is evident, even with a 10 pixel (20.7 Å) RMS error in dot placement.
By comparing manually placed spots used in Bubeck et al (2005b) (Figure 2a) with the corresponding reference positions (Figure 2b), we were able to assess the error in visual assignment of membrane contact positions. The total RMS difference of 12 pixels projected roughly equally onto the 2D vector between the virus and the membrane (8 pixels RMSD), and the vector tangent to the membrane (7 pixels RMSD). The 5fold orientation of the particle was unambiguous, and the method succeeded, identifying the symmetry of the complex (Figure 3), even though no particular skill was shown in putting dots in exactly the right places.
Orientation determination using a dotted reference model
In order to produce an optimized and more robust method, we were interested in understanding what factors affect the accuracy of the orientation procedure using dots. Accuracy of the Eulerian angles could be analyzed by considering separately the (two) parameters that control the direction of the unique 5fold axis, and the (one) parameter that controls the orientation of the model around the 5fold.
Increasing levels of Gaussian error were added to the correct spot positions of raw 2D images. Orientations for these images were determined in a 5fold symmetric frame-of-reference using a dotted-virus model. The resulting Eulerian angles θ and ψ corresponded to the direction of the unique 5fold axis in three dimensions, and completely defined the position of a projected 3D dot. For each image, the reference was rotated by these two angles and projected in 2D. The X and Y coordinates of the resulting ‘output’ spot were compared with reference positions derived from the 30Å virus-receptor-liposome reconstruction (Bubeck et al., 2005b). As increasing levels of error were added to the 'input' spot positions, the 'output' positions progressively worsened (Figure 4), indicating a poorer orientation determination.
Figure 4.

Error in 2D spot placement affects the accuracy of orientation determination. A 5fold-symmetric reference consisting of native virus and a single 3D dot was used to orient 2D images in which various levels of error were applied to the spot coordinates. The reference dot was rotated according to the resulting Eulerian angles, projected in 2D, and its Cartesian coordinates were compared with the true dot position for each image. The RMS coordinate difference is reported in pixels for error levels of 0, 5, 10, 15, 20, 25, 30, 35, 40, 45, 50, and 99.9 pixels. The leftmost column (M0) refers to dots placed manually in Bubeck et al (2005b). Orientation accuracy for all dotted images is reported in panel A. Images were classified according to the distance from the center of the virus to the spot position (B). Grey bars represent distances more than 76.9 pixels radius, while white bars illustrate those less than 76.9 pixels. Manual spot placement was more accurate for high-radius particles where density for receptor molecules was more often visible.
The nearly linear relationship between (deliberate) error in spot placement and the resulting error in Euler angle assignment, seen in Figure 4, gives us a metric that we can use to estimate how accurate the manual dot placement was in Bubeck et al (2005b). Here, we are trying to get an indication of how tolerant the procedure is of operator error, and of how great a level of accuracy is required to get successful results. In practice, we discovered that the manually placed spots were mis-positioned by approximately 10 pixels (RMS average) in each direction (Figure 4a). This distance is about half the thickness of the membrane, on average, and seems like a fairly substantial error. Nevertheless, the impact of errors of this size on symmetry-based orientation refinements in PFT2 would be minimal. Thus, given that the 3D spot is located ~82 pixels from the virus center, we would expect the angular error (in either θ or ψ) to be approximately the arctangent of 10/82, or 7°. As it turns out, 7° is fairly small, compared to the angular separation between the major surface features of the poliovirion. In overview, the outer surface of the poliovirus capsid is largely accounted for by the presence of outward projections centered around each of the 5fold and 3fold axes, and surface depressions between these peaks (see Figure 1). By comparison, the distance between neighboring icosahedral threefold axes is much larger, about 42°; and the distance from 3fold to 5fold axis is about 38°. At the observed level of dot misplacement error, we expect the major surface features of the virus to be easily resolvable from one another during orientation refinement, and the resulting Euler angles to be well within the radius of convergence of the reconstruction procedure.
Accuracy of the orientation determination as a function of dot placement
One limitation of the dot method is that estimating the membrane contact point visually becomes more difficult when the liposome contact lies above or below the plane of the projection. (Indeed, particles whose contacts lie nearly along the beam direction cannot be dotted at all.) To demonstrate this, images were grouped based on the length of the vector from the particle center to the contact position. As expected, manually placed dots were more accurate in images whose vector was greater than 76.7 pixels (Figure 4b, M0). For liposomes that are approached from the side, the visible edge of the liposome is a more reliable guide to the location of the contact point than when the edge of the membrane lies over the virus. Moreover, in the edge-on case, receptor molecules may be visible to help identify the contact point.
Unexpectedly, though, the addition of random Gaussian error had more of a detrimental effect on long-vector dots than on short-vector dots, even though the same absolute size of added error would represent a larger angular offset at lower radius (Figure 4b). We suspect that the explanation for this anomaly may be related to the fact that the dot intensities in this particular experiment were not optimized for orientation-determining purposes (see below), and, indeed, were much too strong.
Accuracy of the orientation determination as a function of dot intensity
The intensity of the dot relative to the virus in both 2D images and the 3D reference affects the weight given to the icosahedral signal versus the unique 5fold during the orientation search. To assess how variations in these relative intensities affect the accuracy of ϕ, the calculated ϕ was compared with that determined for each image in the final reconstruction reported in Bubeck et al (2005b). Error was expressed in terms of the cosine of five times the actual ϕ error. This statistic can vary between 1, for perfectly correlated values, and −1, representing anti-correlated values, where 0 is random.
The relative intensities of the dot and virus in the initial orientation search using dotted images in Bubeck et al (2005b) were not optimal. On a scale where the densities in the 2D images varied from 0–255, the value for the 2D dot was set to 1000; and that for the 3D dot was 48 times the average intensity of the native virus. At those intensity levels, the ϕ statistic (i.e., the cosine of 5 times the ϕ error) was only 0.2 (Figure 5a, column 6). Reducing the intensity of the 3D dot by a factor of 5–10 improved the ϕ determination markedly, to 0.45, and had only a minimal impact on the accuracy of θ and ψ, although further decreases were detrimental to both statistics. The optimal intensity for the 2D dot was 400–450 (Figure 5b), where ϕ statistics as high as 0.54 were seen. Dot intensities higher than this range had little effect on the accuracy of θ and ψ, but caused the determination of ϕ to gradually worsen (Figure 5b). Lower values for 2D spot intensity resulted in a dramatic decrease in the reliability of all three Euler angles. For example, when the 2D spot intensity was reduced to 300, and then to 200 (levels marginally higher and lower than the brightest pixels in the unmodified image), then the average dot-placement errors increased to 28 and 65 pixels, respectively. (These represent errors in the placement of the fivefold axis of ~19° and 38°, which would be large, relative to the dimensions of the unique icosahedral area, see above.)
Figure 5.

Accuracy of the Eulerian angle ϕ (the rotation about the unique 5fold) depends on the balance of intensities between 2D and 3D spots. A dotted reference was used to orient 2D dotted images. The resulting ϕ was compared with the final value for ϕ determined for each image by Bubeck et al (2005b), and reported as the cosine of five times the ϕ error: +1 represents correlated angles, −1 are anti-correlated angles, and 0 is random. A) Spotted 2D images (intensity 1000) were oriented using a spotted 3D reference in which the intensity of the spot was 3, 5, 10, 15, 30, 48, 100, and 200 times that of the virus. B) An optimized 3D reference in which the intensity of the spot was either 8 (black bars) or 10 (hatched bars) was used to orient 2D images with various spot intensities: 100, 150, 200, 300, 400, 500, 750, 1000, 1250, 1500, 3000, or 10000. These data show that a balance is required: the dot intensity must be strong enough, relative to the virus, to drive the angular assignment towards the unique 5fold; but weak enough that the icosahedral signal from the virus can dominate the determination of ϕ.
Use of dots in particle selection
After determining orientation parameters, a key step in obtaining an accurate map is the selection of particles to be included in the reconstruction. In addition to evaluating particles based on their correlation with model projections, post-imaging fiducial markers provided a mechanism with which to assess the assignment of the unique 5fold in 2D images. Specifically, a 3D model consisting only of a dot could be oriented according to the Eulerian angles for each image and projected. Particles would be included in the reconstruction if the projected spot fell within the vicinity of a liposome edge in the 2D image. In the final reconstruction (Bubeck et al 2005b), this criterion selected against an additional 15% of the images over the 15% had already been excluded based on a cross-correlation threshold.
How accurate a preliminary reconstruction was possible?
After achieving an optimal balance between the intensities of the image and the 2D and 3D spots, the Eulerian angles resulting from projection matching were applied to unmodified (un-dotted) images to calculate a 3D reconstruction of a poliovirus-receptor-membrane complex (Figure 6a). In this map, density for the membrane and virus are clearly defined and, at a low contour level, hints of receptor density begin to protrude from the virus. In contrast, the preliminary reconstruction used in Bubeck et al (2005b) (Figure 6b) was essentially featureless, lacked obvious density for receptors, and was distorted along the viral 5fold axis.
Figure 6.
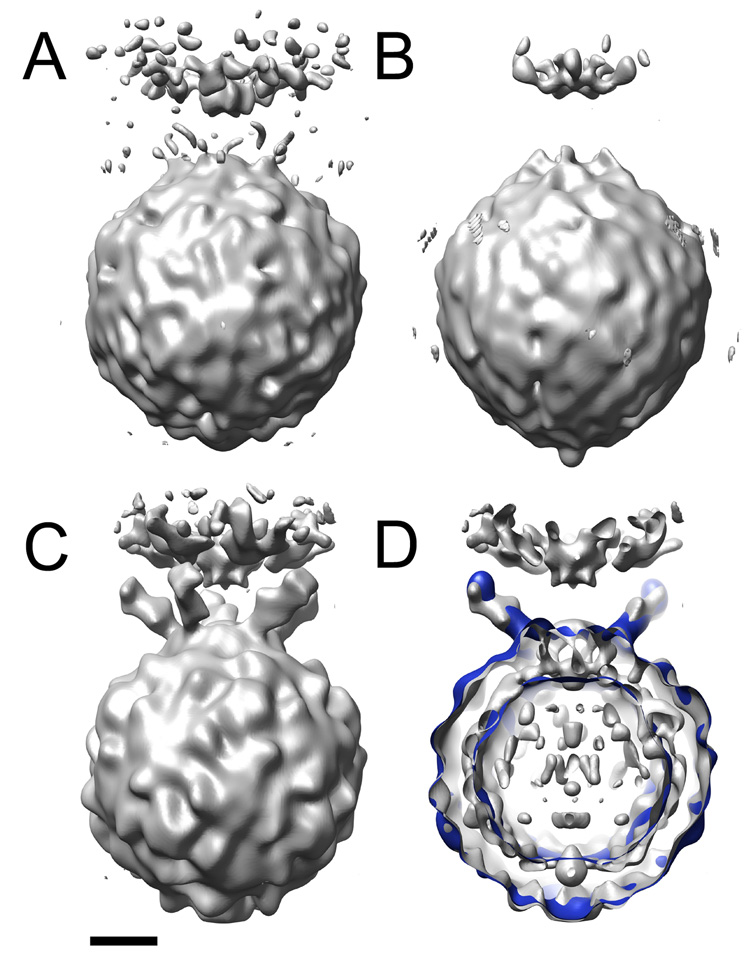
3D reconstructions of the poliovirus-receptor-liposome complex. Optimized 2D and 3D spot intensities were used to derive Eulerian angles for dotted images. These orientations were applied to undotted images to calculate an initial model of the virus-receptor-liposome complex (A). (B) is the original preliminary model, before intensity optimization. (C) and (D) show the final reconstruction from Bubeck et al., 2005 (grey). (D) is a slabbed view the final reconstruction (grey) overlaid with model-based electron density calculated from pseudo atomic models fitted by Belnap et al. (2000b) (blue). Similar to the final reconstruction (C), the preliminary model resulting from optimized intensities (A) contains strong density for the membrane, including the perturbation that protrudes towards the viral 5fold. In addition, its viral features are similar those found in the final reconstruction. In contrast, the virus in the unoptimized reconstruction (B) appears less well defined and is distorted along the 5fold. Scale bar, 75 Å.
Despite the low resolution of the first reconstruction, this method proved highly successful in initiating an iterative bootstrap angular refinement of a (~10-fold) larger dataset of unmodified images. The final reconstruction reported by Bubeck et al (2005b) (Figure 6c) confirmed the icosahedral symmetry of the virus, although only 5fold symmetry was imposed. It contained strong density for membrane and receptor, including evidence for known glycosylation sites. Density for receptors in the membrane complex coincided with the observed location of receptors in the cryo-EM solution structure of virus fully decorated with receptor (Belnap et al., 2000b) (Figure 6d). This independent confirmation of the final structure offers clear evidence for the accuracy of the result, and validates the use of post-imaging fiducial markers in single-particle reconstruction techniques.
Application to SFV
The method using post-imaging fiducial markers, as optimized in this study, was applied to investigate the membrane interactions of a pre-fusion SFV complex. Native virus was incubated with liposomes containing cholesterol and sphingomyelin. The pH of the mixture was kept at 7 to prevent trimerization of E1 and subsequent membrane fusion. The membrane contact point was assessed visually in each 2D image, and represented by a dot (Figure 7a). An icosahedral reconstruction (Figure 7b), based on undotted 2D images of the virus and liposome mixture, closely resembled the published cryo-EM reconstructions of native SFV (Fuller et al., 1995; Mancini et al., 2000). This demonstrated that the virus population was sufficiently homogeneous and largely icosahedral in nature. The same Euler angles were then applied to the 2D dotted images of SFV-liposome complexes (Figure 7a). Ten percent of the particles were excluded based on a cross-correlation threshold, and the remainder were used to compute an icosahedral dotted 3D reconstruction. This map showed a ring of density spots that encircled the 5fold axis, located above each of the E1/E2 spikes at 373Å radius from the center of the virus (Figure 7c). The density distribution corresponding to the 3D spots in the SFV-membrane complex is more disperse than that observed in the case of poliovirus. Two possible explanations for this observation are 1) SFV may be attached to membranes in more than one orientation and 2) perhaps not all of the SFV particles in close proximity to liposomes are actually making contact. In an attempt to address this issue, only complexes that could be visually confirmed to be making a direct contact with the membrane were included (Figure 7a, right two panels). Using only this 20% of the total population, we produced a reconstruction in which the ring above the 5fold axis was clearly more pronounced (Figure 7d). Although post-fusion E1 homotrimers have previously been found to associate in liposomes into 5- and 6-membered rings (Gibbons et al., 2003), our reconstruction represents the first experimental evidence that the pre-fusion state of SFV can initiate the attachment to the membrane along its 5fold axis. Subsequently, by implementing the 5fold orientation search using optimized dot densities, as determined in the poliovirus test-case, we were able to generate a preliminary reconstruction, showing the interaction of SFV with membranes in what is presumably a transient pre-fusion complex (Figure 7e). In this structure, density for the membrane is clearly resolved, and there is evidence for the presence of local symmetry axes on the viral surface (albeit imperfect ones) that were not enforced in the calculation, when 5fold-symmetry was imposed along an axis perpendicular to the membrane. Note that the reconstruction at this preliminary stage is comparable in quality to the initial reconstruction of the poliovirus-receptor-liposome complex (Figure 6a), which incorporated a similar number of particles (about 100). This SFV structure will provide the foundation for further bootstrap orientation refinement.
Figure 7.
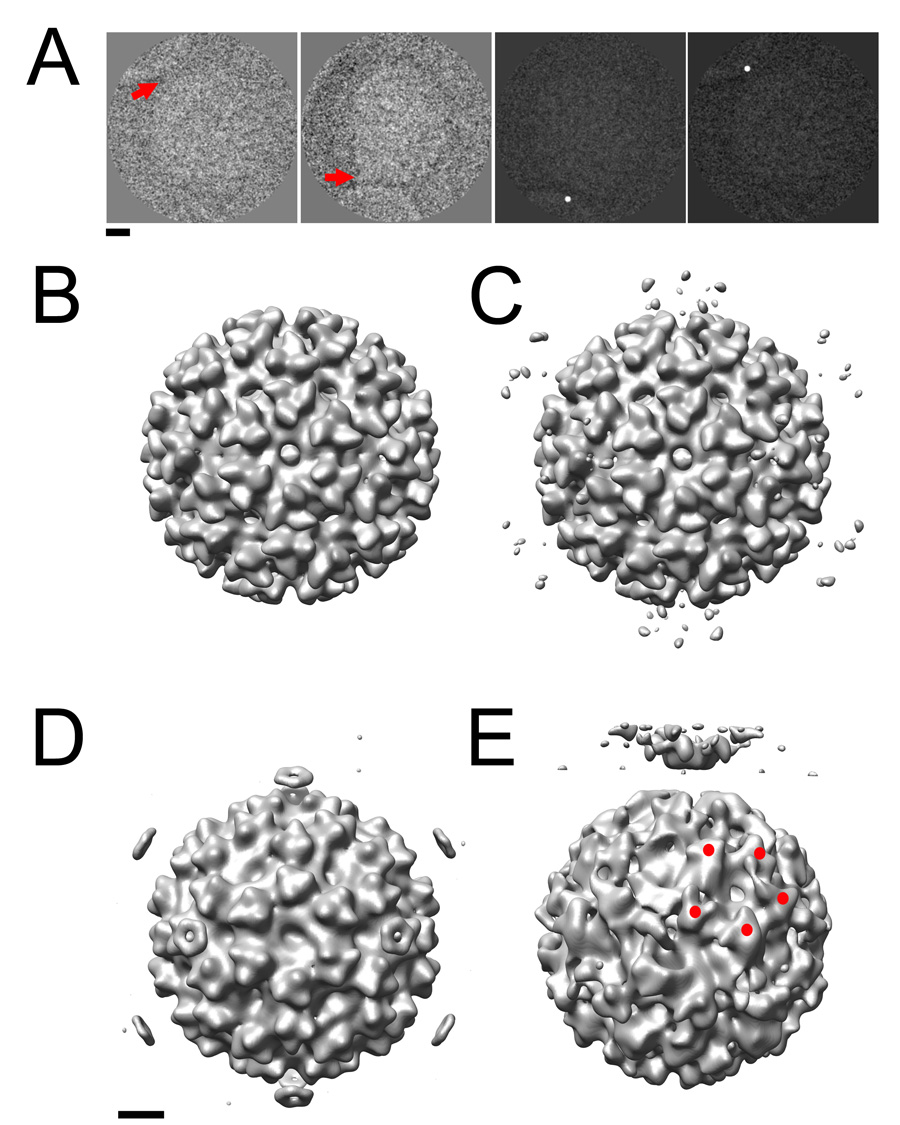
The post-imaging fiducial marker method was used to generate 3D reconstructions of SFV that provide the first experimental evidence that the virus initiates fusion along its 5fold axis. (A) The membrane contact point in the 2D images was identified (red arrows, left two panels) and artificially dotted (right two panels). (B) An icosahedral reconstruction calculated from unmodified images demonstrates that the viral component of the complex remains similar overall to the previously published structure that lacks membrane. (C) The corresponding reconstruction calculated from dotted images shows weak density features (black arrow) encircling the viral 5fold axes 373 Å from the center of the virus. (D). This density was enhanced (black arrow) when only those particles that were visually confirmed to be interacting with the membrane (A, right two panels) were included. (E) The optimized method successfully generated a preliminary 5fold-symmetric model of the SFV-liposome complex to be used in further bootstrap orientation refinement. Red spheres indicate the positions of 5 spikes on the viral surface that are related by an icosahedral symmetry operator that was not enforced in the reconstruction. Scale bars: 100 Å
Discussion
In cryo-EM studies of complexes with mixed or unknown symmetry, there is often an initial assumption about the symmetry mismatch (Briggs et al., 2005; Fokine et al., 2005; Jiang et al., 2006). In the case of poliovirus, the idea that RNA exits via the viral 5fold axis (Hogle, 2002; Kolatkar et al., 1999) was so widespread in the literature that one might even have mistaken the oft-repeated hypothesis for established fact. However, prior to our report of the poliovirus-receptor-liposome complex (Bubeck et al., 2005b), there was no experimental evidence supporting it. Here we present an in depth characterization of a novel method which uses post-imaging fiducial markers (dots) to objectively determine the symmetry of a complex and to estimate the initial orientations of 2D images, leading to a preliminary reconstruction in the bootstrap refinement. We have now implemented this optimized method to study the pre-fusion membrane-attachment complex of SFV, an enveloped virus. Historically there has been some uncertainty about where the symmetry break would occur. The crystal packing contacts for the post-fusion E1 homotrimer suggest a pentameric ring (Gibbons et al., 2004), while clusters of both 5 and 6 E1 homotrimers can associate in liposomes (Gibbons et al., 2003). In this study we provide the first experimental proof that SFV can initiate attachment to the membrane along its 5fold axis.
The poliovirus-receptor-liposome complex provided an excellent test case in which to develop these new methods. The structure of the virus had been solved previously by both cryo-EM (Belnap et al., 2000a) and x-ray crystallography (Hogle et al., 1985). In addition, there was structural information for the virus bound to 60 copies of a soluble version of its receptor (Belnap et al., 2000b; He et al., 2000; He et al., 2003; Xing et al., 2000). Atomic models of the virus and homology models of the receptor docked into the EM density (Belnap et al., 2000b) provided a useful control with which to compare our reconstructions of membrane-bound complexes (Figure 6).
Unlike tailed bacteriophages, which contain unambiguous density where they deviate from icosahedral symmetry, the lower symmetry features of many viruses are often subtle. An objective way to elucidate the symmetry break needs to be successful regardless of whether the point of structural change is clearly visible. In images of poliovirus-receptor-liposome complexes, receptors were often invisible, the membrane was variable in shape, and additional viruses and liposomes crowded single complexes. Added fiducials provided a way to up-weight the symmetry-breaking feature by specifying both a direction and a distance, without relying on weak or variable features, and without assuming the shape of other components in the complex. It also avoided the need to eliminate features by masking operations, which have the potential to create high-resolution edge artifacts.
Weighting the densities of fiducials, which serve as proxies for the lower-order symmetry component, needs to be carefully balanced with the weights of icosahedral features of the rest of the complex. As we have discovered, the choice of 2D and 3D dot intensities has a profound impact on the accuracy of the derived Eulerian angles (Figure 5). Correlation statistics, where 2D views are compared with projections of the model, simply favor making dots brighter. Fortunately, an analysis of the resolution of the reconstruction is a more objective way to assess the quality of the Eulerian parameters that are produced by projection matching.
The potential for model bias is also something that needs to be considered when using density-modified 2D images. For that reason, we took the precaution of adding dots to only a small subset (about 15 percent) of the available images, and eliminating them from the projection-matching calculations as soon as an un-dotted search model was available. In the spirit of cross-validation, 85 percent of the images used in the final reconstruction (Bubeck et al., 2005b) had never been modified in any way. Indeed, the after-the-fact analysis of the experiment (Figure 5 and Figure 6) leads us to believe that the preliminary model was far less accurate than what would have been possible if we had known what to look for. Ultimately, the validity of our methods was confirmed by the appearance of strong (and accurate) receptor and membrane density that was omitted from the models early in the reconstruction process.
Establishing the symmetry of the complex using density-modified 2D images was a robust procedure, tolerating large errors in the assignment of the membrane contact position (Figure 3). The analysis of the dots that were placed manually in Bubeck et al (2005b) demonstrates that error levels of 12 pixels RMSD (~10% of the virus diameter) (Figure 4) were still sufficient to confirm a 5fold approach (Figure 3). If necessary, the error level could have been further reduced by including a larger number of dotted particles. The number of manually dotted views actually used in the reconstruction (117) was quite modest (Bubeck et al., 2005b). The robustness of the manual dotting procedure, tested and confirmed for the poliovirus example, instilled confidence in the subsequent interpretation of weaker 3D spots observed in the SFV-membrane-spotted reconstruction.
Although this technique was pioneered for poliovirus, a nonenveloped virus, it was easily extended to study the enveloped SFV virus fusion intermediate. To ensure the successful implementation of the dot methodology, the icosahedral integrity of the virus needs to be preserved upon interaction with the membrane. For both poliovirus and SFV, the ability to calculate a reliable icoshedral reconstruction from masked particles provides an indicator that these criteria will be fulfilled. Although the method was developed using a complex that was highly stable and homogeneous, this does not appear to be absolutely required for the method to work. Only a fraction of SFV particles near liposomes at neutral pH are actually interacting. Nevertheless, information about the complex could be derived using post-imaging fiducial markers from as few as 20% of the total population.
In the future, the strategy of modeling unknown structures with fiducials may be improved in two important respects. First, broader and less sharply defined fiducials, which are more consistent with our approximate knowledge of the membrane contact, would lessen the impact of (spurious) higher-resolution Fourier comparisons on projection matching. Second, we can distance the fiducials from the features of interest to reduce the risk of biasing the biological interpretation of the results. For example, suppose that we had a set of 2D images, and a list of their corresponding membrane contact points, as defined above, each located at some radial coordinate (r, α), relative to its virus center. To prevent the artificial dots from appearing on top of interesting features in the 3D reconstruction, we could arbitrarily decide to place every dot in the list twice as far away, at (2r, α). Alternatively, we could keep the sample box at its original size by placing every dot precisely opposite from the contact point, at (r, α+π). Any similar uniform isotropic scaling of the dot coordinate set would work. Obviously, the mathematics of determining symmetry would remain the same (as the orientations of symmetry axes are independent of scale); and the mathematics of determining Euler angles would be unaffected, provided that the dot locations in dotted 3D reference maps were specified in an analogous way. In this scenario any density artifacts due to dots would be spatially separated, readily distinguished and easily removed from the biased reconstruction if desired. More importantly, doubts about whether features in the reconstruction were artifacts of the dotting process could be assuaged.
This study enhances our understanding of how to use post-imaging fiducial markers. It identifies the strength of this method as its ability to elucidate small, weak or conformationally variable components in cryo-EM images. It also alerts us to potential pitfalls such as model bias, balance between 2D and 3D spot intensities, and effects of positional error when using density-modified 2D images. The novel method provides a way to establish the lower symmetry of complexes in an unbiased way, and enables us to generate an initial search model for orienting images. The current application of this method to study SFV fusion has shed new light into the cell entry mechanism of this enveloped virus. We anticipate their growing use in the EM structure determination of biological complexes of mixed or unknown symmetry.
Acknowledgements
We thank S. Lanzavecchia, D. Belnap, M. Bostina, J. Forsdyke, and M. Kielian for discussions, SBgrid for maintaining the HMS Apple-cluster computing facilities, E.Y. Jones for access to computing facilities at the WTCHG, T. Walz for access to instruments in the HMS EM laboratory and Y. Cheng for instruction and assistance in their use. This work is supported by NIH grant AI020566-24 (to J.M.H) and Wellcome Trust grant H5RCYV0 (to S.D.F.). D.B is an EMBO long-term fellow, a CRI postdoctoral fellow, and a JRF at St. John’s College.
Footnotes
Publisher's Disclaimer: This is a PDF file of an unedited manuscript that has been accepted for publication. As a service to our customers we are providing this early version of the manuscript. The manuscript will undergo copyediting, typesetting, and review of the resulting proof before it is published in its final citable form. Please note that during the production process errors may be discovered which could affect the content, and all legal disclaimers that apply to the journal pertain.
References
- Agirrezabala X, Martin-Benito J, Caston JR, Miranda R, Valpuesta JM, Carrascosa JL. Maturation of phage T7 involves structural modification of both shell and inner core components. Embo J. 2005;24:3820–3829. doi: 10.1038/sj.emboj.7600840. [DOI] [PMC free article] [PubMed] [Google Scholar]
- Baker TS, Cheng RH. A model-based approach for determining orientations of biological macromolecules imaged by cryoelectron microscopy. J Struct Biol. 1996;116:120–130. doi: 10.1006/jsbi.1996.0020. [DOI] [PubMed] [Google Scholar]
- Baker TS, Olson NH, Fuller SD. Adding the third dimension to virus lifecycles: three-dimensional reconstruction of icosahedral viruses from cryo-electron micrographs. Microbiol Mol Bio Rev. 1999;63(1):237. doi: 10.1128/mmbr.63.4.862-922.1999. [DOI] [PMC free article] [PubMed] [Google Scholar]
- Belnap DM, Filman DJ, Trus BL, Cheng N, Booy FP, Conway JF, Curry S, Hiremath CN, Tsang SK, Steven AC, Hogle JM. Molecular tectonic model of virus structural transitions: the putative cell entry states of poliovirus. J Virol. 2000a;74:1342–1354. doi: 10.1128/jvi.74.3.1342-1354.2000. [DOI] [PMC free article] [PubMed] [Google Scholar]
- Belnap DM, McDermott BM, Jr, Filman DJ, Cheng N, Trus BL, Zuccola HJ, Racaniello VR, Hogle JM, Steven AC. Three-dimensional structure of poliovirus receptor bound to poliovirus. Proc Natl Acad Sci U S A. 2000b;97:73–78. doi: 10.1073/pnas.97.1.73. [DOI] [PMC free article] [PubMed] [Google Scholar]
- Bohm J, Lambert O, Frangakis AS, Letellier L, Baumeister W, Rigaud JL. FhuA-mediated phage genome transfer into liposomes: a cryo-electron tomography study. Curr Biol. 2001;11:1168–1175. doi: 10.1016/s0960-9822(01)00349-9. [DOI] [PubMed] [Google Scholar]
- Box G, Muller M. A Note on the Generation of Random Normal Deviates. Ann Math Stat. 1958;29:610–611. [Google Scholar]
- Briggs JA, Huiskonen JT, Fernando KV, Gilbert RJ, Scotti P, Butcher SJ, Fuller SD. Classification and three-dimensional reconstruction of unevenly distributed or symmetry mismatched features of icosahedral particles. J Struct Biol. 2005;150:332–339. doi: 10.1016/j.jsb.2005.03.009. [DOI] [PubMed] [Google Scholar]
- Bubeck D, Filman DJ, Cheng N, Steven AC, Hogle JM, Belnap DM. The structure of the poliovirus 135S cell entry intermediate at 10-angstrom resolution reveals the location of an externalized polypeptide that binds to membranes. J Virol. 2005a;79:7745–7755. doi: 10.1128/JVI.79.12.7745-7755.2005. [DOI] [PMC free article] [PubMed] [Google Scholar]
- Bubeck D, Filman DJ, Hogle JM. Cryo-electron microscopy reconstruction of a poliovirus-receptor-membrane complex. Nat Struct Mol Biol. 2005b;12:615–618. doi: 10.1038/nsmb955. [DOI] [PMC free article] [PubMed] [Google Scholar]
- Cerritelli ME, Trus BL, Smith CS, Cheng N, Conway JF, Steven AC. A second symmetry mismatch at the portal vertex of bacteriophage T7: 8-fold symmetry in the procapsid core. J Mol Biol. 2003;327:1–6. doi: 10.1016/s0022-2836(03)00117-7. [DOI] [PubMed] [Google Scholar]
- Chiu W, Baker ML, Jiang W, Dougherty M, Schmid MF. Electron cryomicroscopy of biological machines at subnanometer resolution. Structure. 2005;13:363–372. doi: 10.1016/j.str.2004.12.016. [DOI] [PubMed] [Google Scholar]
- Collaborative Computational Project, N. The CCP4 Suite: Programs for Protein Crystallography. Acta Cryst. 1994;D50:760–763. doi: 10.1107/S0907444994003112. [DOI] [PubMed] [Google Scholar]
- Conway JF, Steven AC. Methods for reconstructing density maps of "single" particles from cryoelectron micrographs to subnanometer resolution. J Struct Biol. 1999;128:106–118. doi: 10.1006/jsbi.1999.4168. [DOI] [PubMed] [Google Scholar]
- Conway JF, Wikoff WR, Cheng N, Duda RL, Hendrix RW, Johnson JE, Steven AC. Virus maturation involving large subunit rotations and local refolding. Science. 2001;292:744–748. doi: 10.1126/science.1058069. [DOI] [PubMed] [Google Scholar]
- Crowther RA, Amos LA, Finch JT, De Rosier DJ, Klug A. Three dimensional reconstructions of spherical viruses by fourier synthesis from electron micrographs. Nature. 1970;226:421–425. doi: 10.1038/226421a0. [DOI] [PubMed] [Google Scholar]
- Dubochet J, Adrian M, Chang JJ, Homo JC, Lepault J, McDowall AW, Schultz P. Cryo-electron microscopy of vitrified specimens. Q Rev Biophys. 1988;21:129–228. doi: 10.1017/s0033583500004297. [DOI] [PubMed] [Google Scholar]
- Fokine A, Kostyuchenko VA, Efimov AV, Kurochkina LP, Sykilinda NN, Robben J, Volckaert G, Hoenger A, Chipman PR, Battisti AJ, Rossmann MG, Mesyanzhinov VV. A three-dimensional cryo-electron microscopy structure of the bacteriophage phiKZ head. J Mol Biol. 2005;352:117–124. doi: 10.1016/j.jmb.2005.07.018. [DOI] [PubMed] [Google Scholar]
- Fuller SD. The T=4 envelope of Sindbis virus is organized by complementary interactions with a T=3 icosahedral capsid. Cell. 1987;48:923–934. doi: 10.1016/0092-8674(87)90701-x. [DOI] [PubMed] [Google Scholar]
- Fuller SD, Butcher SJ, Cheng RH, Baker TS. Three-dimensional reconstruction of icosahedral particles – The uncommon line. J Struct Biol. 1996;116:48–55. doi: 10.1006/jsbi.1996.0009. [DOI] [PubMed] [Google Scholar]
- Fuller SD, Berriman JA, Butcher SJ, Gowen BE. Low pH induces swiveling of the glycoprotein heterodimers in the Semliki Forest virus spike complex. Cell. 1995;81:715–725. doi: 10.1016/0092-8674(95)90533-2. [DOI] [PubMed] [Google Scholar]
- Gibbons DL, Erk I, Reilly B, Navaza J, Kielian M, Rey FA, Lepault J. Visualization of the target-membrane-inserted fusion protein of Semliki Forest virus by combined electron microscopy and crystallography. Cell. 2003;114:573–583. doi: 10.1016/s0092-8674(03)00683-4. [DOI] [PubMed] [Google Scholar]
- Gibbons DL, Ahn A, Liao M, Hammar L, Cheng RH, Kielian M. Multistep regulation of membrane insertion of the fusion peptide of Semliki Forest virus. J Virol. 2004;78:3312–3318. doi: 10.1128/JVI.78.7.3312-3318.2004. [DOI] [PMC free article] [PubMed] [Google Scholar]
- Glomb-Reinmund S, Kielian M. fus-1, A pH shift mutant of Semliki Forest virus, acts by altering spike subunit interactions via a mutation in the E2 subunit. J Virol. 1998;72:4281–4287. doi: 10.1128/jvi.72.5.4281-4287.1998. [DOI] [PMC free article] [PubMed] [Google Scholar]
- He Y, Bowman VD, Mueller S, Bator CM, Bella J, Peng X, Baker TS, Wimmer E, Kuhn RJ, Rossmann MG. Interaction of the poliovirus receptor with poliovirus. Proc Natl Acad Sci U S A. 2000;97:79–84. doi: 10.1073/pnas.97.1.79. [DOI] [PMC free article] [PubMed] [Google Scholar]
- He Y, Mueller S, Chipman PR, Bator CM, Peng X, Bowman VD, Mukhopadhyay S, Wimmer E, Kuhn RJ, Rossmann MG. Complexes of poliovirus serotypes with their common cellular receptor, CD155. J Virol. 2003;77:4827–4835. doi: 10.1128/JVI.77.8.4827-4835.2003. [DOI] [PMC free article] [PubMed] [Google Scholar]
- Heymann JB. Bsoft: image and molecular processing in electron microscopy. J Struct Biol. 2001;133:156–169. doi: 10.1006/jsbi.2001.4339. [DOI] [PubMed] [Google Scholar]
- Hogle JM. Poliovirus cell entry: common structural themes in viral cell entry pathways. Annu Rev Microbiol. 2002;56:677–702. doi: 10.1146/annurev.micro.56.012302.160757. [DOI] [PMC free article] [PubMed] [Google Scholar]
- Hogle JM, Chow M, Filman DJ. Three-dimensional structure of poliovirus at 2.9 A resolution. Science. 1985;229:1358–1365. doi: 10.1126/science.2994218. [DOI] [PubMed] [Google Scholar]
- Jiang W, Chang J, Jakana J, Weigele P, King J, Chiu W. Structure of epsilon15 bacteriophage reveals genome organization and DNA packaging/injection apparatus. Nature. 2006;439:612–616. doi: 10.1038/nature04487. [DOI] [PMC free article] [PubMed] [Google Scholar]
- Kolatkar PR, Bella J, Olson NH, Bator CM, Baker TS, Rossmann MG. Structural studies of two rhinovirus serotypes complexed with fragments of their cellular receptor. Embo J. 1999;18:6249–6259. doi: 10.1093/emboj/18.22.6249. [DOI] [PMC free article] [PubMed] [Google Scholar]
- Liao M, Kielian M. Site-directed antibodies against the stem region reveal low pH-induced conformational changes of the Semliki Forest virus fusion protein. J Virol. 2006;80:9599–9607. doi: 10.1128/JVI.01054-06. [DOI] [PMC free article] [PubMed] [Google Scholar]
- Lata R, Conway JF, Cheng N, Duda RL, Hendrix RW, Wikoff WR, Johnson JE, Tsuruta H, Steven AC. Maturation dynamics of a viral capsid: visualization of transitional intermediate states. Cell. 2000;100:253–263. doi: 10.1016/s0092-8674(00)81563-9. [DOI] [PubMed] [Google Scholar]
- McDermott BM, Jr, Rux AH, Eisenberg RJ, Cohen GH, Racaniello VR. Two distinct binding affinities of poliovirus for its cellular receptor. J Biol Chem. 2000;275:23089–23096. doi: 10.1074/jbc.M002146200. [DOI] [PubMed] [Google Scholar]
- Morais MC, Tao Y, Olson NH, Grimes S, Jardine PJ, Anderson DL, Baker TS, Rossmann MG. Cryoelectron-microscopy image reconstruction of symmetry mismatches in bacteriophage phi29. J Struct Biol. 2001;135:38–46. doi: 10.1006/jsbi.2001.4379. [DOI] [PMC free article] [PubMed] [Google Scholar]
- Paredes AM, Ferreira D, Horton M, Saad A, Tsuruta H, Johnston R, Klimstra W, Ryman K, Hernandez R, Chiu W, Brown DT. Conformational changes in Sindbis virions resulting from exposure to low pH and interactions with cells suggest that cell penetration may occur at the cell surface in the absence of membrane fusion. Virology. 2004;324:373–386. doi: 10.1016/j.virol.2004.03.046. [DOI] [PubMed] [Google Scholar]
- Pettersen EF, Goddard TD, Huang CC, Couch GS, Greenblatt DM, Meng EC, Ferrin TE. UCSF Chimera - A Visualization System for Exploratory Research and Analysis. J Compu Chem. 2004;25:1605–1612. doi: 10.1002/jcc.20084. [DOI] [PubMed] [Google Scholar]
- Saban SD, Nepomuceno RR, Gritton LD, Nemerow GR, Stewart PL. CryoEM structure at 9A resolution of an adenovirus vector targeted to hematopoietic cells. J Mol Biol. 2005;349:526–537. doi: 10.1016/j.jmb.2005.04.034. [DOI] [PubMed] [Google Scholar]
- Tao Y, Olson NH, Xu W, Anderson DL, Rossmann MG, Baker TS. Assembly of a tailed bacterial virus and its genome release studied in three dimensions. Cell. 1998;95:431–437. doi: 10.1016/s0092-8674(00)81773-0. [DOI] [PMC free article] [PubMed] [Google Scholar]
- Thomas W, Kelley C. GNUPLOT 3.0, An Interactive Plotting Program. 1991 [Google Scholar]
- Tuthill TJ, Bubeck D, Rowlands DJ, Hogle JM. Characterization of early steps in the poliovirus infection process: receptor-decorated liposomes induce conversion of the virus to membrane-anchored entry-intermediate particles. J Virol. 2006;80:172–180. doi: 10.1128/JVI.80.1.172-180.2006. [DOI] [PMC free article] [PubMed] [Google Scholar]
- White J, Helenius A. pH-dependent fusion between the Semliki Forest virus membrane and liposomes. Proc Natl Acad Sci. 1980;77:3273–3277. doi: 10.1073/pnas.77.6.3273. [DOI] [PMC free article] [PubMed] [Google Scholar]
- Wikoff WR, Conway JF, Tang J, Lee KK, Gan L, Cheng N, Duda RL, Hendrix RW, Steven AC, Johnson JE. Time-resolved molecular dynamics of bacteriophage HK97 capsid maturation interpreted by electron cryo-microscopy and X-ray crystallography. J Struct Biol. 2006;153:300–306. doi: 10.1016/j.jsb.2005.11.009. [DOI] [PubMed] [Google Scholar]
- Wu S, Haag L, Hammar L, Wu B, Garrof H, Xing L, Murata K, Cheng RH. The dynamic envelope of a fusion class II virus. J Biol Chem. 2007;282:6752–6762. doi: 10.1074/jbc.M609125200. [DOI] [PubMed] [Google Scholar]
- Xing L, Tjarnlund K, Lindqvist B, Kaplan GG, Feigelstock D, Cheng RH, Casasnovas JM. Distinct cellular receptor interactions in poliovirus and rhinoviruses. Embo J. 2000;19:1207–1216. doi: 10.1093/emboj/19.6.1207. [DOI] [PMC free article] [PubMed] [Google Scholar]
- Yeates TO, Jacobson DH, Martin A, Wychowski C, Girard M, Filman DJ, Hogle JM. Three-dimensional structure of a mouse-adapted type 2/type 1 poliovirus chimera. Embo J. 1991;10:2331–2341. doi: 10.1002/j.1460-2075.1991.tb07772.x. [DOI] [PMC free article] [PubMed] [Google Scholar]