

Abstract
Background
Amino acids (AA) activate the mammalian target of rapamycin (mTOR) signaling pathway but overactivation has a negative feedback effect on insulin signaling which may lead to insulin resistance and type 2 diabetes (T2DM). Purpose: To determine the effect of reduced AA concentrations on mTOR and insulin signaling during increased nutrient and insulin availability.
Methods
Six control and six T2DM subjects were studied at baseline and following a 5h AA lowering high energy and insulin clamp. Stable isotopic techniques in combination with femoral catheterizations were used to measure AA kinetics across the leg while muscle biopsies were used to measure mTOR and insulin signaling proteins using immunoblotting techniques.
Results
AA concentrations decreased by ~30–60% in both groups (P<0.05). Phospho-mTOR, S6K1, eEF2, and eIF2α were unchanged in both groups following the clamp (P>0.05). In T2DM subjects, IRS-1 serine phosphorylation was unchanged while phospho-AMPKα decreased and phospho-Akt, phospho-AS160 and glucose uptake increased following the clamp (P<0.05). In comparison, AA concentrations were maintained in a separate group during an insulin infusion. In this group, phospho-Akt, mTOR and S6K1 (n=4) increased.
Conclusion
Amino acids are necessary for insulin-induced activation of mTOR signaling and protein synthesis in both healthy and insulin resistant skeletal muscle.
Keywords: mammalian target of rapamycin, muscle protein synthesis, amino acid availability, adenosine 5′-monophosphate-activated protein kinase
Introduction
Obesity is a worldwide health concern affecting nearly 300 million people with approximately 90% of type 2 diabetes (T2DM) patients being obese 1. It has been known for quite some time that nutrient overload is the primary factor causing obesity, insulin resistance and eventually T2DM 2, 3. Furthermore, obesity is associated with an increase in circulating amino acid concentrations and in particular the branched chain amino acids 4, 5.
A large majority, but not all 6, 7, of these studies have shown that increasing blood amino acid availability resulted in an inhibition of glucose disposal at the whole body level and across the forearm 8–15. It is now proposed that increased amino acid availability induces insulin resistance by inhibiting insulin signaling within muscle cells. Patti et al. elucidated the cellular mechanisms responsible for the inhibition in glucose transport when they found that cultured myotubes exposed to high physiological levels of amino acids activated ribosomal protein S6 kinase 1 (S6K1) and 4E binding protein 1 (4E-BP1), downstream targets of the mammalian target of rapamycin (mTOR) 16. In particular, an increase in amino acid availability reduced insulin-stimulated tyrosine phosphorylation of the insulin receptor substrate-1 (IRS-1) and reduced the activity of the class 1 phosphatidylinositol 3-kinase (PI3K) 16. Additional in vitro work in muscle and adipocytes confirmed that amino acid overactivation of the mTOR nutrient signaling pathway was responsible for the increase in serine phosphorylation of IRS-1 and the subsequent inhibition of insulin signaling 17, 18.
Amino acids are potent activators of the mammalian target of rapamycin (mTOR) nutrient signaling pathway 19, 20. The effect of amino acids, and in particular leucine, on mTOR activation appear to be independent of insulin signaling mechanisms and apparently operate through a class 3 PI3K called hVps34 21, 22 upstream of mTOR. A recent study by Um et al. 23 found that genetically engineered mice deficient in the mTOR downstream target S6K1 were more insulin sensitive and did not demonstrate IRS-1 serine phosphorylation on a high fat diet as did their wild type counterparts. More recently, Tremblay et al. 24 have confirmed in humans that an acute infusion of amino acids increased serine phosphorylation of IRS-1 and inhibited insulin signaling by overactivation of S6K1.
We have recently shown that an increase in nutrient and insulin availability can stimulate protein synthesis in human skeletal muscle if amino acid concentrations are maintained by using a local infusion of insulin into the femoral artery 25, 26. On the other hand, a systemic infusion of insulin significantly reduces circulating amino acid concentrations 25, 27, 28. Therefore, we hypothesized that reduced amino acid availability during an acute, systemic infusion of insulin and nutrients would not increase protein synthesis because mTOR/S6K1 signaling would not be activated in either healthy or insulin resistant skeletal muscle. A secondary aim was to assess whether a reduction in amino acids during increased insulin and nutrient availability would alter insulin signaling and glucose uptake in obese, T2DM skeletal muscle. To address our hypotheses we analyzed several cell signaling protein in muscle tissue from several of our recent metabolic studies 25, 26, 29, 30.
Methods
Subjects
We recruited 9 men and 3 women to participate in the study. The characteristics of the six controls (35 ± 3 y; 81 ± 6 kg; 23 ± 1 body fat %) and the six T2DM (40 ± 4 y; 79 ± 6 kg; 28 ± 2 body fat %) are expanded in previous publications 29, 30 The T2DM subjects were eligible for this study if their fasting blood glucose levels were ≥ 7 mmol/L and/or 2 h blood glucose levels were ≥ 11 mmol/L (200 mg/dl) following the oral glucose tolerance test and if they were not taking any medications. T2DM subjects were classified as having poorly controlled blood glucose values as indicated by nonenzymatically glycated hemoglobin levels >7% (8.7 ± 1.5%). Both healthy controls and T2DM groups were sedentary at the time and gave their written consent to participate. The study was approved by the Institutional Review Board at the University of Southern California.
Study design for Reduced AA groups
The study protocol was designed to assess amino acid and fatty acid kinetics in obese T2DM under postabsorptive (Basal) conditions and during a 5 h amino acid (AA) lowering, hyperglycemic-hyperinsulinemic-hyperlipidemic (Reduced AA) clamp. Therefore, blood glucose levels were increased to a similar extent above baseline in both groups during the clamp so that the total amount of nutritional energy was similar in the two groups. Following admission to the General Clinical Research Center, the evening before the study, subjects were given a Dual-Energy X-Ray Absorptiometry scan (Hologic QDR 4500W, Bedford, MA) to measure body composition and consumed a standardized meal (41.9 kJ/kg of body weight), after which only ad libitum water was allowed until the end of the experiment.
The study began the next morning with the insertion of femoral arterial and venous polyethylene catheters in the leg. The arterial catheter was also used for the infusion of indocyanine green (Akorn, Inc., Buffalo Grove, IL) to measure blood flow. Additional catheters were placed in the forearm vein for systemic isotope infusion and in a contralateral wrist vein, which was heated in order to obtain arterialized blood samples. Background blood and breath samples were obtained, and a 13C bicarbonate prime of 3 μmol/kg and a L-[ring-2H5]phenylalanine prime of 2 μmol/kg was given followed by a continuous infusion of L-[ring-2H5] phenylalanine (0.05 μmol·kg−1·min−1) and U-13C-palmitate (0.04 μmol·kg−1·min−1) (Cambridge Isotope Laboratories, Andover, Massachusetts). At 80 min after the tracer infusion was initiated, an infusion of indocyanine green was initiated to measure blood flow, and four breath and blood samples were obtained at 10 min intervals (approximately 90, 100, 110, and 120 min). At 120 min, using a 5 mm Bergström biopsy needle (Stille, Stockholm, Sweden) a first skeletal muscle biopsy was taken from the lateral portion of the vastus lateralis muscle, about 20 cm above the knee, using local anesthesia with 1% lidocaine injected subcutaneously and on the fascia. The muscle sample was immediately frozen in liquid nitrogen and stored at −80°C until analysis.
Immediately following the first skeletal muscle biopsy, the palmitate tracer was stopped and the 5 h Reduced AA clamp was initiated. Plasma insulin concentrations were elevated with a systemic insulin infusion (0.5 mU·kg−1·min−1) into the forearm vein, and blood samples (0.5 ml) were taken every 5–10 min to monitor the plasma glucose concentration. A 20% dextrose infusion was also initiated and varied to increase glucose concentration by approximately 2200 μmol/L above baseline and clamp it at the new concentration until the end of the experiment in both groups. During the infusion period, Intralipid® (0.7 ml·kg−1·min−1) and heparin (7 U·kg−1·h−1) (Baxter, Deerfield, Illinois, USA) were also infused to prevent the expected decrease in plasma free fatty acids.
Three hours after the beginning of the clamp, the palmitate tracer infusion was restarted. Indocyanine green infusion was restarted at 380 min, indirect calorimetry measures were taken, and breath and blood samples were obtained at 390, 400, 410, 420 min. A final skeletal muscle biopsy was obtained at 420 min.
Maintained AA group
We have recently performed a local insulin infusion (i.e., into the femoral artery) in six young (23±1 yrs), insulin sensitive subjects in order to prevent large decreases in circulating amino acids as previously described 25. The study design was similar to the design as described for the Reduced AA groups and consisted of using stable isotopic techniques (L-ring- 13C6-phenylalanine), femoral catheterization, and collection of muscle biopsies from the vastus lateralis before and after a an insulin infusion. However, slight differences in study design are acknowledged such as less energy was infused (lipid, glucose) and a palmitate tracer was not used. Each subject was studied at baseline (following an overnight fast) and again following a 3 h hyperinsulinemic-euglycemic clamp (20% dextrose) 25.
Metabolic parameters
We measured phenylalanine, and palmitate blood, breath, and muscle enrichments as previously described 25, 29, 30. We calculated the concentrations of the branch-chained amino acids (BCAA) in the plasma using gas chromatography-mass spectrometry (GCMS) followed by use of the external standard technique as previously described 31. In addition, the equations used to calculate muscle protein synthesis, breakdown, amino acid and fatty acid kinetics have been described in detail elsewhere 25, 29, 30. Insulin concentrations were measured via a radioimmunoassay commercial kit (Diagnostic Products Corp., Los Angeles, California, USA). Plasma glucose was determined by the glucose oxidase method using a YSI 2700 analyzer (Yellow Springs Instruments, Yellow Springs, Ohio, USA), immediately after each blood draw. Plasma free fatty acid concentration was determined enzymatically (Wako NEFA; Wako Chemicals GmbH, Neuss, Germany). To determine leg blood flow, serum samples were analyzed in a spectrophotometer (805 nm) following a continuous infusion of indocyanine green. Glucose uptake across the leg was determined by calculating the product between blood flow and the arterial-venous difference of glucose.
Immunoblot analysis
40 mg of frozen tissue was homogenized (1:9, wt/vol), centrifuged for 10 min at 4°C followed by the removal of the supernatant. Total protein concentrations were determined by using the Bradford assay analyzed by a spectrophotometer (Smartspec Plus; BioRad, Hercules, CA). The supernatant was diluted (1:1) in a sample buffer mixture containing 125 mM Tris, pH 6.8; 25% glycerol; 2.5% sodium dodecyl sulfate 2.5%; β-mercaptoethanol and 0.002% bromophenol blue then boiled for 3 min at 100°C. One hundred micrograms (50 μg total protein for mTOR) of total protein was loaded into each lane and the samples were separated by electrophoresis (150 V for 60 min) on a 7.5% polyacrylamide gel (BioRad, Criterion). Each gel consisted of Basal and Reduced AA muscle samples of two subjects (Control and T2DM) with each sample loaded in duplicate. An internal loading control (standard) and a molecular weight ladder (Precision Plus; BioRad, Hercules, CA) were also included on each gel. Following electrophoresis, protein was transferred to a polyvinylidene difluoride membrane (BioRad, Hercules, CA) at 50V for 60 min. Blots were incubated in a single primary antibody overnight at 4° C (antibody concentrations are described below). The next morning, blots were incubated in secondary antibody for 1 h at room temperature. Chemiluminescent solution (ECL plus; Amersham BioSciences, Piscataway, NJ) was applied to each blot. After a 5 min incubation, optical density measurements were obtained with a phosphoimager (BioRad, Hercules, CA) and densitrometric analysis was performed using Quantity One software (Ver 4.5.2) (BioRad, Hercules, CA). Phosphorylation and total protein were normalized to a standard. Final data was expressed as normalized protein phosphorylation relative to normalized total protein. However, phosphorylation status of acetyl-CoA carboxylase beta (ACCβ) and eukaryotic initiator factor 2 alpha (eIF2α) were expressed relative to a standard.
Antibodies
The phospho and total primary antibodies used were purchased from Cell Signaling (Beverly, MA) unless otherwise noted: phospho-mTOR (Ser2448; 1:1000); phospho-p70 S6K1 (Thr389; 1:500); phospho-IRS-1 (Ser312; Ser636/639; 1:500); phospho-eEF2 (Thr56; 1:1000); phospho-eIF2α (Ser52; 1:1000; purchased from BioSource, Camarillo, CA); phospho-Akt (Ser473; 1:500); phospho-AMPKα (Thr172; 1:1000); phospho-ACCβ (Ser79; 1:500); phospho-Ser/Thr Akt substrate (1:500). Total protein for each of these molecules were detected using an antibody dilution of 1:1000. AS160 (Rab-GAP) was purchased from Upstate Signaling (Charlottesville, VA). Anti-rabbit IgG horseradish peroxidase-conjugated secondary antibody was purchased from Amersham Bioscience (Piscataway, NJ) (1:2000).
Statistics
All data was statistically analyzed using NCSS (Kaysville, UT) software. Comparisons of groups at baseline were performed using a Student’s t-test and comparisons with the treatment period were performed using a two-way ANOVA (2 × 2) with factors being treatment (Control and T2DM) and time (Basal and Reduced AA). Under conditions of a main effect, a Tukey post hoc analysis was used to determine interactions. Data comparing AA concentrations in the blood and delivered to the leg at Basal and Reduced AA and mTOR signaling proteins at Basal and Maintained AA were conducted using a paired t-test. Significance was determined to be P<0.05. Values were expressed as mean ± SE.
Results
In order to put the signaling data in the proper metabolic context the relevant baseline parameters of plasma amino acid, glucose, insulin, glucose uptake across the leg, muscle protein synthesis and breakdown for Control, T2DM, and Maintained AA groups are found in Table 1.
Table 1.
| Metabolic measurements | Control | T2DM | Maintained AA |
|---|---|---|---|
| Blood amino acid concentration | ↓ | ↓ | __ |
| Blood glucose concentration | ↑ | ↑a | __ |
| Blood insulin concentration | ↑ | ↑b | ↑ |
| Glucose uptake across the leg | ↑ | ↑ | ↑ |
| Muscle protein synthesis | ↓* | ↓* | ↑ |
| Muscle protein breakdown | ↓ | ↓ | __ |
Arrows are a summary of results from Ref 25 and 26. All arrows that point up or down are significantly different from Basal levels (P< 0.05). No arrow represents no change from Basal (P>0.05).
a indicates significantly higher than Control.
indicates significantly lower than Control.
indicates P-value of P=0.08.
To further verify a reduction in AA, we measured the branched chain amino acids (BCAA) before and after the Reduced AA clamp (Fig. 1A-C). A) Leucine, B) isoleucine, and C) valine concentration were significantly reduced by ~30–60% in both groups (P<0.05). In the same figure, we report delivery of AA to the leg (blood flow x AA concentration) before and after Reduced AA clamp. We found that the delivery to the leg was significantly reduced for leucine, isoleucine and valine in both groups (P<0.05, Fig. 1). Although the percentage reduction before and after treatment was similar between groups, T2DM demonstrated significantly greater levels of delivery to the leg at Basal and Reduced AA clamp for all BCAA (P<0.05).
Figure 1.

Histograms represent arterial AA concentrations on left Y-axis and AA delivered to leg on right Y-axis (n=6) for A) Leucine (n=6), B) Isoleucine (n=6), and C) Valine (n=6) at Basal and following Reduced AA clamp in Control and T2DM subjects. All values are expressed as mean ± SE. *Significantly different than Basal (P<0.05). #Significantly different from Control (P<0.05).
mTOR signaling
The phosphorylation status of mTOR at Ser2448 (Fig. 2A) was unchanged in Control and T2DM subjects following the Reduced AA clamp. The total mTOR protein level was significantly reduced at Basal and Reduced AA time points for T2DM compared to Control (Table 2) (P<0.05). There were no significant differences for S6K1 phosphorylation (Thr389; Fig. 2B), eEF2 phosphorylation (Thr56; Fig. 3A) and their total protein abundance (Table 2) at the Basal or Reduced AA time points for Control or T2DM subjects. Interestingly, phosphorylation status of eIF2α at Ser52 (Fig. 3B) was significantly lower for T2DM subjects compared to Control at baseline (P<0.05).
Figure 2.
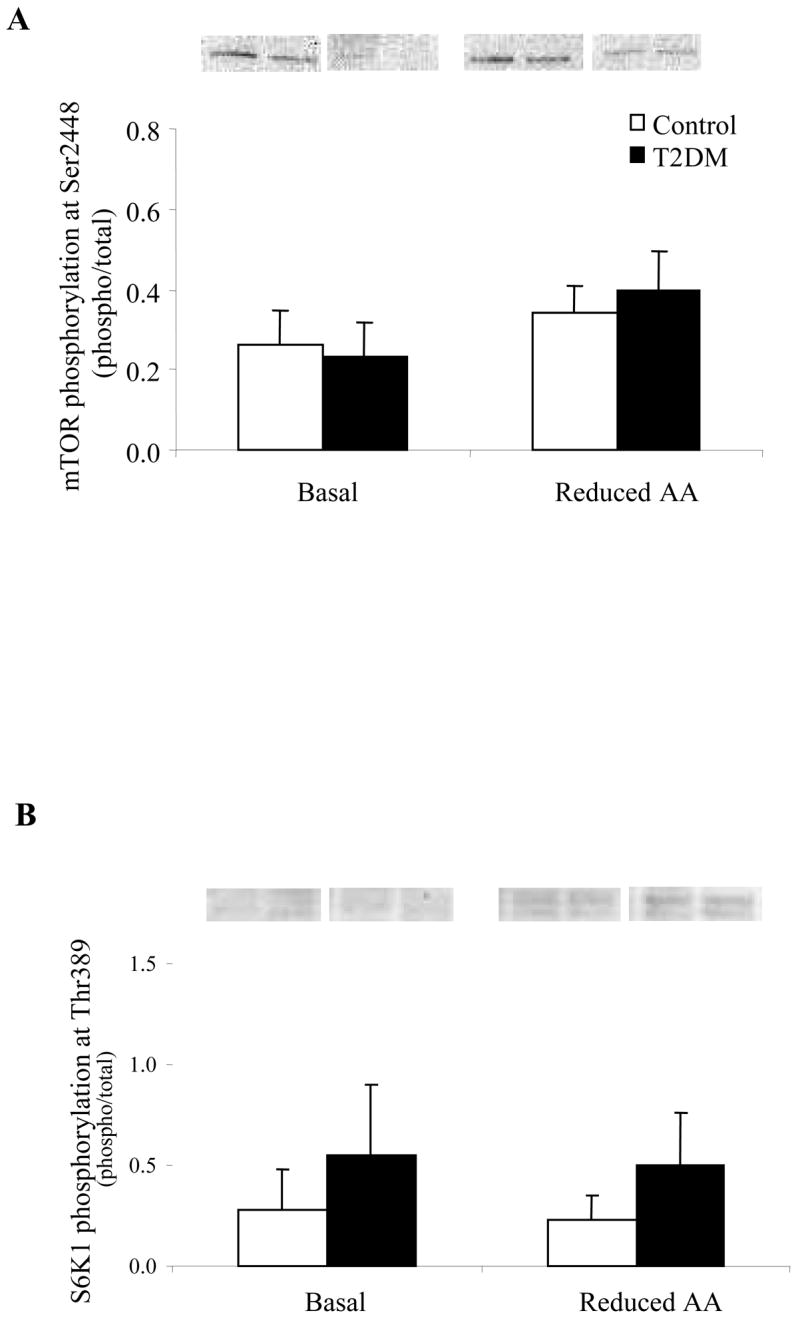
Phosphorylation status of A) mTOR at Ser2448 (n=6) and B) S6K1 at Thr389 (n=5) at Basal and following a Reduced AA clamp in Control and T2DM subjects. Phosphorylation values are relative to total protein. All values are expressed as mean ± SE.
Table 2.
| Basal | Reduced AA | |||
|---|---|---|---|---|
| Control | T2DM | Control | T2DM | |
| mTOR (n=6) | 1.26 ± 0.15 | 0.38 ± 0.11# | 0.90 ± 0.11 | 0.49 ± 0.10# |
| S6K1 (n=5) | 1.04 ± 0.15 | 0.64 ± 0.16 | 0.96 ± 0.16 | 0.78 ± 0.19 |
| eEF2 (n=5) | 4.33 ± 0.35 | 2.61 ± 0.30 | 4.53 ± 0.36 | 2.28 ± 0.27 |
| IRS-1 (n=6) | 1.69 ± 0.13 | 1.13 ± 0.16 | 1.49 ± 0.17 | 1.33 ± 0.22 |
| Akt (n=5) | 0.39 ± 0.11 | 0.48 ± 0.12 | 0.43 ± 0.09 | 0.27 ± 0.11* |
| AS160 (n=6) | 1.21 ± 0.14 | 1.18 ± 0.16 | 1.64 ± 0.16 | 1.17 ± 0.14 |
| AMPK (n=5) | 2.72 ± 0.32 | 1.66 ± 0.24 | 2.49 ± 0.26 | 1.41 ± 0.18 |
Subject total (n) is representative for both treatments and time points.
indicates significantly different than Basal (P < 0.05).
indicates significantly different than Control at corresponding time point (P < 0.05).
All values are expressed as mean ± SE.
Figure 3.
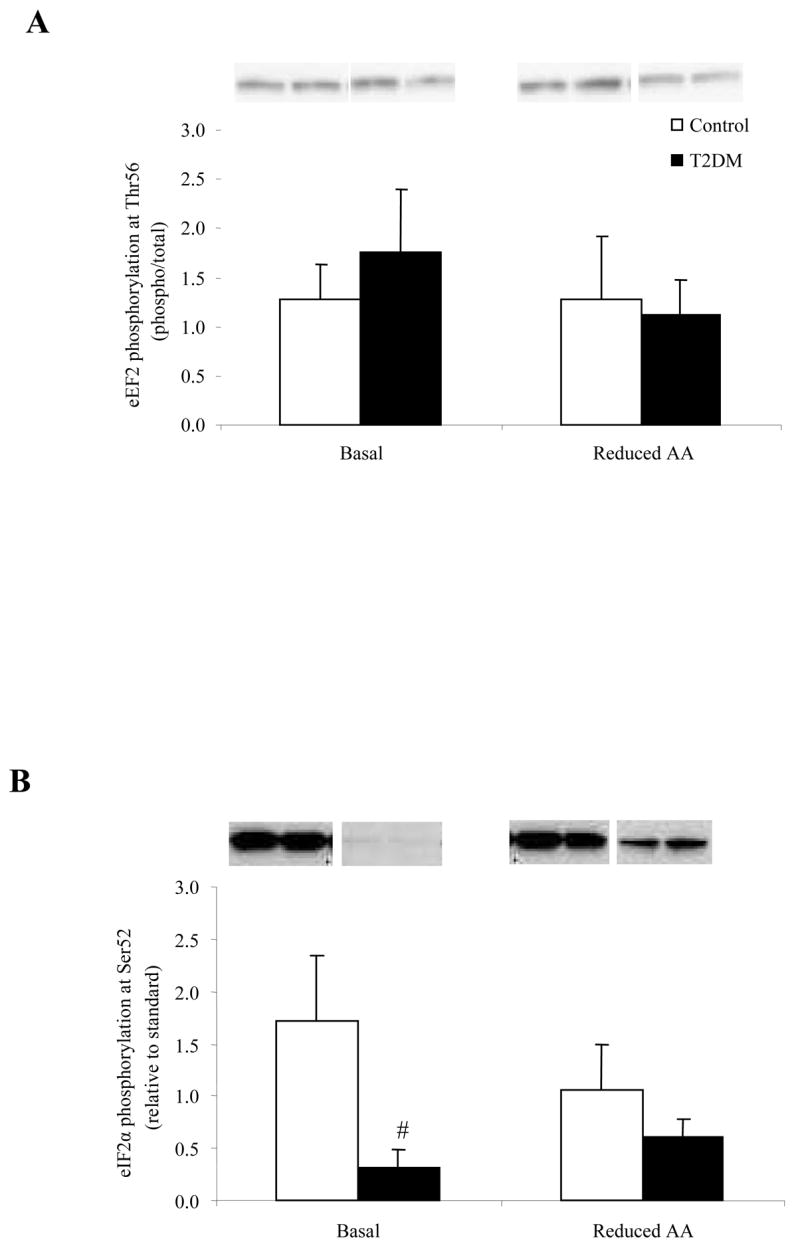
Phosphorylation status of A) eEF2 at Thr56 (n=5) and B) eIF2α at Ser52 (n=6) at Basal and following a Reduced AA clamp in Control and T2DM subjects. Representative immunoblot images are shown above each figure. Phosphorylation values are relative to total protein in Fig. 3A and relative to standard in Fig. 3B. All values are expressed as mean ± SE. #Significantly different from Control (P<0.05).
Insulin signaling
Phosphorylation of IRS-1 at Ser312 (Fig. 4A) and Ser636/639 (Fig. 4B) was not different at baseline or following the Reduced AA clamp in either the Control or T2DM group. There was no significant change in IRS-1 total protein content in either group (Table 2). The phosphorylation status of Akt at Ser473 (Fig. 5A) increased in both groups following the Reduced AA clamp (P<0.05) while total Akt protein abundance (Table 2) was lower only in T2DM as a result of Reduced AA (P<0.05). AS160 phosphorylation (Fig. 5B) increased in the T2DM subjects following the Reduced AA clamp as compared to the Control subjects (P<0.05). There was no difference in total AS160 protein content (Table 2) within or between the two groups at Basal or as a result of the Reduced AA clamp.
Figure 4.
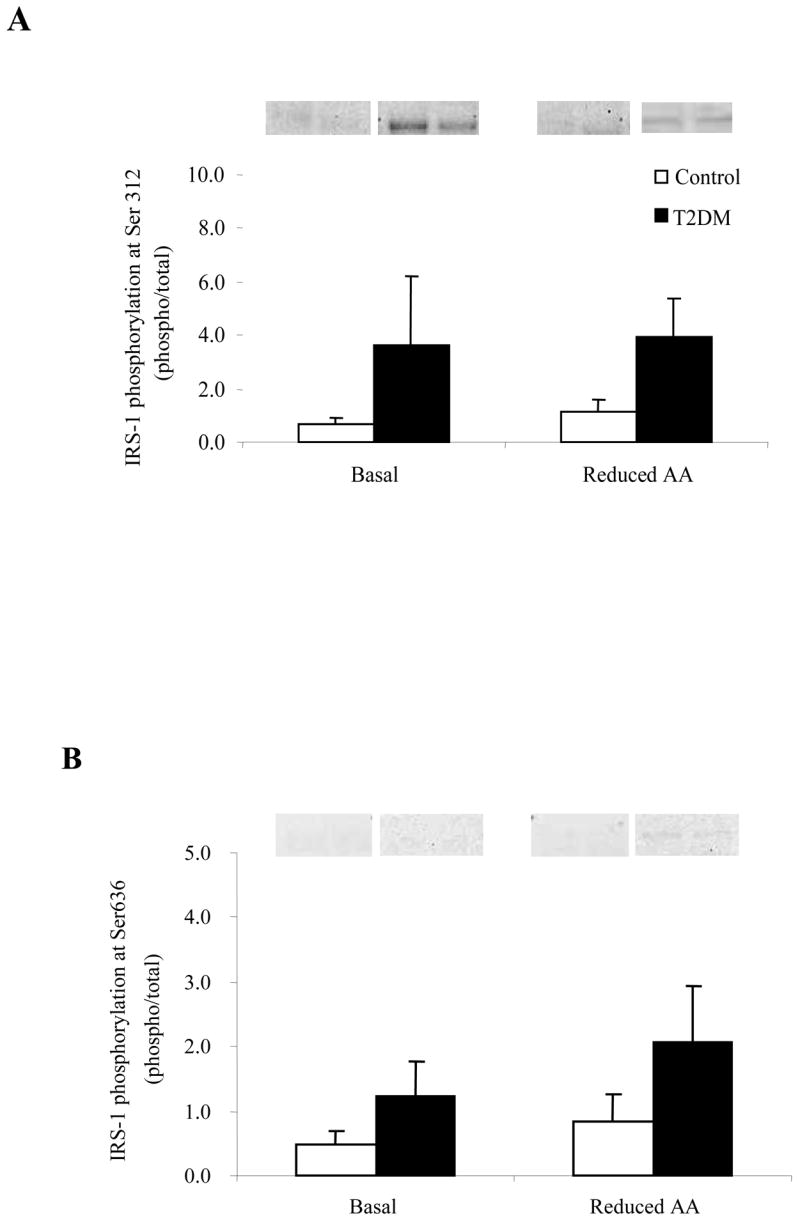
Phosphorylation status of IRS-1 at Basal and following a Reduced AA clamp in Control and T2DM subjects. A) IRS-1 at Ser312 (n=5) and B) Ser636/639 (n=6). Representative immunoblot images are shown above each figure. Phosphorylation values are relative to total protein. All values are expressed as mean ± SE.
Figure 5.
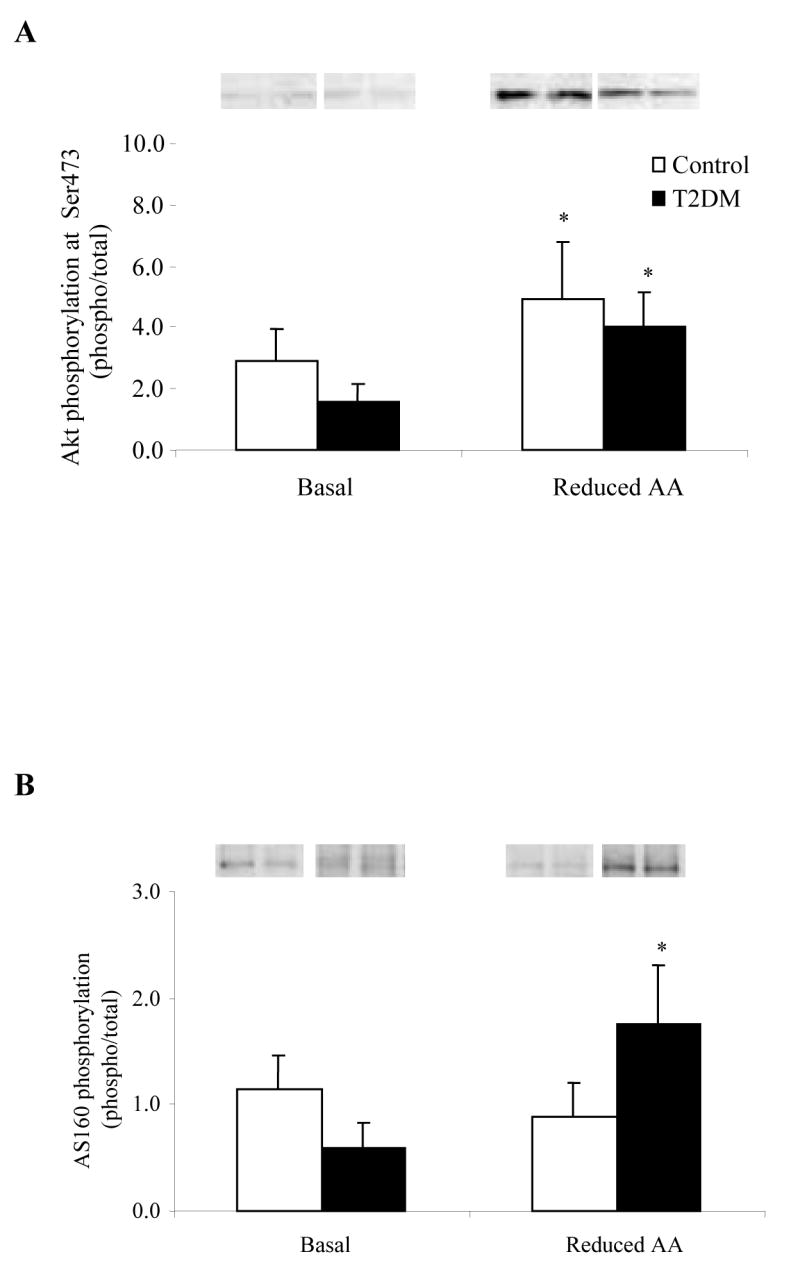
Phosphorylation status of A) Akt at Ser473 (n=5) and B) AS160 (n=6) at Basal and following a Reduced AA clamp in Control and T2DM subjects. Representative immunoblot images are shown above each figure. Phosphorylation values are relative to total protein. All values are expressed as mean ± SE. *Significantly different than Basal (P<0.05).
AMPK signaling
AMPKα phosphorylation at Thr172 (Fig. 6A) was significantly reduced in both groups following the Reduced AA clamp (P<0.05). Total AMPKα protein content was not different between the Control or T2DM subjects at baseline and did not change following the Reduced AA clamp (Table 2). There was no difference in ACCβ phosphosphorylation at Ser79 (Fig. 6B) before or after the clamp in either the Control or T2DM subjects. Malonyl-CoA increased (P<0.05) to a similar extent in both groups following the Reduced AA clamp 29.
Figure 6.
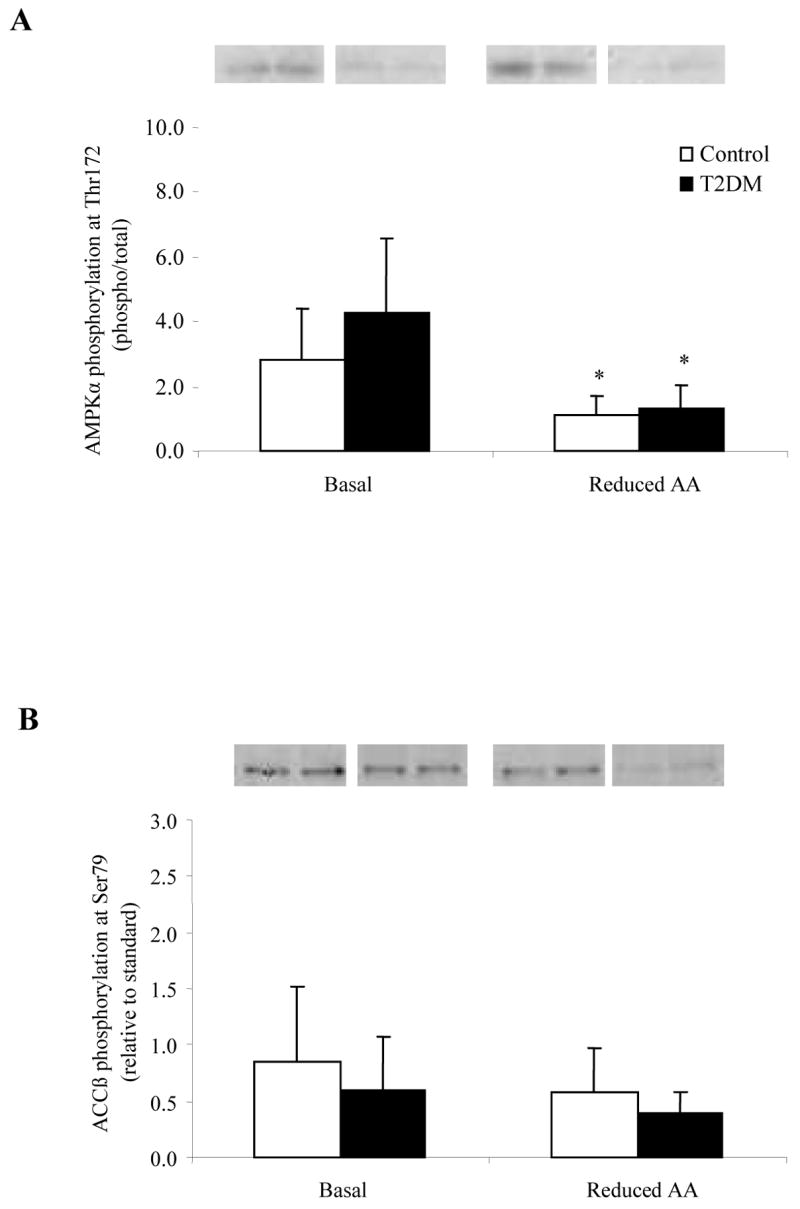
Histograms represent the phosphorylation status of A) AMPKα (n=5) and B) ACCβ at Ser79 (n=5) at Basal and following a Reduced AA clamp in Control and T2DM subjects. Representative immunoblot images are shown above each figure. Phosphorylation values are relative to total protein in Fig. 6A and relative to standard in Fig. 6B. All values are expressed as mean ± SE. *Significantly different than Basal (P<0.05).
Maintained AA group
The metabolic and amino acid kinetic data from the six subjects in the Maintained AA group have been previously published 26 and are summarized in Table 1. To determine whether phosphorylation status was altered in the muscles of these subjects, we performed new experiments with the remaining muscle tissue (n=4). As shown in Figure 7, the phosphorylation status of Akt, mTOR and S6K1 were significantly increased following the insulin infusion in which AA concentrations were maintained (P<0.05; Fig. 7A–C).
Figure 7.
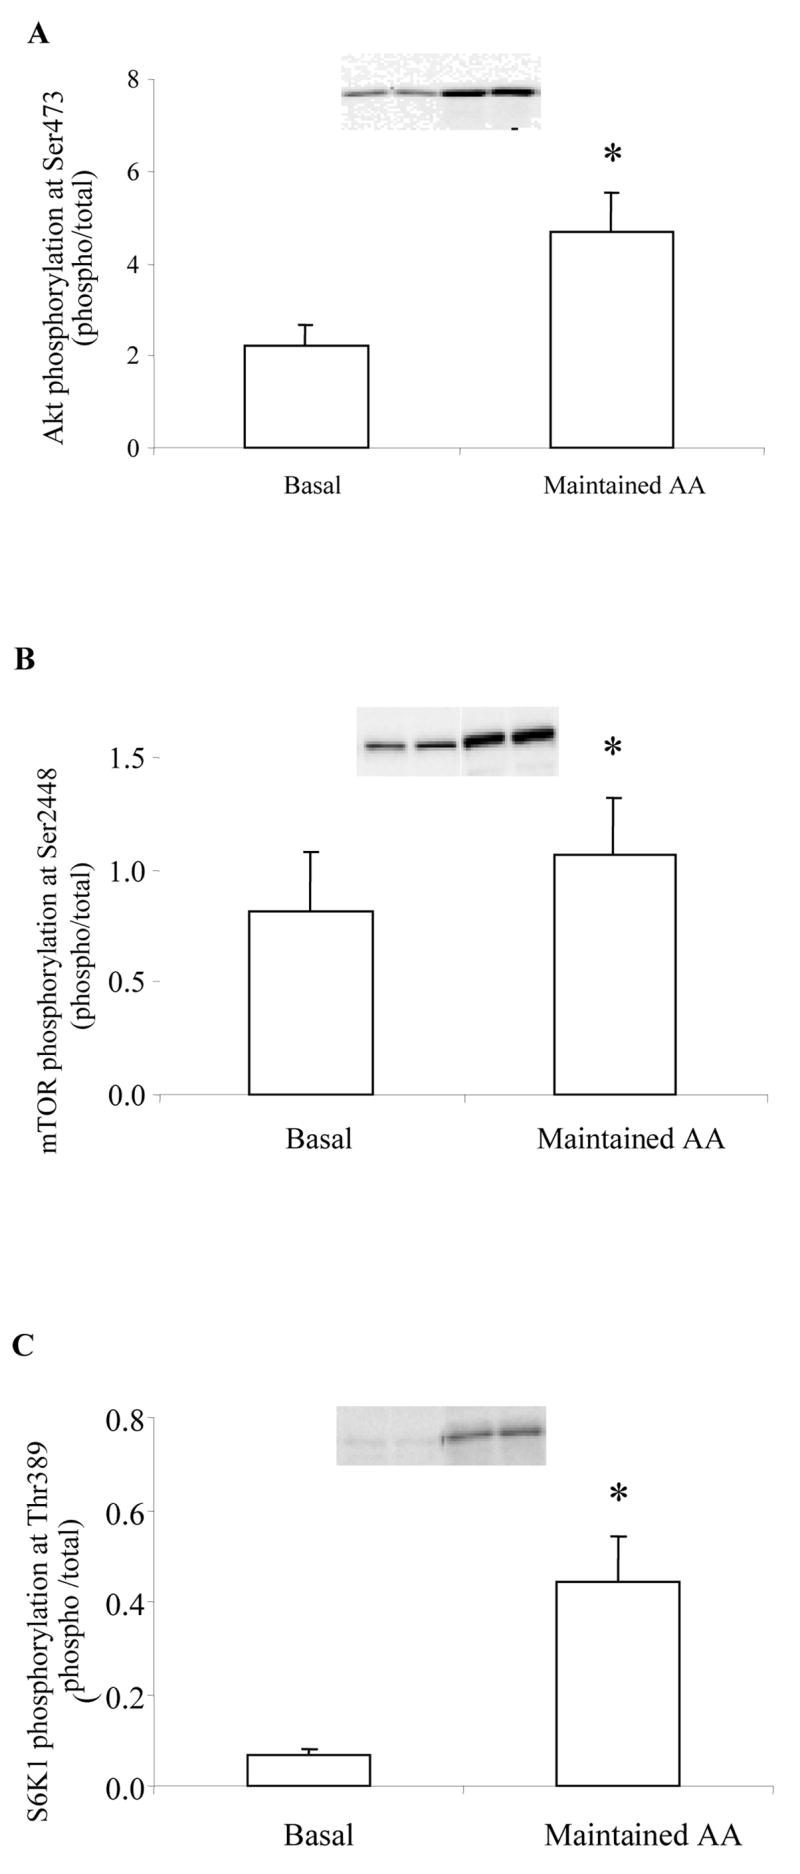
Histograms represent the phosphorylation status of A) Akt at Ser473 (n=4), B) mTOR at Ser2448 (n=4), and C) S6K1 at Thr389 at Basal and following treatment with Maintained AA in young, healthy subjects. Representative immunoblot images are shown above each figure. Phosphorylation values are relative to total protein. All values are expressed as mean ± SE. *Significantly different than Basal (P<0.05).
Discussion
Our primary finding was that reduced amino acid concentrations during increased nutrient and insulin availability blunted mTOR/S6K1 signaling and muscle protein synthesis in both Control and T2DM subjects compared to a group that maintained AA concentrations during an insulin infusion. Interestingly, following the Reduced AA clamp, insulin signaling (e.g., Akt phosphorylation and IRS-1 serine phosphorylation) and glucose uptake were similar between the insulin-sensitive Control subjects and the insulin-resistant T2DM subjects. The T2DM subjects also had an increased phosphorylation of AS160 following the Reduced AA clamp. These findings imply that amino acid availability is an important regulator of not only mTOR signaling and muscle protein synthesis, but may be playing a role in insulin signaling. Other novel findings were that total mTOR protein and eIF2α phosphorylation were reduced in the T2DM subjects.
Amino acid availability (particularly the essential amino acids) plays a pivotal role in the regulation of protein synthesis 20, 32. Fasting in humans and animals results in a net negative protein balance 33, 34 while ingesting amino acids increases the rate of muscle protein synthesis 35–37. As shown in the current study, an increase in nutrient and insulin availability decreased amino acid concentrations, reduced delivery of AA to the leg (Fig. 1A–C), and tended to reduce muscle protein synthesis (Table 1; P=0.08) in both Control and T2DM subjects. On the other hand, a local infusion of insulin maintained amino acid concentrations, delivery to the leg, and increased muscle protein synthesis 25, 26. Although insulin alone can increase muscle protein synthesis in animals 38 and humans 26, 39, amino acids (particularly leucine) appear to be a much more potent anabolic agent 20, 40, 41. Furthermore, insulin cannot stimulate muscle protein synthesis if amino acid concentrations are not maintained 25, 26. Thus, when the necessary building blocks are not available to the cell, protein synthesis is ineffective regardless of the presence of insulin and nutritional energy.
Protein synthesis is modulated at the cellular level primarily by the mTOR signaling pathway 32. Recent studies by Byfield et al. 21 and Nobukuni et al. 22 indicate that amino acids can activate mTOR through hVps34, a class 3 PI3K. We report that mTOR phosphorylation at Ser2448 (Fig. 2A) was not significantly elevated nor its downstream effector S6K1 (Thr389; Fig. 2B) in response to reduced amino acids even though insulin and nutrient energy was substantially increased. This corresponded nicely with the attenuated muscle protein synthesis in both groups following the Reduced AA clamp (Table 1). Other markers of either translation elongation, (eEF2; Fig. 3A), or translation initiation, (eIF2α; Fig. 3B) phosphorylation were not different following the clamp. In our maintained AA group, protein synthesis was increased as previously reported 25. As a follow-up, we measured the phosphorylation status of Akt, mTOR and S6K1 in these same subjects 25. We found an increased phosphorylation of all three proteins (Fig. 7A–C) when AA are maintained further supporting the notion that amino acids must be adequately present to stimulate protein synthesis. We have also recently increased essential amino acid and insulin availability in young subjects and show that mTOR and S6K1 phosphorylation are increased to a very large extent in combination with a rapid and potent increase in muscle protein synthesis 42. Therefore, blunted mTOR/S6K1 signaling appears to be a plausible cellular mechanism which may explain why muscle protein synthesis did not increase in our subjects even though insulin and abundant nutrient energy was present.
Recent reports have also indicated that excess amino acids can cause insulin resistance in humans 14, 15, 24, 43 and thereby influence glucose uptake into the cell. We demonstrate that after a continuous infusion of energy and insulin, absent of amino acids, glucose uptake increased to a similar extent in both Control and T2DM groups (Table 1). Although we increased the glucose concentration above basal levels in both groups during the clamp, simply increasing the glucose availability does not completely explain why our T2DM subjects had similar glucose uptake values as compared to the Control group. Our data show that in addition to increasing glucose uptake during the clamp, insulin signaling in the muscles of our T2DM group improved. Specifically, Akt phosphorylation at Ser473 was increased (Fig. 5A) followed by an increased phosphorylation of AS160 (Fig. 5B). This occurred concurrently with a blunted IRS-1 serine phosphorylation response (Fig. 4A and B). We refer to a blunted response here because we have recently shown than ingestion of 20 grams of essential amino acids and 35 grams of carbohydrate tends to increase muscle IRS-1 serine phosphorylation (P=0.08) 42. It is difficult to explain why Akt phosphorylation increased in the Control group to a similar magnitude as T2DM without the paralleled increase in AS160 phosphorylation. One possibility is that AS160 phosphorylation may have occurred earlier in the insulin sensitive control subjects and thus we missed the peak increase in AS160 phosphorylation. Since AS160 has been associated with an increased GLUT4 translocation to the cell surface 44 and our T2DM subjects were insulin resistant, another possible explanation may be that it took longer for AS160 to be phosphorylated in the T2DM group which we were able to detect at 5 h following the initiation of the insulin clamp. Although the data presented in the current paper do not provide overwhelming evidence to support a role for mTOR signaling in regulating negative feedback to insulin signaling, it is apparent that components of the insulin signaling pathway and the end result (glucose uptake across the leg) appear to be improved during the Reduced AA clamp in the insulin resistant subjects. We also acknowledge that glucose and fatty acids can influence aspects of insulin signaling and therefore it is possible that these nutrients may have influenced our insulin signaling results as well. However, much more work is needed to verify the specific role of mTOR and amino acid availability in controlling insulin sensitivity.
Previous work strongly supports a link between amino acids and reduced insulin signaling. For instance, Terruzzi et al. 45 noted that rat hearts infused with insulin and amino acids have reduced PI3K activity and glucose uptake compared to insulin alone. In addition, Patti and colleagues 16 demonstrated that L6 myotubes stimulated with amino acids in the presence of insulin inhibit critical components of glucose transport such as PI3K activity and tyrosine phosphorylated IRS-1. Finally, recent work indicates that mTOR and/or S6K1 are primarily responsible for inducing IRS-1 serine phosphorylation and inhibiting insulin signaling 18, 23. Furthermore, Tremblay et al. 24 have also shown that an acute infusion of amino acids into human subjects resulted in an overactivation of S6K1 and an inhibition of insulin signaling. On the other hand, in the current study we found that when amino acid availability is reduced during an increase in insulin and nutrient infusion (in comparison to subjects in which AA’s are maintained), that AA’s ability to stimulate mTOR signaling was blunted, which seems to be associated with improved insulin signaling for glucose uptake in both Control and T2DM subjects. Our data, along with others, support the hypothesis that amino acids may play a role in the regulation of insulin signaling via the mTOR nutrient signaling pathway.
Our data support the notion that blood amino acid availability plays a regulatory role in regulating muscle protein synthesis, and perhaps muscle protein breakdown, which is especially important in conjunction with elevated insulin concentrations. However, it also appears that supraphysiological doses of insulin can override the effect of lowered amino acids on protein synthesis with a slight decrease in protein breakdown in humans46.
In summary, we demonstrate that a reduction in amino acid concentrations during an increase in nutrient and insulin availability in Control and T2DM subjects results in a blunted mTOR/S6K1 signaling and reduced muscle protein synthesis in comparison to when AA concentrations are maintained during an insulin infusion. In addition, the T2DM subjects had similar rates of glucose uptake across the leg as compared to the Control group which corresponded with a stimulation of key components of the insulin signaling pathway (i.e., increased phosphorylation of Akt and AS160). Thus, a reduction in amino acid availability prevents mTOR activation despite an apparent improvement in insulin signaling. Therefore, we conclude that amino acids are necessary for the insulin-induced activation of mTOR/S6K1 and protein synthesis in both healthy and insulin resistant human skeletal muscle. Whether the blunted mTOR signaling is directly linked to improved insulin signaling in the T2DM subjects still needs to be confirmed. Therefore, future studies are required to determine whether chronic exposure of excess nutrients and amino acids lead to insulin resistance in human skeletal muscle and whether mTOR is a potential therapeutic target for improving insulin sensitivity in skeletal muscle.
Acknowledgments
This study was supported by grant R01 AR049877 from the National Institute for Arthritis and Musculoskeletal and Skin Resources, National Institutes of Health P30 AG024832. Diseases, the Zumberge Research and Innovation Fund, grant S10 RR16650 from the Shared Instrumentation Grant Program, and grant M01-RR-43 from the General Clinical Research Branch, National Center for Research. Contribution of authors: BR and JB developed research proposal; EV developed research design; MD and BR wrote the manuscript; MD analyzed the data; SF, HD, and EG collected data and reviewed manuscript. All authors read and approved final draft of manuscript.
Non-standard abbreviations
- 4E-BP1
4E binding protein 1
- AA
amino acids
- ACCβ
acetyl CoA carboxylase beta
- Akt
protein kinase B
- AMPK
adenosine 5′ –monophosphate-activated protein kinase
- AS160
Akt substrate 160
- BCAA
branch-chained amino acids
- eEF2
eukaryotic elongation factor 2
- eIF2α
eukaryotic initiation factor 2 alpha
- IRS-1
insulin receptor substrate-1
- mTOR
mammalian target of rapamycin
- PI3K
phosphatidylinositol 3-kinase
- S6K1
ribosomal S6 kinase1
- T2DM
type 2 diabetes mellitus
Footnotes
Publisher's Disclaimer: This is a PDF file of an unedited manuscript that has been accepted for publication. As a service to our customers we are providing this early version of the manuscript. The manuscript will undergo copyediting, typesetting, and review of the resulting proof before it is published in its final citable form. Please note that during the production process errors may be discovered which could affect the content, and all legal disclaimers that apply to the journal pertain.
References
- 1.World Health Organization Global Strategy on Diet, Physical Activity, and Health. World Health Organization (WHO) [Accessed September 10, 2006];2003 at http://www.who.int/dietphysicalactivity/en.
- 2.Must A, Spadano J, Coakley EH, Field AE, Colditz G, Dietz WH. The disease burden associated with overweight and obesity. JAMA. 1999;282:1523–9. doi: 10.1001/jama.282.16.1523. [DOI] [PubMed] [Google Scholar]
- 3.Tappy L, D’Alessio D. Obesity and insulin resistance: is it due to body fat, energy balance, or gut factors? Curr Opin Clin Nutr Metab Care. 2006;9:455–7. doi: 10.1097/01.mco.0000232907.76859.1c. [DOI] [PubMed] [Google Scholar]
- 4.Felig P, Marliss E, Cahill GF., Jr Plasma amino acid levels and insulin secretion in obesity. N Engl J Med. 1969;281:811–6. doi: 10.1056/NEJM196910092811503. [DOI] [PubMed] [Google Scholar]
- 5.Felig P, Wahren J, Hendler R, Brundin T. Splanchnic glucose and amino acid metabolism in obesity. J Clin Invest. 1974;53:582–90. doi: 10.1172/JCI107593. [DOI] [PMC free article] [PubMed] [Google Scholar]
- 6.Boden G, Tappy L. Effects of amino acids on glucose disposal. Diabetes. 1990;39:1079–84. doi: 10.2337/diab.39.9.1079. [DOI] [PubMed] [Google Scholar]
- 7.Tappy L, Acheson K, Normand S, Schneeberger D, Thelin A, Pachiaudi C, et al. Effects of infused amino acids on glucose production and utilization in healthy human subjects. Am J Physiol. 1992;262:E826–33. doi: 10.1152/ajpendo.1992.262.6.E826. [DOI] [PubMed] [Google Scholar]
- 8.Abumrad NN, Robinson RP, Gooch BR, Lacy WW. The effect of leucine infusion on substrate flux across the human forearm. J Surg Res. 1982;32:453–63. doi: 10.1016/0022-4804(82)90126-3. [DOI] [PubMed] [Google Scholar]
- 9.Schwenk WF, Haymond MW. Decreased uptake of glucose by human forearm during infusion of leucine, isoleucine, or threonine. Diabetes. 1987;36:199–204. doi: 10.2337/diab.36.2.199. [DOI] [PubMed] [Google Scholar]
- 10.Tessari P, Inchiostro S, Biolo G, Duner E, Nosadini R, Tiengo A, et al. Hyperaminoacidaemia reduces insulin-mediated glucose disposal in healthy man. Diabetologia. 1985;28:870–2. doi: 10.1007/BF00291080. [DOI] [PubMed] [Google Scholar]
- 11.Krebs M, Krssak M, Bernroider E, Anderwald C, Brehm A, Meyerspeer M, et al. Mechanism of amino acid-induced skeletal muscle insulin resistance in humans. Diabetes. 2002;51:599–605. doi: 10.2337/diabetes.51.3.599. [DOI] [PubMed] [Google Scholar]
- 12.Peters AL, Davidson MB. Protein and fat effects on glucose responses and insulin requirements in subjects with insulin-dependent diabetes mellitus. Am J Clin Nutr. 1993;58:555–60. doi: 10.1093/ajcn/58.4.555. [DOI] [PubMed] [Google Scholar]
- 13.Pisters PW, Restifo NP, Cersosimo E, Brennan MF. The effects of euglycemic hyperinsulinemia and amino acid infusion on regional and whole body glucose disposal in man. Metabolism. 1991;40:59–65. doi: 10.1016/0026-0495(91)90193-z. [DOI] [PubMed] [Google Scholar]
- 14.Buckspan R, Hoxworth B, Cersosimo E, Devlin J, Horton E, Abumrad N. alpha-Ketoisocaproate is superior to leucine in sparing glucose utilization in humans. Am J Physiol. 1986;251:E648–53. doi: 10.1152/ajpendo.1986.251.6.E648. [DOI] [PubMed] [Google Scholar]
- 15.Flakoll PJ, Wentzel LS, Rice DE, Hill JO, Abumrad NN. Short-term regulation of insulin-mediated glucose utilization in four-day fasted human volunteers: role of amino acid availability. Diabetologia. 1992;35:357–66. doi: 10.1007/BF00401203. [DOI] [PubMed] [Google Scholar]
- 16.Patti ME, Brambilla E, Luzi L, Landaker EJ, Kahn CR. Bidirectional modulation of insulin action by amino acids. J Clin Invest. 1998;101:1519–29. doi: 10.1172/JCI1326. [DOI] [PMC free article] [PubMed] [Google Scholar]
- 17.Khamzina L, Veilleux A, Bergeron S, Marette A. Increased activation of the mammalian target of rapamycin pathway in liver and skeletal muscle of obese rats: possible involvement in obesity-linked insulin resistance. Endocrinology. 2005;146:1473–81. doi: 10.1210/en.2004-0921. [DOI] [PubMed] [Google Scholar]
- 18.Tremblay F, Marette A. Amino acid and insulin signaling via the mTOR/p70 S6 kinase pathway. A negative feedback mechanism leading to insulin resistance in skeletal muscle cells. J Biol Chem. 2001;276:38052–60. doi: 10.1074/jbc.M106703200. [DOI] [PubMed] [Google Scholar]
- 19.Kimball SR, Farrell PA, Jefferson LS. Invited Review: Role of insulin in translational control of protein synthesis in skeletal muscle by amino acids or exercise. J Appl Physiol. 2002;93:1168–80. doi: 10.1152/japplphysiol.00221.2002. [DOI] [PubMed] [Google Scholar]
- 20.Kimball SR, Jefferson LS. Signaling pathways and molecular mechanisms through which branched-chain amino acids mediate translational control of protein synthesis. J Nutr. 2006;136:227S–31S. doi: 10.1093/jn/136.1.227S. [DOI] [PubMed] [Google Scholar]
- 21.Byfield MP, Murray JT, Backer JM. hVps34 is a nutrient-regulated lipid kinase required for activation of p70 S6 kinase. J Biol Chem. 2005;280:33076–82. doi: 10.1074/jbc.M507201200. [DOI] [PubMed] [Google Scholar]
- 22.Nobukuni T, Joaquin M, Roccio M, Dann SG, Kim SY, Gulati P, et al. Amino acids mediate mTOR/raptor signaling through activation of class 3 phosphatidylinositol 3OH-kinase. Proc Natl Acad Sci U S A. 2005;102:14238–43. doi: 10.1073/pnas.0506925102. [DOI] [PMC free article] [PubMed] [Google Scholar]
- 23.Um SH, Frigerio F, Watanabe M, Picard F, Joaquin M, Sticker M, et al. Absence of S6K1 protects against age- and diet-induced obesity while enhancing insulin sensitivity. Nature. 2004;431:200–5. doi: 10.1038/nature02866. [DOI] [PubMed] [Google Scholar]
- 24.Tremblay F, Krebs M, Dombrowski L, Brehm A, Bernroider E, Roth E, et al. Overactivation of S6 kinase 1 as a cause of human insulin resistance during increased amino acid availability. Diabetes. 2005;54:2674–84. doi: 10.2337/diabetes.54.9.2674. [DOI] [PubMed] [Google Scholar]
- 25.Bell JA, Fujita S, Volpi E, Cadenas JG, Rasmussen BB. Short-term insulin and nutritional energy provision do not stimulate muscle protein synthesis if blood amino acid availability decreases. Am J Physiol Endocrinol Metab. 2005;289:E999–1006. doi: 10.1152/ajpendo.00170.2005. [DOI] [PMC free article] [PubMed] [Google Scholar]
- 26.Fujita S, Rasmussen BB, Cadenas JG, Grady JJ, Volpi E. Effect of insulin on human skeletal muscle protein synthesis is modulated by insulin-induced changes in muscle blood flow and amino acid availability. Am J Physiol Endocrinol Metab. 2006;291:E745–54. doi: 10.1152/ajpendo.00271.2005. [DOI] [PMC free article] [PubMed] [Google Scholar]
- 27.Tessari P, Inchiostro S, Biolo G, Vincenti E, Sabadin L. Effects of acute systemic hyperinsulinemia on forearm muscle proteolysis in healthy man. J Clin Invest. 1991;88:27–33. doi: 10.1172/JCI115287. [DOI] [PMC free article] [PubMed] [Google Scholar]
- 28.Nygren J, Nair KS. Differential regulation of protein dynamics in splanchnic and skeletal muscle beds by insulin and amino acids in healthy human subjects. Diabetes. 2003;52:1377–85. doi: 10.2337/diabetes.52.6.1377. [DOI] [PubMed] [Google Scholar]
- 29.Bell JA, Volpi E, Fujita S, Cadenas JG, Rasmussen BB. Dysregulation of muscle fatty acid metabolism in type 2 diabetes is independent of malonyl-CoA. Diabetologia. 2006;49:2144–52. doi: 10.1007/s00125-006-0362-9. [DOI] [PMC free article] [PubMed] [Google Scholar]
- 30.Bell JA, Volpi E, Fujita S, Cadenas JG, Sheffield-Moore M, Rasmussen BB. Skeletal muscle protein anabolic response to increased energy and insulin is preserved in poorly controlled type 2 diabetes. J Nutr. 2006;136:1249–55. doi: 10.1093/jn/136.5.1249. [DOI] [PMC free article] [PubMed] [Google Scholar]
- 31.Wolfe RR, Chinkes DL. Isotope Tracers in Metabolic Research Principles and Practice of Kinetic Analysis. 2. Hobokon, NJ: Wiley-Liss; 2005. [Google Scholar]
- 32.Wang X, Proud CG. The mTOR pathway in the control of protein synthesis. Physiology (Bethesda) 2006;21:362–9. doi: 10.1152/physiol.00024.2006. [DOI] [PubMed] [Google Scholar]
- 33.Volpi E, Sheffield-Moore M, Rasmussen BB, Wolfe RR. Basal muscle amino acid kinetics and protein synthesis in healthy young and older men. Jama. 2001;286:1206–12. doi: 10.1001/jama.286.10.1206. [DOI] [PMC free article] [PubMed] [Google Scholar]
- 34.Cherel Y, Attaix D, Rosolowska-Huszcz D, Belkhou R, Robin JP, Arnal M, et al. Whole-body and tissue protein synthesis during brief and prolonged fasting in the rat. Clin Sci (Lond) 1991;81:611–9. doi: 10.1042/cs0810611. [DOI] [PubMed] [Google Scholar]
- 35.Volpi E, Kobayashi H, Sheffield-Moore M, Mittendorfer B, Wolfe RR. Essential amino acids are primarily responsible for the amino acid stimulation of muscle protein anabolism in healthy elderly adults. Am J Clin Nutr. 2003;78:250–8. doi: 10.1093/ajcn/78.2.250. [DOI] [PMC free article] [PubMed] [Google Scholar]
- 36.Smith K, Reynolds N, Downie S, Patel A, Rennie MJ. Effects of flooding amino acids on incorporation of labeled amino acids into human muscle protein. Am J Physiol. 1998;275:E73–8. doi: 10.1152/ajpendo.1998.275.1.E73. [DOI] [PubMed] [Google Scholar]
- 37.Anthony TG, Reiter AK, Anthony JC, Kimball SR, Jefferson LS. Deficiency of dietary EAA preferentially inhibits mRNA translation of ribosomal proteins in liver of meal-fed rats. Am J Physiol Endocrinol Metab. 2001;281:E430–9. doi: 10.1152/ajpendo.2001.281.3.E430. [DOI] [PubMed] [Google Scholar]
- 38.O’Connor PM, Kimball SR, Suryawan A, Bush JA, Nguyen HV, Jefferson LS, et al. Regulation of translation initiation by insulin and amino acids in skeletal muscle of neonatal pigs. Am J Physiol Endocrinol Metab. 2003;285:E40–53. doi: 10.1152/ajpendo.00563.2002. [DOI] [PubMed] [Google Scholar]
- 39.Biolo G, Williams BD, Fleming RY, Wolfe RR. Insulin action on muscle protein kinetics and amino acid transport during recovery after resistance exercise. Diabetes. 1999;48:949–57. doi: 10.2337/diabetes.48.5.949. [DOI] [PubMed] [Google Scholar]
- 40.Crozier SJ, Kimball SR, Emmert SW, Anthony JC, Jefferson LS. Oral leucine administration stimulates protein synthesis in rat skeletal muscle. J Nutr. 2005;135:376–82. doi: 10.1093/jn/135.3.376. [DOI] [PubMed] [Google Scholar]
- 41.Anthony JC, Anthony TG, Kimball SR, Vary TC, Jefferson LS. Orally administered leucine stimulates protein synthesis in skeletal muscle of postabsorptive rats in association with increased eIF4F formation. J Nutr. 2000;130:139–45. doi: 10.1093/jn/130.2.139. [DOI] [PubMed] [Google Scholar]
- 42.Fujita S, Dreyer HC, Drummond MJ, Glynn EL, Cadenas JG, Yoshizawa F, et al. Nutrient signalling in the regulation of human muscle protein synthesis. J Physiol. 2007;582:813–23. doi: 10.1113/jphysiol.2007.134593. [DOI] [PMC free article] [PubMed] [Google Scholar]
- 43.Liberman Z, Eldar-Finkelman H. Serine 332 phosphorylation of insulin receptor substrate-1 by glycogen synthase kinase-3 attenuates insulin signaling. J Biol Chem. 2005;280:4422–8. doi: 10.1074/jbc.M410610200. [DOI] [PubMed] [Google Scholar]
- 44.Thong FS, Bilan PJ, Klip A. The Rab GTPase-activating protein AS160 integrates Akt, protein kinase C, and AMP-activated protein kinase signals regulating GLUT4 traffic. Diabetes. 2007;56:414–23. doi: 10.2337/db06-0900. [DOI] [PubMed] [Google Scholar]
- 45.Terruzzi I, Allibardi S, Bendinelli P, Maroni P, Piccoletti R, Vesco F, et al. Amino acid- and lipid-induced insulin resistance in rat heart: molecular mechanisms. Mol Cell Endocrinol. 2002;190:135–45. doi: 10.1016/s0303-7207(02)00005-9. [DOI] [PubMed] [Google Scholar]
- 46.Hillier TA, Fryburg DA, Jahn LA, Barrett EJ. Extreme hyperinsulinemia unmasks insulin’s effect to stimulate protein synthesis in the human forearm. Am J Physiol. 1998;274:E1067–74. doi: 10.1152/ajpendo.1998.274.6.E1067. [DOI] [PubMed] [Google Scholar]