

Abstract
CD8+ cytotoxic T lymphocyte (CTL) activity is currently believed to be one of the key immunologic mechanisms responsible for the prevention or attenuation of HIV-1 infection. The induction of CD8+ T cell activation may also result in the production of soluble or non-classical lytic factors that are associated with protection from infection or slower disease progression. Traditionally, CD8+ CTL responses have been measured by the classic chromium release assay, monitoring the ability of T cells (Effector cells) to lyse radiolabelled HLA – matched “target cells” that express the appropriate antigen-MHC complex. This method is not only labor intensive, semi quantitative assay at best, but also needs fresh, non-cryopreserved cells. Recently, cytokine specific ELISPOT assays or tetrameric MHC-I/ peptide complexes have utilized to directly quantitate circulating CD8+ effector cells, and these assays are more sensitive, quantitative and reproducible than the traditional CTL lysis assay and can also be performed on cryopreserved cells. Although these are reproducible assays for the assessment of soluble antiviral activity secreted by activated T cell populations they can be extremely expensive to perform. We have used FACS Analysis to measure Granzyme B release as a function of cell mediated cytotoxicity. This method helps quantitate the CTL activity and also identifies the phenotype of the cells elucidating this immune response. The method described not only monitors immunological response but also is also simple to perform, precise and extremely time efficient and is ideal for screening a large number of samples.
Keywords: CD8-Positive T-Lymphocytes; HIV; Killer Cells, Natural
Introduction
Cytotoxic T lymphocytes (CTL) act as mediators of destruction of immune function during HIV infection (1). Human immunodeficiency virus (HIV) – specific cytotoxic T cell lymphocytes (CTL) play a major role in control of viral replication, however a complete understanding of the specific epitopes targeted by CTL is essential to assess this antiviral response (1). Naïve T cells are activated to proliferate and differentiate into armed effector cells by recognition of a foreign peptide fragment bound to a self-MHC molecule and delivery of co- stimulatory signals by antigen presenting cells. The effector cells are triggered when their antigen specific receptors and either the CD4 or the CD8 co- receptors bind to the peptide: MHC complex on a target cell. Effector T cells can mediate a variety of functions. Some of the functions are killing of infected cells by the CTLs and the activation of the macrophages by the Th1 cells which together make up cell – mediated immunity (1, 2). Cytotoxic T lymphocytes (CTL) function to destroy cells that express foreign antigens. CTL play an important role in the elimination of virally infected cells. The majority of virus-specific CTL are CD8+. In contrast to CD4+ helper cells, which recognize antigen presented in the context of class II major histocompatibility complex (MHC) molecules, CTL recognize antigens in the context of class I MHC molecules. The importance of this distinction is that most of the time antigens need to be produced inside the cell in order to be presented by class I molecules. By contrast, antigens presented by class II MHC molecules can be taken up by antigen presenting cells, processed, and then presented to CD4+ cells. Assays for detection of CTLs have relied on direct determination of cell lysis as measured by the classical assay for CTL activity namely the chromium release assay (1, 3). Effector Cytotoxic T Lymphocytes (CTL) bind targets (infected cells) bearing virus peptide on syngenic (self) Class I MHC and signal the targets to undergo apoptosis. If the targets are labeled with 51Chromium before the CTL are added, the amount of 51Cr released into the supernatant is proportional to the number of targets killed. HIV-specific lysis is calculated by comparing lysis of target cells expressing HIV or control antigens in the presence or absence of patient effector cells, and is usually expressed as the % HIV-specific lysis. Percent specific cytotoxicity is calculated by (specific release - spontaneous release) ÷ (maximum release - spontaneous release) and may be 20%-85% for a positive assay. Percent specific cytotoxicity is usually determined at several ratios of effector (CTL) to target cells (E:T). While this assay measures an effector characteristic of CD8+ T cells, it is cumbersome and technically difficult to perform. Additionally, the standard lytic assay is qualitative and must rely on a limiting dilution analysis (LDA) for quantitative results, and the LDA frequently underestimates the true level of CTL response. One of the major limitations of the assay is that the frequency of specific CTL is very low in a primary response and CTL are difficult to activate in vitro. For these reasons, the 51Cr release assay is usually done with cells stimulated in vivo. Although CTL can each kill many targets in vivo, in vitro this assay requires numbers of CTL equal to or greater than the number of targets for detectable killing (3).
In recent years, newer assays allowing for easier assessment of CTL responses have been developed. Yet another method of measuring cytotoxicity, is the ELISPOT assay where the CD8+ CTL response, which can be assessed by measuring IFN-γ production by HIV-specific effector cells, is quantitated by measuring the number of Spot Forming Units (SFU) under a stereomicroscope (4). In this assay, antigen-presenting cells (APC) are immobilized on the plastic surface of a micro titer well, and effector cells are added at various effector:target ratios. The binding of APC's by antigen-specific effector cells triggers the production of cytokines including IFN-γ by the effector cells (5). More recently a method for quantifying the number of circulating antigen-specific CD8+ T cells namely the tetramer assay is being increasingly used to measure CTL activity. In this assay, a specific epitope is bound to synthetic tetrameric forms of fluorescent labeled MHC Class I molecules. Since CD8+ T cells recognize antigen in the form of short peptides bound to Class I molecules, cells with the appropriate T cell receptor will bind to the labeled tetramers and can be quantified by flow cytometry. Although this method is less time-consuming than the ELISPOT assay, the tetramer assay measures only binding, not function. Not all cells that bind a particular antigen necessarily become activated. Also diversity of both HIV-1 and host MHC alleles can affect cellular immune responses. MHC alleles differ in the specific epitopes they present to T cells (4, 6, 7). These differences, which presumably could influence cytolytic and helper T cell responses, are thought to explain data correlating different HLA alleles with different rates of clinical progression.
The method outlined in this manuscript is based on the fact that the two dominant mechanisms of lymphocyte- mediated cytotoxicity are the perforin /granzyme mediated killing and the death receptor – mediated killing (8). The perforin- dependent pathway is dominant in CD8+ CTL and natural killer (NK) cells. The death receptor mediated pathway appears to be active in all killer cell lineages but most important for CD4+ cells, especially those of the Th1 phenotype. Cytoplasmic granules from activated natural killer (NK) and Cytotoxic T lymphocytes (CTL) contain a pore forming protein, perforin and several homologous serine proteases called Granzymes (8). Granzyme B is known to be present in the cytotoxic granules of NK cells and activated CTLs with cytotoxic potential. Thus a methodology based on measurement of cell mediated cytotoxicity as a function of Granzyme B release by effector cells and simultaneous analysis of effector cell phenotype as well as viability in the same sample by flow cytometry under conditions that ensure reliable discrimination of target and effector cells would be ideal in monitoring patients immune response. The basic principle of simultaneous analysis of cell mediated cytotoxicity and effector cell phenotype by flow cytometry was adapted from a method by Derby et al. (9). Although the various assays for measuring CTL have improved over the last five years, many are performed only in research laboratories and have not been validated for clinical use.
Materials and Methods
Cells from a HIV-1 transfected human T-cell line 8E5/LAV (Catalog # 95, AIDS Research and Reference reagent program catalog, NIH, Rockville, MD) were used as target cells and the PBMC isolated from the HIV patients and non-HIV controls were used as the effector cells.
Cell culture
The 8E5/LAV target cells were cultured in phenol-red free RPMI 1640 complete media supplemented with 10% FCS, 2mM glutamine, 1mM pyruvate, 100 U/ml penicillin, 100 ug/ml streptomycin and 50 ug/ml gentamycin (Invitrogen-Life Technologies, Carlsbad, CA).
Isolation of peripheral blood mononuclear cells
Peripheral blood mononuclear cells (PBMCs) were isolated from venous blood of HIV patients and normal human volunteers by buoyant density centrifugation over Ficoll-Paque gradient (Amersham Pharmacia Biotech, Piscataway, NJ). The aliquots of the effector cells in 10% DMSO and 90% FBS were cryopreserved in vapor phase of liquid nitrogen for future use in functional testing and FACS Analysis.
Labeling of target cells with PKH67
To discriminate between effector and target cells, the 8E5/LAV target cells are labeled with PKH67, a green fluorescent probe, (Sigma, St. Louis, MO) which becomes incorporated into the plasma membrane. 1million target LAV/8E5 cells are washed in PBS and resuspended in 250 ul of Solution C from the PKH67 green fluorescent cell linker kit. The PKH67 dye is diluted to 4 X10⁻⁶ M in 250 μl of solution C. The Cells are combined with the dye and the tube inverted several times without vortexing for 3-5 mins. 500 μl of FCS is then added and the tube is mixed for another 1 min. Cells are then washed 3 times with phenol-red free RPMI 1640 complete media.
CTL induction
Effector cells (PBMC isolated from HIV patients and normal controls) are stimulated with PMA (25 ng/ml) and calcium ionophore (50ng/ml), and rIL-2 (20U/ml) are incubated at 37°C, 5% CO2 for a period of 7 days for CTL induction. CTLs can be generated from precursor T lymphocytes following polyclonal activation induced by activating lymphokines such as IL-2. IL-2 activated cytotoxic cells are usually referred to as lymphokine activated killer cells (LAK). LAK cells derived from peripheral lymphocytes are composed of T cells as well as activated NK cells.
Cytotoxicity assay
After the CTL induction process the effector cells are mixed with a fixed number (104 cells) of PKH67 labeled target cells at various E:T ratios of 1:1. 10:1, 25:1 and 50:1. The effector and targets are incubated together at 37°C, 5% CO2 for 4 hours, at the end of the incubation cells are fixed, permeabilised (for intracellular granzyme B staining) and washed with PBS three times. Cells labeled with phycoerythrin conjugated anti Granzyme B antibody (Pelicluster Inc, Amsterdam, Clone GB11) and phycoerythrin conjugated Annexin-V in separate tubes. Cells are incubated in dark on ice for 30 minutes. Appropriate Isotype control (IgGк1) is included in all experiments. The viability of the PBMC, which were retrieved from liquid nitrogen storage, was about 85-95%.
FACS Analysis
The Annexin V (BD Pharmingen, Inc.) and 7-ADD (Sigma) staining by the target cells was quantitated by using an R1 gate specific for the target cell population, while the Granzyme B release by the effector cells was quantitated by using a R2 gate on the effector cell population, when samples were analysed on a FACScan flow cytometer (Becton Dickinson). A minimum of 5000 events were gated and analyzed using R1 as a gate for the target cells alone and R2 as a gate for the effector cells alone. FL-1 at 530/30nm quantitated PKH-67 and FL-2 at 585/42 nm quantitated PE labeled Granzyme B and Annexin V. Percentage of target cells expressing Annexin V/7-ADD and the percentage of effector cells expressing Granzyme B were calculated. Annexin V/7-ADD expression reflected cell death among the PKH67 stained target cells and the percentage of effector cells stained with PE conjugated anti Granzyme B reflected the increased cytotoxic activity as the ratio of effector to target cells increases.
Further to establish which population of the effector cells were contributing to the cytotoxic activity, a separate experiment was conducted to quantitate the effector cells which stained positive for either/or PE labeled CD8/CD69 monoclonal anti bodies, a minimum of 2500 events were collected and analyzed. The percentage cytotoxic activity induction by the effector cell population in the PBMC could thus be attributed to CD8 cells or NK cells. Using this methodology we analyzed a total of 10 samples in each group, from patients with active HIV disease and normal non-HIV controls.
Statistical Analysis
Data are expressed as the Mean + SD. Statistical significance was determined using paired two-tailed Student’s t-test. Differences were considered statistically significant for p<0.05 (Shown in asterisks in figures). Statistical analysis was performed using the SPSS statistical software package.
Results
The method outlined in this manuscript is a flow cytometric assay where gating is based on the difference in florescence of target cells before and after labeling with PKH67, a green fluorescent probe that gets incorporated into the plasma membrane of the target cells. Figure 1 shows the target and effector cells together and the gates being used for FACS Analysis. The PKH67 labeled LAV/8E5 (target cells) are gated using gate R1 and the unlabelled PBMC (effector cells) are gated using gate R2.
Fig. 1. Shows R1 gate around the Target cells, and R2 gate around the Effector cells.
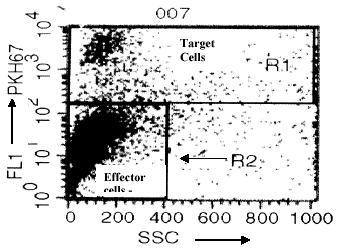
The Target cells are labeled with PKH 67 and represented on the Y axis (FL-1), X-axis represents side scatter.
Annexin-V and 7ADD positive cells among the gated target cells stained with PKH67 dye
Apoptosis or cell death is characterized by a variety of morphological changes like changes in the plasma membrane. Annexin-V staining precedes the loss of membrane integrity which accompanies the latest stages of cell death resulting from apoptosis. Annexin-V in conjunction with 7-amino-actinomycin D helps identify early apoptotic cells. 7ADD is used to evaluate the increased membrane permeability of target cells due to the granzyme mediated cytotoxic action of effector cells. Data at the end of the four-hour cytotoxicity assay, depicted in Figure 2 shows that on gating target cells alone (R1), there is a significant increase in Annexin-V and 7ADD staining of target cells as the effector cells to target cell ratio increases, the increase in Annexin-V binding was from 9.5%, 18.26%, 34.39 and 42.19% at an E:T ratios of 1:1, 10:1, 25:1 and 50:1 respectively, and an similar increase in 7ADD binding was from 7.52%, 17.85%, 29.16 and 42.10% at an E:T ratios of 1:1, 10:1, 25:1 and 50:1 respectively were observed, both data suggesting a increase cytolytic activity with increase in the effector cell population.
Fig. 2. Representative FACS analysis data showing the percentage of staining of Annexin-V / and 7ADD from the target cells and using an R1 gate after the 4 hr cytotoxicity assay with E: T ratios of 1:1, 10:1, 25:1 and 50:1 respectively.
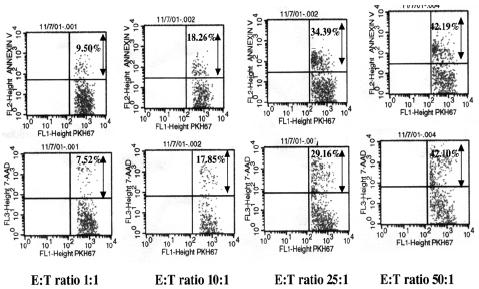
Percent Annexin V and 7-ADD is represented on the FL-2 axis (PE).
Granzyme B expression by effector PBMC in normal and HIV subjects
Figure 3 indicates the increase in Granzyme B expression in the effector PBMCs from normal controls and HIV subjects, the granzyme B expression in normal controls was 0.98%, 3.87%, 6.25% and 6.76% and in HIV subjects was 3.15%, 9.28%, 13.72% and 16.49% at an E:T ratios of 1:1, 10:1, 25:1 and 50:1 respectively, suggesting a increase cytolytic activity as the E:T ratio increases.
Fig. 3. Representative FACS Analysis data from normal and HIV patient showing granzyme B expression.

A: Shows Isotype control (IgGk1) used for setting the regions. Figure B a, b, c, d and Figure C a, b, c, d shows the percentage of Granzyme B release from the effector cells of normal controls and the HIV patients using an R2 gate after the 4 hr cytotoxicity assay with E: T ratios of 1:1, 10:1, 25:1 and 50:1 respectively. Percent Granzyme B expression is represented on the FL-2 axis (PE).
Figure 4 shows data from HIV patients (n=10) and normal non-HIV controls (n=10) which shows that there is a significantly enhanced CTL response as measured by the percent granzyme B release by the effector cells (R2 gate) in HIV infected subjects as compared to the normal non-HIV controls. The mean granzyme B expression in HIV subjects was 3.15 + 0.71%, 8.28 + 1.1 %, 14.2 + 2.5% and 17.12 + 2.9% at an E: T ratios of 1:1, 10:1, 25:1 and 50:1 respectively while the mean granzyme B expression in non-HIV control subjects was 0.45 + 0.37%, 4.66 + 1.4 %, 6.41 + 1.3% and 6.99 + 1.6% at an E: T ratios of 1:1, 10:1, 25:1 and 50:1 respectively Data presented is the mean + SD of 3 experiments where the total of 10 subjects in each group. Statistical analysis of the data indicated that the % granzyme B expression at E: T ratio of 1:1, 10:1 25:1 and 50: 1 were significantly higher (p<0.05, p<0.01, and p>0.0001) respectively in HIV subjects as compared to normal non-HIV controls. Further, data presented in Figure 5 shows that the HIV infected subjects showed significantly higher CD8 (39.2 + 2.44 %) (P<0.01), and CD69 (6.88+1.2 %) (p<0.05), expression as compared to the control group [(CD8) 16.8+1.96%), (CD69) (2.43+0.32%)] indicating a heightened immune response.
Fig. 4. Histogram representation of the percent Granzyme B expression in HIV subjects and normal controls as measured by the Granzyme B release CTL assay.
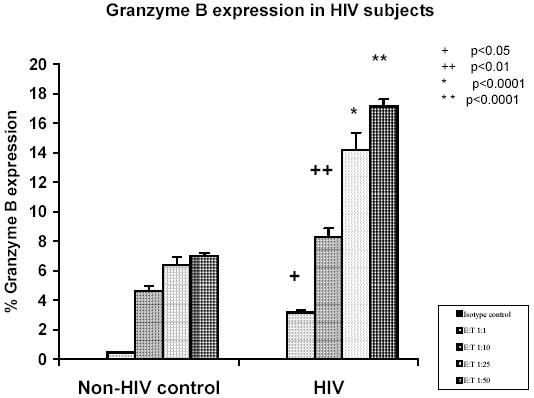
Data presented is the mean + SD of 3 experiments where the total of 10 subjects in each group.
Fig. 5. Representative histogram of the percent CD8 and CD69 (NK cells) expression in the effector cells in HIV subjects and normal controls as measured by flow cytometry.
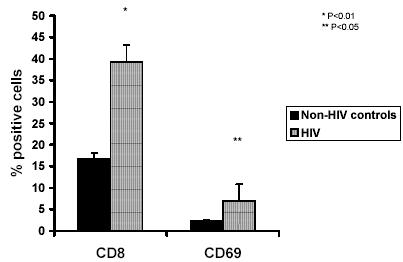
Data presented is the mean + SD of 3 experiments where the total of 10 subjects in each group.
Data presented is the mean + SD of 3 experiments where the total of 10 subjects in each group. There exist a positive correlation (Correlation coefficient r=+0.959) between the ratio of the effector cells and the percentage of Annexin-V positive cells, and the also a positive correlation between Annexin-V and 7ADD expression (r=+0.998).
Discussion
Several methodologies exist for quantitation of active-reactive T cells in peripheral blood mononuclear cells, but many of the T cell assays are technically difficult to perform (3). The classical 51 Chromium – release cytotoxic T cell (CTL) assays are cumbersome and difficult to quantitate reproducibly. Other methods like the detection of specific T cell – using MHC-peptide tetrameric complexes are highly sensitive, but require knowledge of MHC type and prior identification of T cell epitopes. The responses to a complex antigen such as HIV involves T-cell clonotypes specific for a number of different MHC- peptides combinations that are different in each individual. These drawbacks are overcome by the use of functional assays such as ELISPOT or multiparameter cytokine flow cytometry analysis, that detect cytokine production by antigen specific T cells and also correlate with cytotoxic activity. Although the ELISPOT assay is an attractive alternative to the cumbersome 51Cr-release assay and tetramer assay and also measures cellular responses, they use an optical plate reader for sample analysis and are therefore restricted to one or two parameter detection, thus a multiparameter flow cytometry analysis is highly reproducible, less cumbersome and extremely reliable.
The assay described in the present manuscript is based on the fact that cytotoxic T lymphocytes kill virus infected and tumor cell targets through the concerted action of proteins contained in cytolytic granules, primarily granzyme B. Granzymes are exogenous serine proteinases (enzymes) that are released from cytoplasmic granules of cytotoxic lymphocytes (CTLs) and NK cells (4). These granules contain next to granzymes other proteins including a pore-forming protein (Perforin). Upon binding of the CTL to a target cell (by CTL-receptor and antigen-presenting MHC molecules on the target cell) the contents of the granules are released in the intercellular space where after perforine will “perforate” the target cell membrane by forming transmembrane pores. Through these pores the granzymes can now enter the cytosol of the target cell. Granzyme B activates the intracellular cascade of caspases finally resulting in the killing of the target cells. The percentages of granzyme B positive effector cells can be determined by flow cytometry. In a cell undergoing apoptosis, loss of cell membrane integrity is a very late event usually preceded by the destructive action of endogenous cellular enzymes (10). The ability to exclude viable dyes such as trypan blue, propidium iodide (PI) or 7-aminoactinomycin D (7AAD) is a property of cells that have an intact plasma membrane. Cells in the early phases of apoptosis fall into this category. The utility of annexin V in flow cytometry applications is derived from its selective affinity for negatively charged phospholipids (11, 12). Annexin V can selectively bind to cells with a compromised membrane phospholipid asymmetry and this property has been exploited to identify populations of cells undergoing apoptosis from the target cell population.
The fact that from very early stages of HIV-1 infection a large number of killing competent T lymphocytes are present in blood, supports the premise that CTL act as mediators of destruction of immune function during HIV infection. Since granzyme B constitutes the major effector molecule within effector cytotoxic T lymphocytes that induce apoptosis and lysis of virally infected cells, a method such as the one outlined is clearly very important in the assessment of immune response of the HIV patient undergoing antiretroviral therapy.
Conclusions
A reliable procedure to measure antigen specific T cell response is required in a number of clinical vaccine trials to determine the efficacy of vaccines and immunotherapies. Study of HIV-specific CTLs in various stages of disease provides important insights into AIDS pathogenesis and ultimately may lead to development of effective vaccine strategies. This method not only helps quantitate the CTL activity but also identifies the phenotype of the cells elucidating this immune response. Yet another important application of this method is to measure antitumoral immune response in immunocompetent individuals since cytotoxic T lymphocytes represent a major mechanism of the antitumoral immune response. Thus the potential use of this methodology for monitoring immunological responses is enormous, particularly in view of the fact that the method is simple, precise and extremely time and cost effective.
Acknowledgments
The authors would like to thank Ms. Elizabeth Hemedinger in the Department of Histocompatibility and Immunogenetics, Buffalo General Hospital, Kaleida Health System, 100 High Street, Buffalo, NY 14203 for her assistance in using the FACScan analyzer and Dr. Steven. P. Brooks for his kind suggestions and critique of our manuscript.
Abbreviations
- CTL
Cytotoxic T lymphocyte
- HIV
Human immunodeficiency virus
- NK
natural killer
- PI
propidium iodide
- 7AAD
7-aminoactinomycin D
- PBMCs
peripheral blood mononuclear cells
- E:T
Effector: Target
- R1/R2
Region 1/Region 2
- FL-1
fluorescence axis 1
- FL-2
fluorescence axis 2
- SSC
side scatter
- PE
phycoerythrin
Appendix
Protocols
1. Cell culture
8E5/LAV cells were cultured in phenol-red free RPMI 1640 complete media supplemented with 10% FCS, 2mM glutamine, 1mM pyruvate, 100 U/ml penicillin, 100 ug/ml streptomycin and 50 ug/ml gentamycin.
2. Isolation of peripheral blood mononuclear cells
Peripheral blood mononuclear cells (PBMCs) were isolated from whole blood by buoyant density centrifugation over Ficoll-HyPaque gradient.
Whole blood (10ml) was diluted with equal volume of Hanks balanced salt solution and then slowly layered over 5 ml of Ficoll.
Cells are centrifuged at 1800 rpm for 30 minutes in a refrigerated centrifuge.
The PBMC present in the cloudy interface are then transferred to another sterile culture tube and washed with Hanks balanced salt solution and centrifuged at 3000rpm for 10 minutes. This wash step is repeated thrice.
The isolated PBMC suspended at a concentration of 1million cells/ml in 10% DMSO and 90% FBS, aliquoted and were cryopreserved in vapor phase of liquid nitrogen for future use.
3. Labeling of target cells with PKH67
LAV/8E5 cells {1 million/ml} are washed in PBS and resuspended in 250 μl of Solution C from the PKH67 green fluorescent cell linker kit.
PKH67 dye is diluted to 4 X10⁻⁶ M in 250 μl of solution C.
Cells are mixed with the dye and the tube inverted several times without vortexing for 3-5 mins.
500ul of FCS is then added and the tube is mixed for another 1 min.
Cells are then washed 3 times and then resuspended in with phenol-red free RPMI 1640 complete media.
4. CTL induction
Cryopreserved PBMC (1million/ml) isolated from HIV patients and normal controls are quick thawed in a 37°C water bath and washed in PBS to remove the DMSO and then resuspended in warm phenol-red free RPMI 1640 complete culture media.
PBMC are stimulated with PMA (25 ng/ml), calcium ionophore (50ng/ml), and rIL-2 (20U/ml) and are incubated at 37°C, 5% CO2 for a period of 7 days for CTL induction.
5. Cytotoxicity assay
PBMC effector cells and the PKH67 labelled target cells are mixed at E:T ratios of 1:1, 10:1, 25:1, and 50:1 (shown in table 1) and incubated together at 37°C, 5% CO2 for 4 hours.
Table 1.
Cytotoxicity assay
| E:T ratio | PBMC (1000000 cells/ml) Volume added in μl | PKH67 labelled LAV/8E5 cells (1000000 cells/ml) Volume added in μl |
| 1:1 | 10 μl (10000 cells) | 10 μl (10000 cells) |
| 10:1 | 100 μl (100000 cells) | 10 μl (10000 cells) |
| 25:1 | 250 μl (250000 cells) | 10 μl (10000 cells) |
| 50:1 | 500 μl (500000 cells) | 10 μl (10000 cells) |
6. FACS Analysis
After the cytotoxicity assay cells are fixed, permeabilised with BD Cytofix/CytopermTM Buffer.
Cells washed with PBS three times.
Cells resuspended in staining buffer Dulbecco’s PBS with 3% heat inactivated FBS and 0.09% (w/v) sodium azide.
Cells labeled with phycoerythrin conjugated anti Granzyme B antibody (5 μl/tube) and phycoerythrin conjugated Annexin- V (5 μl/tube) and Isotype control (IgGк1) (5 μl/tube) in separate tubes.
Cells incubated in dark on ice for 30mins.
Wash cells 1X by adding 1 ml of BD Perm/Wash buffer, centrifuge 5 mins at 3000rpm and discard supernatant.
Resuspend cells in 500 μl of staining buffer per tube.
Analyze stained cells with flow cytometer.
References
- Walker BD, Chakrabarti S, Moss B, Paradis TJ, Flynn T, Durno AG, Blumberg RS, Kaplan JC, Hirsch MS, Schooley RT. HIV-specific cytotoxic T lymphocytes in seropositive individuals. Nature. 1987;328:345–348. doi: 10.1038/328345a0. [DOI] [PubMed] [Google Scholar]
- Mackewicz CE, Yang LC, Lifson JD, Levy JA. Non-cytolytic CD8 T-cell anti-HIV responses in primary HIV-1 infection. Lancet. 1994;344:1671–1673. doi: 10.1016/s0140-6736(94)90459-6. [DOI] [PubMed] [Google Scholar]
- Scheibenbogen C, Romero P, Rivoltini L, Herr W, Schmittel A, Cerottini JC, Woelfel T, Eggermont AM. Quantitation of antigen reactive T cells in peripheral blood by IFN gamma – ELISPOT assay and Chromium – release assay: a four center comparative trial. J Immunol Methods. 2000;244(1-2):81–89. doi: 10.1016/S0022-1759(00)00257-X. [DOI] [PubMed] [Google Scholar]
- Rininsland FH, Helms T, Asaad RJ, Boehm BO, Tary-Lehmann M. Granzyme B ELISPOT assay for ex vivo measurements of T cell Immunity. J Immunol Methods. 2000;240(1-2):143–155. doi: 10.1016/S0022-1759(00)00191-5. [DOI] [PubMed] [Google Scholar]
- Murali-Krishna K, Altman JD, Suresh M, Sourdive D, Zajac A, Ahmed R. In vivo dynamics of anti-viral CD8 T cell responses to different epitopes. An evaluation of bystander activation in primary and secondary responses to viral infection. Adv Exp Med Biol. 1998;452:123–142. doi: 10.1007/978-1-4615-5355-7_14. [DOI] [PubMed] [Google Scholar]
- Altman JD, Moss PA, Goulder PJ, Barouch DH, McHeyzer-Williams MG, Bell JI, McMichael AJ, Davis MM. Phenotypic analysis of antigen-specific T lymphocytes. Science. 1996;274(5284):94–96. doi: 10.1126/science.274.5284.94. [DOI] [PubMed] [Google Scholar]
- Goepfert PA, Bansal A, Edwards BH, Ritter GD Jr, Tellez I, McPherson SA, Sabbaj S, Mulligan MJ. A significant number of human immunodeficiency virus epitope- specific cytotoxic T lymphocytes detected by tetramer binding do not produce gamma interferon. J Virol. 2000;74(21):10249–10255. doi: 10.1128/JVI.74.21.10249-10255.2000. [DOI] [PMC free article] [PubMed] [Google Scholar]
- Kummer JA, Kamp AM, Tadema TM, Vos W, Meijer CJ, Hack CE. Localization and identification of granzymes A and B-expressing cells in normal human lymphoid tissue and peripheral blood. Clin Exp Immunol. 1995;100(1):164–172. doi: 10.1111/j.1365-2249.1995.tb03619.x. [DOI] [PMC free article] [PubMed] [Google Scholar]
- Derby E, Reddy V, Baseler M, Malyguine A. Flow cytometric assay for the simultaneous Analysis of cell mediated cytotoxicity and effector cell phenotype. Biotechniques. 2001;31:660–665. doi: 10.2144/01313dd03. [DOI] [PubMed] [Google Scholar]
- Kroemer G. The pharmacology of T cell apoptosis. Adv Immunol. 1995;58:211–296. doi: 10.1016/s0065-2776(08)60621-5. [DOI] [PubMed] [Google Scholar]
- Koopman G, Reutelingsperger CP, Kuijten GA, Keehnen RM, Pals ST, van Oers MH. Annexin V for flow cytometric detection of phosphatidylserine expression on B cells undergoing apoptosis. Blood. 1994;84(5):1415–1420. [PubMed] [Google Scholar]
- Vermes I, Haanen C, Steffens-Nakken H, Reutelingsperger C. A novel assay for apoptosis. Flow cytometric detection of phosphatidylserine expression on early apoptotic cells using fluorescein labelled Annexin V. Immunol Methods. 1995;184(1):39–51. doi: 10.1016/0022-1759(95)00072-i. [DOI] [PubMed] [Google Scholar]