

Abstract
AIMS
The aim of the present study was to evaluate the impact of adiponectin allele T45G and C-11377G genetic polymorphisms on efficacy of rosiglitazone in Chinese patients with type 2 diabetes (T2D).
METHODS
Patients with T2D (n = 255) and 120 healthy volunteers were enrolled to identify 45T/G and –11377C/G genotypes by polymerase chain reaction-restriction fragment length polymorphism assay. Forty-two T2D patients with different 45T/G or –11377C/G genotypes received orally rosiglitazone as a single-dose therapy (4 mg day-1 p.o.) for 12 weeks. Serum triglyceride, fasting plasma glucose (FPG), postprandial plasma glucose (PPG), glycated hemoglobin, fasting serum insulin, postprandial serum insulin, total cholesterol, homeostasis model assessment for insulin resistance (HOMA-IR), low-density lipoprotein-cholesterol, high-density lipoprotein-cholesterol (HDL-c) and adiponectin concentration were determined before and after rosiglitazone treatment.
RESULTS
We showed an attenuated rosiglitazone effect in patients with –11377CG+GG heterozygote genotype on FPG, PPG, HOMA-IR compared with –11377CC homozygote genotype. However, we found an enhanced rosiglitazone effect on serum adiponectin concentration in patients with –11377CC homozygote genotype compared with –11377CG+GG heterozygote genotype (P = 0.000) and in patients with 45TG + GG heterozygote genotype compared with 45TT homozygote genotype (P = 0.018). Finally, our results showed that there was an enhanced effect in patients with –11377/45 CGTT diplotype compared with other discovered diplotypes on FPG (P = 0.001) and PPG (P = 0.003) after rosiglitazone treatment.
CONCLUSIONS
These data suggest that the adiponectin allele 45T/G and –11377C/G polymorphisms are significantly associated with the therapeutic efficacy of multiple-dose rosiglitazone in Chinese patients with T2D.
WHAT IS ALREADY KNOWN ABOUT THIS SUBJECT
Rosiglitazone is able to increase serum adiponectin levels significantly in Type 2 diabetic patients.
The role of genetic factors that determine the marked interindividual variability in glucose-lowering efficacy of rosiglitazone in Chinese patients is not known.
The current study was designed to evaluate the impact of the adiponectin common allele 45T/G and −11377C/G polymorphisms on the response to rosiglitazone monotherapy in Chinese patients with Type 2 diabetes (T2D).
WHAT THIS STUDY ADDS
The genetic polymorphisms of adiponectin alleles 45T/G and −11377C/G as well as their common diplotypes are significantly associated with an attenuated fasting plasma glucose, postprandial plasma glucose and homeostasis model assessment for insulin resistance as well as an enhanced adiponectin concentration in Chinese patients with T2D after rosiglitazone treatment.
Keywords: C-11377G polymorphism, T45G polymorphism, adiponectin, diplotype, rosiglitazone efficacy, Type 2 diabetes
Introduction
Adiponectin is one of the important adipocytokines secreted by adipocytes, which play an important role in the regulation of insulin sensitivity and glucose homeostasis in the human body [1]. Serum adiponectin concentrations obviously decrease in patients with Type 2 diabetes mellitus, obesity and/or coronary heart disease [2]. At present, adiponectin is generally considered to be a potent insulin sensitizer. Rosiglitazone, one of the thiazolidinedione medicines, is widely used in the treatment of patients with Type 2 diabetes (T2D). It is able to increase serum adiponectin concentrations and decrease blood glucose level as well as improve insulin sensitivity by activating the peroxisome proliferator-activated receptor-gamma (PPAR-γ) [3]. However, there is marked interindividual variability in therapeutic response and adverse drug reaction to rosiglitazone. It is essential to investigate the possible mechanisms of and reasons for attenuated response or treatment failure associated with rosiglitazone therapy in different human populations.
Adiponectin is encoded by the adipose most abundant gene transcript 1 (APM1) located on chromosome 3q27 [4, 5]. Genetic variations of the APM1 gene result in hypoadiponectinaemia accompanied with insulin resistance, diabetes and cardiovascular disease [2, 4]. Kang et al. reported that the genetic polymorphisms of adiponectin gene had an effect on circulating adiponectin levels and blood glucose control in patients with T2D treated with rosiglitazone [6]. Mutation screening of APM1 gene in Japanese and French populations recently showed 16 single nucleotide polymorphisms (SNPs) in the APM1 gene [7]. Of the above 16 SNPs, the most common variants were T45G in exon 2, G276T in intron 2 and −11377C/G in promoter. The genetic polymorphisms of T45G, G276T and −11377C/G have been proved to be associated with obesity development in German [7], Swedish [8] and Taiwan populations [9] and insulin resistance syndrome in Italian Whites [10] and Japanese [11, 12] as well as T2D in French Whitess [13]. However, whether the genetic polymorphisms of 45T/G and −11377C/G are associated with rosiglitazone response in patients with T2D still remains unknown and needs further extensive investigation.
Therefore, we set out to explore the relationship between the genetic polymorphisms of 45T/G and −11377C/G as well as their common existing diplotypes and susceptibility to T2D, and the therapeutic efficacy of multiple-dose rosiglitazone in Chinese patients with T2D.
Materials and methods
Subjects
Patients with T2D (n = 255; 138 male, 117 female) aged 25–70 years (mean 48.6 ± 10.7 years) and 120 healthy controls (53 female, 67 male) aged 25–70 years (mean 47.1 ± 11.0 years) were enrolled in this study. Physical examination, medical history and serum biochemical tests on all subjects were performed to identify healthy subjects or patients with T2D. The diagnosis criteria of patients with T2D were made according to the World Health Organization in 1997 by fasting plasma glucose (FPG ≥7.0 mmol l−1) and/or postprandial plasma glucose test (PPG ≥11.1 mmol l−1). The inclusion criteria of all subjects were that they had a body mass index (BMI) of 18.5–30 kg m−2 and had not administered any PPAR agonists in the last 3 months. Patients who were receiving insulin treatment, pregnant or lactating women, or those with serious diseases such as acute myocardial infarction, cerebral vascular accident, trauma, kidney or liver disease were excluded. There were no statistical differences in age, height, weight or BMI values between patients with T2D and healthy controls. All subjects were recruited from local residents in Changsha city, Hunan Province, P. R. China. The study protocol was approved by the Ethics Committee of Xiangya School of Medicine, Central South University and written informed consent was obtained before the start of the study. A total of 42 patients with T2D (23 male, 19 female) with different adiponectin allele 45T/G or −11377C/G genotypes were treated with 4 mg oral rosiglitazone daily for 12 consecutive weeks without any changes in previous medications.
Clinical laboratory tests
After an overnight fast, venous blood samples were collected at 2 h after breakfast before and after rosiglitazone treatment. The collected blood samples were immediately centrifuged at 3000 g for 10 min in a refrigerated centrifuge. Plasma FPG, total cholesterol, triglyceride, and high-density lipoprotein-cholesterol (HDL-C) concentrations were determined by use of an enzymatic colorimetric assay and lipoprotein electrophoresis, respectively. The plasma low-density lipoprotein-cholesterol (LDL-C) concentration was calculated according to the Friedewald formula [14]. Plasma insulin and HbAlc levels were measured by use of a radioimmunoassay kit (BNIBT, Beijing, China) and by high-performance liquid chromatography assay, respectively. The homeostasis model assessment for insulin resistance (HOMA-IR) value was calculated by use of the following formula to estimate the level of insulin sensitivity: HOMA-IR = fasting serum insulin (µU ml−1) × fasting blood glucose (mmol l−1)/22.5 [15]. Serum adiponectin concentration was measured by use of a commercial radioimmunoassay kit (American R&D Company, Shanghai Senxiong Co., China).
Genotyping for adiponectin alleles 45T/G and −11377C/G polymorphism
Genomic DNA was isolated from the peripheral blood leucocytes with phenol-chloroform followed by ethanol precipitation. The polymerase chain reaction (PCR)- restriction fragment length polymorphism genotyping procedures of adiponectin alleles 45T/G and −11377C/G were performed as previously described, with minor modifications [16]. For the −11377C/G locus, we used the primer pair as follows: sense primer, 5′-TGTCTTGTTGAAGTTGGTGCTG-3′; antisense primer, 5′-ATGCTAAGCTCCGGTGTTCG-3′. The T45G polymorphic locus was amplified by the use of sense primer 5′-GTGCTTGGTCCTGTGCTCA-3′ and antisense primer 5′-AAGTAGTGTCTGGAGGATGT-3′. PCR reactions were carried out in a total volume of 25 μl containing genomic DNA. PCR conditions for both 45T/G and −11377C/G were as follows: initial denaturation at 94°C for 5 min, 32 cycles of 30 s at 94°C, 30 s at 52°C, 30 s at 72°C, followed by a terminal extension for 7 min. The 449-bp PCR products of −11377C/G were digested by CfoI (TaKaRa Biotech, Changsha, China) into fragments of 351 bp and 98 bp (–11377C/G homozygote remained as a single 449-bp fragment). The 571-bp PCR products of T45G were digested by PagI (Fermentas Inc., Hanover, MD, USA) into fragments of 362 bp and 209 bp (T45G homozygote resulted in the loss of the 571-bp fragment and appearance of 362- and 209-bp fragments).
Statistical analysis
Statistical analyses were performed with SPSS software (Version 13.0 for Windows; SPSS Inc., Chicago, IL, USA). Hardy–Weinberg equilibrium was assessed with a χ2 test of goodness-of-fit in the study sample. Allelic frequencies in different groups were compared using Pearson's χ2. The statistical analyses of triglyceride, HDL-c, LDL-c, HOMA-IR and adiponectin levels were performed using log-transformed values. The frequencies of haplotypes and diplotypes were determined with the phase software package [17, 18]. Paired Student's t-test and anova test were used to compare the differences in the degree of reduction or enhancement of plasma concentrations among the different −11377C/G genotypic groups or T45G genotypic groups or −11377/45 diplotypes before and after rosiglitazone treatment. A two-sided test with type error level (α) set at 5% was used in all statistical analyses. Data were presented as mean ± SD. A two-tailed P-value < 0.05 was considered to be statistically significant for all analyses.
Results
Genotyping analysis and allelic frequencies
Two hundred and fifty-five patients with T2D and 120 healthy volunteers could be genotyped unambiguously for 45T/G and −11377C/G polymorphisms of the adiponectin gene. Repeated assays for randomly selected samples reproduced the accuracy of genotyping results in all samples. In patients with T2D, the allelic frequencies of 45T/G and −11377C/G were 28.8% and 28.0%, respectively, which were close to the frequencies in the Japanese population [11]. However, the allelic frequencies of 45T/G and −11377C/G were 21.3% and 22.5%, respectively, in healthy volunteers. Table 1 shows a significant difference in allelic frequency of −11377C/G between patients with T2D and healthy controls (P < 0.05). Genotyped frequencies of 45T/G and −11377C/G polymorphisms were in Hardy–Weinberg equilibrium (P > 0.05). We observed a significant linkage disequilibrium between −11377C/G locus and T45G locus (|D′| = 0.538, P < 0.001). As shown in Table 2, the frequencies of haplotype CG and GT in patients with T2D were markedly lower than those in healthy controls (P < 0.001). However, the frequency of haplotype GG was higher in patients with T2D than that in healthy controls (19.4% vs. 0.8%, P < 0.001), which suggests that the variation of −11377C/G might be a risk factor for the development of T2D [odds ratio (OR) 25.356, 95% confidence interval (CI) 6.862, 93.692). For −11377/45 diplotype analysis, only eight different types of diplotype (CCTT, CCTG, CGTT, CGTG, CCGG, CGGG, GGTT, GGTG) were found in our study. The frequency of diplotype CCTG in patients with T2D was lower than that in healthy controls (P < 0.001), but higher in CGTG frequency in patients with T2D (P < 0.001) (Table 2).
Table 1.
Genotypes and frequencies of adiponectin allele 45T/G and −11377C/G in patients with Type 2 diabetes and healthy subjects
| Genotype | T2D (n = 255) | Control (n = 120) | P-value |
|---|---|---|---|
| −11377C/G genotypes | |||
| CC | 122 (47.8%) | 74 (61.7%) | |
| CG | 119 (46.7%) | 41 (34.2%) | |
| GG | 14 (5.5%) | 5 (4.1%) | 0.044 |
| −11377C/G alleles | |||
| C | 363 (71.2%) | 189 (78.7%) | |
| G | 147 (28.8%)* | 51 (21.3%) | 0.028 |
| T45G genotypes | |||
| TT | 126 (49.4%) | 76 (58.3%) | |
| TG | 115 (45.1%) | 40 (38.4%) | |
| GG | 14 (5.5%) | 4 (3.3%) | 0.234 |
| T45G alleles | |||
| T | 367 (72.0%) | 186 (77.5%) | |
| G | 143 (28.0%) | 54 (22.5%) | 0.108 |
The allelic frequencies are indicated in absolute values (%).
P < 0.05 compared with control.
Table 2.
The distributive frequencies of haplotypes and diplotypes of 45T/G and −11377C/G alleles in patients with Type 2 diabetes and healthy subjects
| Haplotypes and diplotypes | Controls | T2D | P-value | OR (95% CI) |
|---|---|---|---|---|
| CT | 134 (55.8%) | 320 (62.7%) | 0.071 | 1.102 (0.809, 1.502) |
| CG | 53 (22.1%) | 47 (9.2%)** | <0.001 | 0.495 (0.328, 0.744) |
| GT | 51 (21.3%) | 44 (8.7%)** | <0.001 | 0.379 (0.246, 0.582) |
| GG | 2 (0.8%) | 99 (19.4%)** | <0.001 | 25.356 (6.862, 93.692) |
| CCTT | 37 (31.0%) | 93 (36.0%) | 0.285 | 0.845 (0.545, 1.311) |
| CCTG | 33 (27.5%) | 23 (9.0%)** | <0.001 | 3.049 (1.716, 5.418) |
| CGTT | 25 (21.0%) | 32 (13.0%) | 0.046 | 1.660 (0.942, 2.925) |
| CGTG | 12 (10.0%) | 80 (31.0%)** | <0.001 | 0.319 (0.167, 0.607) |
| CCGG | 3 (2.5%) | 5 (2.0%) | 0.736 | 1.275 (0.300, 5.423) |
| CGGG | 2 (1.0%) | 6 (2.0%) | 0.668 | 0.708 (0.141, 3.561) |
| GGTT | 8 (7.0%) | 4 (2.0%)* | 0.009 | 4.250 (1.255, 14.391) |
| GGTG | 0 | 12 (5.0%) |
χ2 test was used for comparison of distribution frequencies of four haplotypes and eight diplotypes 45T/G and −11377C/G alleles in patients with Type 2 diabetes and healthy controls.
P < 0.01; and
P < 0.001 compared with control. OR, odds ratio; 95% CI, 95% confidence interval.
Comparisons of clinical characteristics of patients with T2D in different −11377C/G or T45G genotyped groups before rosiglitazone treatment
In −11377C/G genotyped patients with T2D, there were significant differences in fasting serum insulin (FIN) and HOMA-IR between CC genotype and CG + GG genotypes (8.3 ± 7.0 mU l−1vs. 10.5 ± 8.0 mU l−1, P < 0.05; 3.2 ± 3.3 vs. 4.2 ± 5.0, P < 0.01). However, plasma adiponectin concentrations in carriers with CC genotypes were higher than in CG + GG genotypes (4.7 ± 2.4 μmol ml−1vs. 2.6 ± 1.7 μmol ml−1, P < 0.001) (Table 3, Figure 1). However, in T45G genotyped patients with T2D, there was a significant difference only in waist–hip ratio between TT genotype and TG + GG genotypes (0.90 ± 0.06 vs. 0.88 ± 0.06, P < 0.05) (Table 3). On diplotype analysis, the levels of FPG, PPG, FINs, HOMA-IR and LDL-c in T2D patients with CGTT diplotype were significantly higher than those in patients with other diplotypes (CCTT, CCTG, CGTG, CCGG, CGGG, GGTT, GGTG) (8.3 ± 3.0 mol ml−1vs. 7.6 ± 2.5 μmol ml−1, P < 0.05; 13.9 ± 5.6 μmol ml−1vs. 11.0 ± 5.1 μmol ml−1, P < 0.01; 13.3 mU l −1 ± 12.9 mU l−1vs. 8.9 mU l −1 ± 6.3 mU l−1, P < 0.05; 4.4 ± 3.3 vs. 3.6 ± 4.5, P < 0.05; 3.3 ± 0.8 mol ml−1vs. 2.9 ± 1.1 mol ml−1, P < 0.05, respectively) (Table 3, Figure 2).
Table 3.
Baseline characteristics of study subjects before rosiglitazone treatment
| Characteristics | −11377C/G CC (119) (95% CI) | CG + GG (136) (95% CI) | P-value | T45G TT (109) (95% CI) | TG + GG (146) (95% CI) | P-value | –11377/45 diplotype CGTT (32) (95% CI) | Others (218) (95% CI) | P-value |
|---|---|---|---|---|---|---|---|---|---|
| BMI (kg m−2) | 25.1 ± 3.2 (24.4, 25.6) | 25.3 ± 3.6 (24.7, 25.6) | 0.575 | 25.4 ± 3.3 (21.9, 28.4) | 24.7 ± 3.3 (22.2, 26.4) | 0.270 | 25.8 ± 3.7 (24.9, 26.7) | 25.0 ± 3.3 (24.6, 25.4) | 0.238 |
| Waist–hip ratio | 0.89 ± 0.06 (0.89, 0.94) | 0.88 ± 0.06 (0.87, 0.89) | 0.153 | 0.90 ± 0.06 (0.79, 0.99) | 0.88 ± 0.06† (0.85, 0.92) | 0.043 | 0.89 ± 0.08 (0.87, 0.91) | 0.89 ± 0.06 (0.87, 0.89) | 0.707 |
| FPG (mmol l−1) | 8.6 ± 3.2 (7.6, 9.9) | 8.0 ± 2.8 (7.6, 9.2) | 0.149 | 8.1 ± 2.9 (6.6, 8.0) | 8.4 ± 3.1 (5.6, 10.2) | 0.461 | 8.3 ± 3.0 (7.0, 8.3) | 7.6 ± 2.5‡ (8.0, 8.7) | 0.042 |
| PPG (mmol l−1) | 14.3 ± 6.0 (12.8, 16.4) | 13.1 ± 5.5 (11.9, 14.6) | 0.202 | 13.0 ± 5.2 (5.1, 15.3) | 13.9 ± 6.0 (9.6, 12.8) | 0.726 | 13.9 ± 5.6 (9.7, 12.5) | 11.0 ± 5.1§ (13.0, 14.5) | 0.008 |
| FINSΔ (mU l−1) | 8.3 ± 7.0 (6.9, 10.9) | 10.5 ± 8.0* (7.8, 11.1) | 0.029 | 10.6 ± 9.6 (6.2, 30.5) | 8.5 ± 5.0 (4.2, 11.5) | 0.081 | 13.3 ± 12.9 (9.7, 16.9) | 8.9 ± 6.3‡ (8.4, 9.9) | 0.016 |
| PINSΔ (mU l−1) | 45.0 ± 38.7 (31.2, 61.3) | 50.4 ± 38.8 (35.8, 53.6) | 0.103 | 47.5 ± 39.1 (2.7, 57.7) | 49.5 ± 38.8 (24.8, 88.2) | 0.755 | 58.8 ± 58.8 (41.7, 75.9) | 46.3 ± 34.8 (42.3, 51.4) | 0.880 |
| HOMA-IRΔ | 3.2 ± 3.3 (0.27, 10.8) | 4.2 ± 5.0** (4.6, 10.6) | 0.004 | 4.4 ± 5.8 (1.1, 10.0) | 3.2 ± 2.1 (1.3, 4.5) | 0.061 | 4.4 ± 3.3 (3.5, 5.3) | 3.6 ± 4.5‡ (3.2, 4.4) | 0.023 |
| HbAlcΔ (%) | 8.8 ± 2.5 (7.5, 9.0) | 9.2 ± 8.8 (7.0, 12.6) | 0.786 | 8.1 ± 2.2 (6.4, 7.9) | 9.5 ± 8.5 (5.9, 10.7) | 0.541 | 7.5 ± 1.5 (7.0, 8.0) | 9.0 ± 6.5 (8.0, 10.3) | 0.139 |
| TGΔ (mmol l−1) | 2.7 ± 2.9 (1.8, 2.9) | 3.0 ± 3.5 (2.0, 3.2) | 0.631 | 3.5 ± 4.4 (1.0, 1.7) | 2.6 ± 2.5 (1.4, 2.0) | 0.103 | 3.8 ± 6.3 (1.8, 5.9) | 2.9 ± 3.0 (2.5, 3.3) | 0.528 |
| Total cholesterolΔ (mmol l−1) | 5.1 ± 1.5 (4.6, 5.6) | 4.4 ± 2.0 (4.4, 5.2) | 0.074 | 4.7 ± 1.9 (4.3, 5.3) | 4.7 ± 1.7 (4.6, 5.7) | 0.922 | 4.9 ± 2.1 (4.2, 5.6) | 4.7 ± 1.8 (4.3, 4.8) | 0.455 |
| HDL-CΔ (mmol l−1) | 1.3 ± 0.6 (1.2, 1.6) | 1.5 ± 1.3 (1.4, 1.8) | 0.535 | 1.3 ± 0.6 (1.2, 1.8) | 1.5 ± 1.2 (1.4, 1.9) | 0.051 | 1.1 ± 0.4 (1.0, 1.3) | 1.4 ± 1.0 (1.3, 1.7) | 0.291 |
| LDL-CΔ (mmoll−1) | 3.1 ± 1.0 (2.6, 3.4) | 2.9 ± 1.1 (2.5, 2.9) | 0.081 | 3.0 ± 1.0 (2.0, 3.3) | 2.9 ± 1.1 (2.3, 3.4) | 0.431 | 3.3 ± 0.8 (3.0, 3.6) | 2.9 ± 1.1‡ (2.7, 3.0) | 0.036 |
| AdiponectinΔ (μmol ml−1) | 4.7 ± 2.4 (2.5, 4.9) | 2.6 ± 1.7*** (2.2, 3.5) | 0.000 | 2.6 ± 1.7 (1.2, 5.8) | 3.1 ± 2.0 (2.6, 6.3) | 0.554 | 1.7 ± 1.2 (0.9, 2.5) | 3.2 ± 2.1 (2.5, 3.8) | 0.141 |
Δ indicates that data were transformed to logarithm values.
P < 0.05;
P < 0.01; and
P < 0.001 compared with CC genotype.
P < 0.05 compared with TT genotype.
P < 0.05.
P < 0.01 compared with 45T/G and −11377C/G other diplotypes (CCTT, CCTG, CGTG, CCGG, CGGG, GGTT, GGTG).
Figure 1.
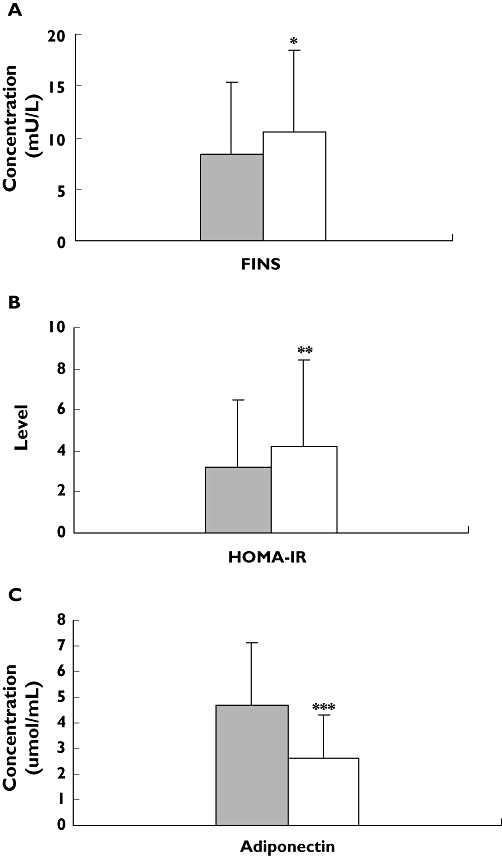
Comparison of levels of fasting serum insulin (FIN) (A), homeostasis model assessment for insulin resistance (HOMA-IR) (B) and adiponectin (C) in Type 2 diabetes (T2D) patients with different −11377C/G genotypes before rosiglitazone treatment. Data are expressed as mean ± SD. *P < 0.05; **P < 0.01; and ***P < 0.001 compared with CC genotype. n = 255. CC, (▪); CG + GG, (□)
Figure 2.
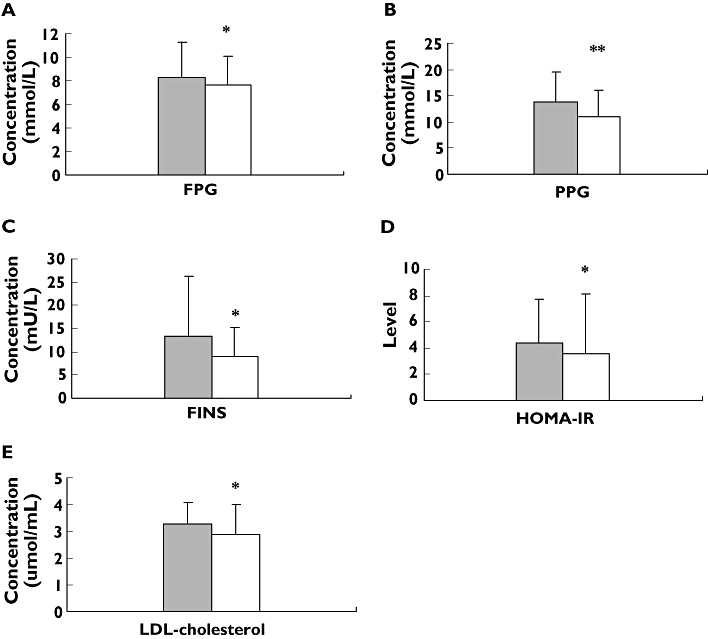
Comparison of levels of fasting plasma glucose (FPG) (A), postprandial plasma glucose (PPG) (B), fasting serum insulin (FIN) (C), homeostasis model assessment for insulin resistance (HOMA-IR) (D) and low-density lipoprotein-cholesterol (LDL-C) (E) in Type 2 diabetes (T2D) patients with different −11377/45 diplotypes before rosiglitazone treatment. Data are expressed as mean ± SD. *P < 0.05; **P < 0.01 compared with CGTT diplotypes. n = 255. CGTT, (▪); Other, (□)
Effect of 45T/G and −11377C/G polymorphisms on therapeutic efficacy of multiple-dose rosiglitazone in Chinese patients with T2D
As shown in Table 4 and Figure 3, there were an attenuated rosiglitazone effect in patients with −11377CG + GG heterozygote genotypes on FPG (from 7.5 ± 2.3 mmol l−1 to 6.9 ± 2.2 mmol l−1, mean percentage change −9.7), PPG (from 11.7 ± 3.4 mmol l−1 to 10.0 ± 3.0 mmol l−1, mean percentage change −7.6), HOMA-IR (from 7.3 ± 12.5 mmol l−1 to 6.3 ± 10.1 mmol l−1, mean percentage change −10.0) compared with −11377CC homozygote genotype (from 9.4 ± 2.9 mmol l−1 to 6.7 ± 1.9 mmol l−1, mean percentage change −34.2, P < 0.001; from 15.3 ± 4.2 mmol l−1 to 10.3 ± 3.9 mmol l−1, mean percentage change −36.8, P < 0.01, and from 4.2 ± 3.0 mmol l−1 to 2.9 ± 1.9 mmol l−1, mean percentage change −32.2, P < 0.05, respectively) and in patients with 45TG + GG heterozygote genotypes on FINs (from 15.8 mU l −1 ± 20.2 mU l−1 to 11.6 mU l −1 ± 4.7 mU l−1, mean percentage change −8.6) compared with 45TT homozygote genotype (from 13.5 ± 24.6 mU l−1 to 8.0 ± 4.4 mU l−1, mean percentage change −10.3, P < 0.01). However, we found an enhanced rosiglitazone effect on serum adiponectin concentration in patients with −11377CC homozygote genotype (from 2.2 ± 1.2 μmol ml−1 to 5.6 ± 2.5 μmol ml−1, mean percentage change 151.5) compared with −11377CG + GG heterozygote genotypes (from 2.9 ± 1.7 μmol ml−1 to 4.0 ± 1.7 μmol ml−1, mean percentage change 36.6, p < 0.001) and in patients with 45TG + GG. heterozygote genotype (from 2.3 ± 1.1 μmol ml−1 to 6.3 ± 2.0 μmol ml−1, mean percentage change 166.0) compared with 45TT homozygote genotype (from 2.5 ± 1.5 μmol ml−1 to 4.5 ± 2.4 μmol ml−1, mean percentage change 74.7, P < 0.05). Our data also showed there was an attenuated effect in patients with −11377/45CCTT, CCTG, CGTG, CCGG, CGGG, GGTT and GGTG diplotypes on FPG (from 9.2 ± 3.0 mmol l−1 to 6.8 ± 2.0 mmol l−1, mean percentage change −11.0) and PPG (from 14.9 ± 4.4 mmol l−1 to 10.1 ± 3.9 mmol l−1, mean percentage change −16.5) compared with patients with −11377/45CGTT diplotype (from 7.4 ± 2.1 mmol l−1 to 6.7 ± 2.0 mmol l−1, mean percentage change −29.0, P < 0.01; and from 12.1 ± 3.3 mmol l−1 to 10.3 ± 2.9 mmol l−1, mean percentage change −36.7, P < 0.01, respectively) after rosiglitazone treatment (Figure 4). Finally, we found that rosiglitazone had an enhanced effect on serum adiponectin concentrations in patients with other 11377/45 diplotypes (from 2.1 ± 1.4 μmol ml−1 to 5.4 ± 2.6 μmol ml−1, mean percentage change 141.0) compared with −11377/45CGTT diplotype (from 2.9 ± 1.7 μmol ml−1 to 3.8 ± 1.8 μmol ml−1, mean percentage change 26.1, P < 0.01).
Table 4.
Comparison of changes from baseline in BMI, FPG, PPG, FIN, PINS, HOMA-IR, adiponectin and HbAlc among the different of −11377C/G genotypic groups, T45G genotypic groups, and −11377/45 diplotypes groups after treatment with 4 mg rosiglitazone daily for 12 weeks
| Characteristics | −11377C/G CC (24) (95% CI) | CG + GG (18) (95% CI) | P-value | T45G TT (24) (95% CI) | TG + GG (18) (95% CI) | P-value | −11377/45 diplotype CGTT (11) (95% CI) | Others (31) (95% CI) | P-value |
|---|---|---|---|---|---|---|---|---|---|
| BMI (kg m−2) | 24.9 ± 2.4 | 24.9 ± 2.1 | 0.992 | 24.6 ± 2.1 | 25.7 ± 2.8 | 0.268 | 24.7 ± 1.9 | 25.5 ± 2.5 | 0.773 |
| FPG (mmol l−1) | |||||||||
| Baseline | 9.4 ± 2.9 | 7.5 ± 2.3 | 0.02 | 8.3 ± 2.6 | 9.7 ± 3.5 | 0.390 | 7.4 ± 2.1 | 9.2 ± 3.0 | 0.067 |
| After rosiglitazone | 6.7 ± 1.9 | 6.9 ± 2.2 | 0.818 | 6.4 ± 1.5 | 7.9 ± 2.7 | 0.259 | 6.7 ± 2.0 | 6.8 ± 2.0 | 0.714 |
| Mean percentage change | −34.2 (−45.3, −23.0) | −9.7*** (−13.3, −1.1) | 0.001 | −25.5 (−35.9, −15.1) | −16.0 (−26.3, −5.8) | 0.960 | −29.0 (−41.3, −20.2) | −11.0¶ (−15.1, −5.2) | 0.001 |
| PPG (mmol l−1) | |||||||||
| Baseline | 15.3 ± 4.2 | 11.7 ± 3.4 | 0.022 | 13.2 ± 3.6 | 16.2 ± 5.7 | 0.240 | 12.1 ± 3.3 | 14.9 ± 4.4 | 0.093 |
| After rosiglitazone | 10.3 ± 3.9 | 10.0 ± 3.0 | 0.833 | 9.8 ± 2.8 | 11.5 ± 5.3 | 0.808 | 10.3 ± 2.9 | 10.1 ± 3.9 | 0.403 |
| Mean percentage change | −36.8 (−48.4, −25.3) | −7.6* (−44.2, −3.6) | 0.002 | −30.5 (−44.7, −16.3) | −29.9 (−45.1, −14.9) | 0.530 | −36.7 (−47.1, −25.2) | −16.5§ (−36.8, −5.8) | 0.003 |
| FINΔ (mU l−1) | |||||||||
| Baseline | 9.1 ± 5.5 | 21.9 ± 36.2 | 0.527 | 13.5 ± 24.6 | 15.8 ± 20.2 | 0.235 | 19.9 ± 38.0 | 11.5 ± 13.0 | 0.810 |
| After rosiglitazone | 9.0 ± 4.9 | 8.7 ± 4.6 | 0.932 | 8.0 ± 4.4 | 11.6 ± 4.7 | 0.053 | 7.5 ± 2.3 | 9.6 ± 5.3 | 0.565 |
| Mean percentage change | −2.0 (−18.0, 6.1) | −24.9 (−56.9, −3.5) | 0.118 | −10.3 (−22.9, 2.3) | −8.6‡ (−57.5, 40.2) | 0.01 | −20.5 (−39.1, 32.3 | −8.7 (−20.8, 3.1) | 0.410 |
| PINSΔ (mU l−1) | |||||||||
| Baseline | 41.1 ± 19.0 | 70.7 ± 41.0 | 0.116 | 57.4 ± 33.0 | 48.4 ± 34.8 | 0.092 | 70.7 ± 43.3 | 41.1 ± 19.0 | 0.116 |
| After rosiglitazone | 32.2 ± 15.4 | 42.1 ± 36.0 | 0.779 | 29.1 ± 13.1 | 33.0 ± 25.2 | 0.261 | 28.3 ± 13.8 | 38.3 ± 26.4 | 0.588 |
| Mean percentage change | −11.4 (−44.4, 54.8) | −44.4 (−79.0, −7.6) | 0.062 | −28.3 (−46.6, −10.0) | −8.6 (−85.1, 51.3) | 0.393 | −11.0 (−42.5, 61.3) | −44.8 (−79.0, −7.6) | 0.060 |
| HOMA-IRΔ | |||||||||
| Baseline | 4.2 ± 3.0 | 7.3 ± 12.5 | 0.624 | 5.3 ± 9.1 | 5.7 ± 5.1 | 0.258 | 7.0 ± 13.7 | 4.7 ± 4.0 | 0.477 |
| After rosiglitazone | 2.9 ± 1.9 | 6.3 ± 10.1 | 0.362 | 4.2 ± 7.6 | 4.8 ± 4.4 | 0.208 | 5.9 ± 11.1 | 3.6 ± 3.2 | 0.909 |
| Mean percentage change | −32.2 (−42.9, −21.5) | −10.0* (−25.0, 45.4) | 0.040 | −21.1 (−29.3, −12.9) | −16.2 (−29.2, −3.1) | 0.058 | −24.3 (−52.9, 25.1) | −15.4§ (−16.4, 0.77) | 0.960 |
| AdiponectinΔ (μmol l−1) | |||||||||
| Baseline | 2.2 ± 1.2 | 2.9 ± 1.7 | 0.312 | 2.5 ± 1.5 | 2.3 ± 1.1 | 0.730 | 2.9 ± 1.7 | 2.1 ± 1.4 | 0.292 |
| After rosiglitazone | 5.6 ± 2.5 | 4.0 ± 1.7 | 0.066 | 4.5 ± 2.4 | 6.3 ± 2.0 | 0.092 | 3.8 ± 1.8 | 5.4 ± 2.6 | 0.053 |
| Mean percentage change | 151.5 (90.42, 58.1) | 36.6** (8.7, 66.9) | 0.000 | 74.7 (67.61, 81.7) | 166.0† (−3.23, 35.3) | 0.018 | 26.1 (3.1, 58.6) | 141.0¶ (91.5, 243.3) | 0.002 |
| HbAlcΔ (%) | |||||||||
| Baseline | 11.5 ± 13.4 | 8.8 ± 1.9 | 0.676 | 10.8 ± 12.2 | 9.6 ± 2.0 | 0.449 | 9.1 ± 1.8 | 10.9 ± 12.0 | 0.707 |
| After rosiglitazone | 7.2 ± 1.4 | 7.4 ± 1.5 | 0.665 | 7.3 ± 1.5 | 7.2 ± 1.4 | 0.808 | 6.7 ± 1.1 | 7.5 ± 1.5 | 0.314 |
| Mean percentage change | −37.8 (−47.3, −9.5) | −13.3 (−33.6, −3.4) | 0.850 | −21.2 (−32.5, −9.8) | −15.1 (−26.5, −3.8) | 0.531 | −16.0 (−27.2, −8.3 | −17.1 (−41.7, −4.4) | 0.463 |
Δ indicates that data were transformed to logarithm values.
P < 0.05;
P < 0.01; and
P < 0.001 compared with CC genotype.
P < 0.05.
P < 0.01 compared with TT genotype.
P < 0.05.
P < 0.01 compared with other diplotypes (CCTT, CCTG, CGTG, CCGG, CGGG, GGTT, GGTG). BMI, body mass index; FPG, fasting plasma glucose; PPG, postprandial plasma glucose; FIN, fasting serum insulin; PINS, postprandial serum insulin; HOMA-IR, homeostasis model assessment for insulin resistance.
Figure 3.
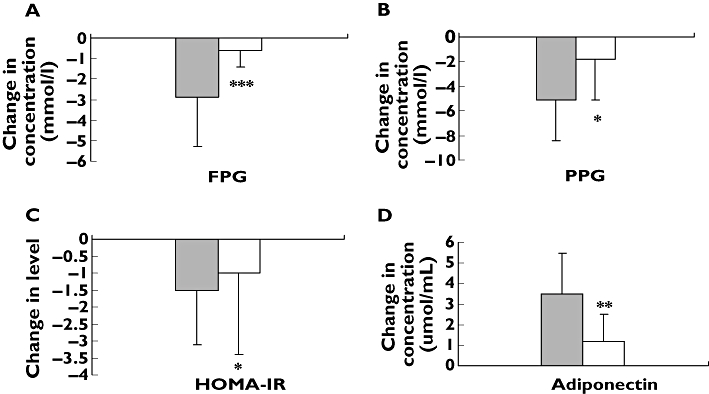
Comparison of changes of fasting plasma glucose (FPG) (A), postprandial plasma glucose (PPG) (B), homeostasis model assessment for insulin resistance (HOMA-IR) (C) and adiponectin (D) between −11377CC homozygote genotype and −11377CG + GG heterozygote genotypes before and after rosiglitazone treatment. Data are expressed as mean ± SD. *P < 0.05; **P < 0.01; and ***P < 0.001 compared with CC homozygote genotype. n = 42. CC, (▪); CG + GG, (□)
Figure 4.
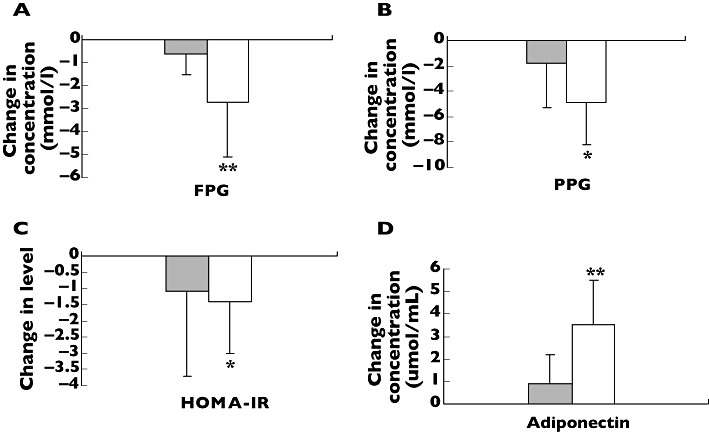
Comparison of changes of fasting plasma glucose (FPG) (A), postprandial plasma glucose (PPG) (B), homeostasis model assessment for insulin resistance (HOMA-IR) (C) and adiponectin (D) between −11377/45CGTT diplotype and other diplotypes (CCTT, CCTG, CGTG, CCGG, CGGG, GGTT, GGTG) before and after rosiglitazone treatment. Data are expressed as mean ± SD. *P < 0.05; and **P < 0.01 compared with CGTT diplotype. n = 42. CGTT, (▪); Others, (□)
Discussion
Adiponectin is an important adipocytokine that modulates insulin sensitivity and glucose homeostasis in the human body [4, 5]. Genetic variations of adiponectin gene have been proved to be associated with insulin resistance and development of diabetes and cardiovascular disease [2, 4]. Our study has shown for the first time that there is a remarkable association between polymorphisms of 45T/G and −11377C/G in the adiponectin gene and the therapeutic efficacy of multiple-dose rosiglitazone in Chinese patients with T2D.
In the present study, we found that the distributions of both 45T/G and −11377C/G alleles were in accordance with Hardy–Weinberg equilibrium. There was a significant difference in −11377C/G allelic frequency between T2D patients and healthy subjects (P < 0.05), but no difference in the T45G allele. Our data showed that the allelic frequency of −11377C/G in the Chinese population is different from the Japanese population [12], German Whites [13] and Swedish Whites [19]. However, the distribution frequency of the T45G allele in the Chinese population is similar to that in other ethnic populations. Furthermore, we found that the frequency of haplotype GG was higher in patients with T2D than in healthy controls (19.4% vs. 0.8%, P < 0.001), which suggests that the variation of −11377C/G might be a risk factor for the development of T2D (OR 25.356). Populaire and coworkers have revealed that the genetic polymorphism of −11377C/G could attribute about 31% of risk to diabetes and might be an important genetic risk factor for diabetes development in the Japanese population [11]. Our data have also shown that patients with T2D carrying the G-allele of −11377C/G had higher levels of HOMA-IR and fasting insulin as well as lower concentrations of serum adiponectin compared with CC genotype. Our findings of such a positive association are in agreement with several previous reports [11, 13]. Therefore, the G allele of −11377C/G might be a predictor for patients with T2D and insulin resistance.
The APM1 T45G is a silent mutation for Gly15 (GGT to GGG). A recent study has shown that the genetic polymorphism of T45G in the adiponectin gene could affect serum adiponectin concentrations by influencing pre-mRNA splicing or stability of mRNA and might be related to another functional locus via linkage disequilibrium [20]. In the present study, we found that the waist–hip ratio in patients with 45TT genotype was higher than that in 45TG + GG genotypes (P < 0.05). However, Katsuda and coworkers thought that G allele could be a risk factor for metabolic syndrome and the development of atherosclerosis in obese Japanese subjects [21]. Their results contrast with ours, which might be due to the choice of some normal weight patients with T2D in our experiment, not obese subjects.
With the rapid increase of diabetes development, various investigations world-wide are focusing on seeking a safe and effective drug to control this disease and decrease its complications. Rosiglitazone, an insulin sensitizer of the thiazolidinedione class, can directly bind to and activate PPARγ2 and plays a key role in the treatment of T2D by decreasing the level of blood sugar, alleviating lipid metabolic disorder and insulin resistance, improving β-cell function and decreasing the incidence of cardiovascular disease. However, previous studies have shown that there were marked interindividual differences in the response to rosiglitazone monotherapy in patients with T2D [6, 22–25]. Therefore, it is necessary to identify the mechanism of individual difference in rosiglitazone response in Chinese patients with T2D. Some recent studies have found that thiazolidinedione medicines could bind with a peroxisome proliferator response element located in the human adiponectin gene promoter and increase the serum adiponectin concentration by increasing the transcription level of adiponectin [23–25]. In this study, we found that T2D patients with −11377CC homozygote genotype were more sensitive in response to muitiple-dose rosiglitazone treatment compared with other genotypes. The attenuated levels of FPG, PPG and HOMA-IR in T2D patients with −11377CC homozygote genotype were greater than those in −11377CG + GG genotype subjects. Moreover, we showed an enhanced rosiglitazone therapeutic effect on serum adiponectin concentration in patients with −11377CC homozygote genotype and 45TG + GG heterozygote genotypes compared with −11377CG + GG heterozygote genotypes and 45TT homozygote genotype, respectively. We have also found that the decreased levels of FPG, PPG and HOMA-IR were less in patients with CGTT diplotype of −11377/45 than in patients with −11377/45 CCTT, CCTG, CGTG, CCGG, CGGG, GGTT, GGTG diplotypes. Finally, our data have shown that patients with CGTT diplotype had a lesser degree of enhancement of serum adiponectin concentration compared with other diplotypes. These data suggest that the patients with CGTT diplotype of −11377/45 are not sensitive in response to multiple-dose rosiglitazone treatment, and CGTT diplotype might be a risk factor for the development of T2D and insulin resistance. Our results showing that patients with the 45GG homozygote genotype are unlikely responsive to rosiglitazone are discordant with some previous reports [6]. The reason of this discrepancy could be due to subjects from different study population or small samples.
In conclusion, in this study we have confirmed for the first time that genetic polymorphisms of 45T/G and −11377C/G in adiponectin gene are common in the Chinese population and genetic polymorphism of −11377C/G is associated with therapeutic efficacy of multiple-dose rosiglitazone in Chinese patients with T2D. The −11377C/G allele and CGTT diplotype may be risk factors for the development of Type 2 diabetes mellitus. T2D patients with −11377CC homozygote genotype were good responders to rosiglitazone monotherapy, but carriers of CGTT diplotype and 45GG haplotype seem not to be sensitive to multiple-dose rosiglitazone. These data suggest that genetic polymorphisms of −11377C/G and T45G in adiponectin gene could affect the therapeutic efficacy of multiple-dose rosiglitazone and reverse the insulin resistance in Chinese patients with T2D.
Competing interests: None declared.
Acknowledgments
The work was supported by grants from the National Natural Science Foundation of China, no. 30572230, and the Supported Program for New Century Excellent Talents in University (NCET-04–0749) sponsored by the Ministry of Education of China.
REFERENCES
- 1.Scherer PE, Williams S, Fogliano M, Baldini G, Lodish HF. A novel serum protein similar to C1q, produced exclusively in adipocytes. J Biol Chem. 1995;270:26746–9. doi: 10.1074/jbc.270.45.26746. [DOI] [PubMed] [Google Scholar]
- 2.Arita Y, Kihara S, Ouchi N, Takahashi M, Maeda K, Miyagawa J, Hotta K, Shimomura I, Nakamura T, Miyaoka K, Kuriyama H, Nishida M, Yamashita S, Okubo K, Matsubara K, Muraguchi M, Ohmoto Y, Funahashi T, Matsuzawa Y. Paradoxical decrease of an adipose-specific protein, adiponectin, in obesity. Biochem Biophys Res Commun. 1999;257:79–83. doi: 10.1006/bbrc.1999.0255. [DOI] [PubMed] [Google Scholar]
- 3.Yang WS, Jeng CY, Wu TJ, Tanaka S, Funahashi T, Matsuzawa Y, Wang JP, Chen CL, Tai TY, Chuang LM. Synthetic peroxisome proliferator-activated receptor-gamma agonist, rosiglitazone, increases plasma levels of adiponectin in type 2 diabetic patients. Diabetes Care. 2002;25:376–80. doi: 10.2337/diacare.25.2.376. [DOI] [PubMed] [Google Scholar]
- 4.Maeda K, Okubo K, Shimomura I, Funahashi T, Matsuzawa Y, Matsubara K. cDNA cloning and expression of a novel adipose specific collagen-like factor, apM1 (AdiPose Most abundant Gene transcript 1) Biochem Biophys Res Commun. 1996;221:286–9. doi: 10.1006/bbrc.1996.0587. [DOI] [PubMed] [Google Scholar]
- 5.Hu E, Liang P, Spiegelman BM. AdipoQ is a novel adipose-specific gene dysregulated in obesity. J Biol Chem. 1996;271:10697–703. doi: 10.1074/jbc.271.18.10697. [DOI] [PubMed] [Google Scholar]
- 6.Kang ES, Park SY, Kim HJ, Ahn CW, Nam M, Cha BS, Lim SK, Kim KR, Lee HC. The influence of adiponectin gene polymorphism on the rosiglitazone response in patients with type 2 diabetes. Diabetes Care. 2005;28:1139–44. doi: 10.2337/diacare.28.5.1139. [DOI] [PubMed] [Google Scholar]
- 7.Stumvoll M, Tschritter O, Fritsche A, Staiger H, Renn W, Weisser M, Machicao F, Haring H. Association of the T-G polymorphism in adiponectin (exon 2) with obesity and insulin sensitivity: interaction with family history of type 2 diabetes. Diabetes. 2002;51:37–41. doi: 10.2337/diabetes.51.1.37. [DOI] [PubMed] [Google Scholar]
- 8.Ukkola O, Ravussin E, Jacobson P, Sjostrom L, Bouchard C. Mutations in the adiponectin gene in lean and obese subjects from the Swedish obese subjects cohort. Metabolism. 2003;52:881–4. doi: 10.1016/s0026-0495(03)00074-x. [DOI] [PubMed] [Google Scholar]
- 9.Yang WS, Tsou PL, Lee WJ, Tseng DL, Chen CL, Peng CC, Lee KC, Chen MJ, Huang CJ, Tai TY, Chuang LM. Allele-specific differential expression of a common adiponectin gene polymorphism related to obesity. J Mol Med. 2003;81:428–34. doi: 10.1007/s00109-002-0409-4. [DOI] [PubMed] [Google Scholar]
- 10.Menzaghi C, Ercolino T, Di Paola R, Berg AH, Warram JH, Scherer PE, Trischitta V, Doria A. A haplotype at the adiponectin locus is associated with obesity and other features of the insulin resistance syndrome. Diabetes. 2002;51:2306–12. doi: 10.2337/diabetes.51.7.2306. [DOI] [PubMed] [Google Scholar]
- 11.Populaire C, Mori Y, Dina C, Vasseur F, Vaxillaire M, Kadowaki T, Froguel P. Does the −11377 promoter variant of APM1 gene contribute to the genetic risk for Type 2 diabetes mellitus in Japanese families? Diabetologia. 2003;46:443–5. doi: 10.1007/s00125-003-1050-7. [DOI] [PubMed] [Google Scholar]
- 12.Hara K, Boutin P, Mori Y, Tobe K, Dina C, Yasuda K, Yamauchi T, Otabe S, Okada T, Eto K, Kadowaki H, Hagura R, Akanuma Y, Yazaki Y, Nagai R, Taniyama M, Matsubara K, Yoda M, Nakano Y, Tomita M, Kimura S, Ito C, Froguel P, Kadowaki T. Genetic variation in the gene encoding adiponectin is associated with an increased risk of type 2 diabetes in the Japanese population. Diabetes. 2002;51:536–40. doi: 10.2337/diabetes.51.2.536. [DOI] [PubMed] [Google Scholar]
- 13.Vasseur F, Helbecque N, Dina C, Lobbens S, Delannoy V, Gaget S, Boutin P, Vaxillaire M, Lepretre F, Dupont S, Hara K, Clement K, Bihain B, Kadowaki T, Froguel P. Single-nucleotide polymorphism haplotypes in the both proximal promoter and exon 3 of the APM1 gene modulate adipocyte-secreted adiponectin hormone levels and contribute to the genetic risk for type 2 diabetes in French Caucasians. Hum Mol Genet. 2002;11:2607–14. doi: 10.1093/hmg/11.21.2607. [DOI] [PubMed] [Google Scholar]
- 14.Friedewald WT, Levy RI, Fredrickson DS. Estimation of the concentration of low-density lipoprotein cholesterol in plasma, without use of the preparative ultracentrifuge. Clin Chem. 1972;18:499–502. [PubMed] [Google Scholar]
- 15.Kang ES, Yun YS, Park SW, Kim HJ, Ahn CW, Song YD, Cha BS, Lim SK, Kim KR, Lee HC. Limitation of the validity of the homeostasis model assessment as an index of insulin resistance in Korea. Metabolism. 2005;54:206–11. doi: 10.1016/j.metabol.2004.08.014. [DOI] [PubMed] [Google Scholar]
- 16.Sambrook J, Fritsch EF, Maniatis T. Molecular Cloning: a Laboratory Manual. 2. Cold Spring Harbor, NY: Cold Spring Harbor Laboratory Press; 1989. [Google Scholar]
- 17.Stephens M, Donnelly P. A comparison of Bayesian methods for haplotype reconstruction from population genotype data. Am J Hum Genet. 2003;73:1162–9. doi: 10.1086/379378. [DOI] [PMC free article] [PubMed] [Google Scholar]
- 18.Sutton BS, Weinert S, Langefeld CD, Williams AH, Campbell JK, Saad MF, Haffner SM, Norris JM, Bowden DW. Genetic analysis of adiponectin and obesity in Hispanic families: the IRAS Family Study. Hum Genet. 2005;117:107–18. doi: 10.1007/s00439-005-1260-9. [DOI] [PubMed] [Google Scholar]
- 19.Gu HF, Abulaiti A, Ostenson CG, Humphreys K, Wahlestedt C, Brookes AJ, Efendic S. Single nucleotide polymorphisms in the proximal promoter region of the adiponectin (APM1) gene are associated with type 2 diabetes in Swedish Caucasians. Diabetes. 2004;53(Suppl. 1):S31–5. doi: 10.2337/diabetes.53.2007.s31. [DOI] [PubMed] [Google Scholar]
- 20.Cartegni L, Chew SL, Krainer AR. Listening to silence and understanding nonsense: exonic mutations that affect splicing. Nat Rev Genet. 2002;3:285–98. doi: 10.1038/nrg775. [DOI] [PubMed] [Google Scholar]
- 21.Katsuda Y, Asano A, Murase Y, Chujo D, Yagi K, Kobayashi J, Mabuchi H, Yamagishi M. Association of genetic variation of the adiponectin gene with body fat distribution and carotid atherosclerosis in Japanese obese subjects. J Atheroscler Thromb. 2007;14:19–26. doi: 10.5551/jat.14.19. [DOI] [PubMed] [Google Scholar]
- 22.Yang WS, Hsiung CA, Ho LT, Chen YT, He CT, Curb JD, Grove J, Quertermous T, Chen YD, Kuo SS, Chuang LM. Genetic epistasis of adiponectin and PPARgamma2 genotypes in modulation of insulin sensitivity: a family–based association study. Diabetologia. 2003;46:977–83. doi: 10.1007/s00125-003-1136-2. [DOI] [PubMed] [Google Scholar]
- 23.Iwaki M, Matsuda M, Maeda N, Funahashi T, Matsuzawa Y, Makishima M, Shimomura I. Induction of adiponectin, a fat-derived antidiabetic and antiatherogenic factor, by nuclear receptors. Diabetes. 2003;52:1655–63. doi: 10.2337/diabetes.52.7.1655. [DOI] [PubMed] [Google Scholar]
- 24.Yu JG, Javorschi S, Hevener AL, Kruszynska YT, Norman RA, Sinha M, Olefsky JM. The effect of thiazolidinediones on plasma adiponectin levels in normal, obese, and type 2 diabetic subjects. Diabetes. 2002;51:2968–74. doi: 10.2337/diabetes.51.10.2968. [DOI] [PubMed] [Google Scholar]
- 25.Combs TP, Wagner JA, Berger J, Doebber T, Wang WJ, Zhang BB, Tanen M, Berg AH, O'Rahilly S, Savage DB, Chatterjee K, Weiss S, Larson PJ, Gottesdiener KM, Gertz BJ, Charron MJ, Scherer PE, Moller DE. Induction of adipocyte complement-related protein of 30 kilodaltons by PPARgamma agonists: a potential mechanism of insulin sensitization. Endocrinology. 2002;143:998–1007. doi: 10.1210/endo.143.3.8662. [DOI] [PubMed] [Google Scholar]