Abstract
AIM
Clinical pharmacology at the Leiden University Medical Centre is primarily taught by the Teaching Resource Centre's (TRC) Pharmacology database. The TRC program contains schematic graphics using a unique icon language, explanation texts and feedback questions to explain pharmacology as it pertains to pathophysiology. Nearly each course of the curriculum has a chapter in the TRC database offered for self-study. Since using the TRC program is not compulsory, the question remains whether students benefit from using it.
METHODS
We compared the parameters of log-in attempts and time spent at each topic with students' final exam grades. Instead of looking at the regression of time spent on TRC on grade for one course, we looked at the individual student regression of time spent on TRC for different courses on grades. Spending more time using the TRC being associated with higher grades within an individual is a more powerful result than between students within a course, as better students are likely to spend more time using the TRC.
RESULTS
Students increasingly used the program throughout the curriculum. More importantly, the time spent using the program showed that increased TRC use by an individual student is associated with a (small) increase in grade. As expected for a noncompulsory activity, better students (those with higher than average exam scores) logged in to the TRC more frequently, but poorer students appeared to have a larger benefit.
CONCLUSIONS
An increase in TRC use by an individual student correlates with an increase in course grades.
WHAT IS ALREADY KNOWN ABOUT THIS SUBJECT
E-Learning is increasingly used to provide medical education
Visualizing mechanisms appears to be a handy method for students to learn pharmacology
WHAT THIS STUDY ADDS
E-learning tools seem to improve individual grades in pharmacology courses. The statistical information provided by the E-learning tools gives precise insight into the relationship between effort and learning
Keywords: E-Learning, general pharmacology, medical education
Introduction
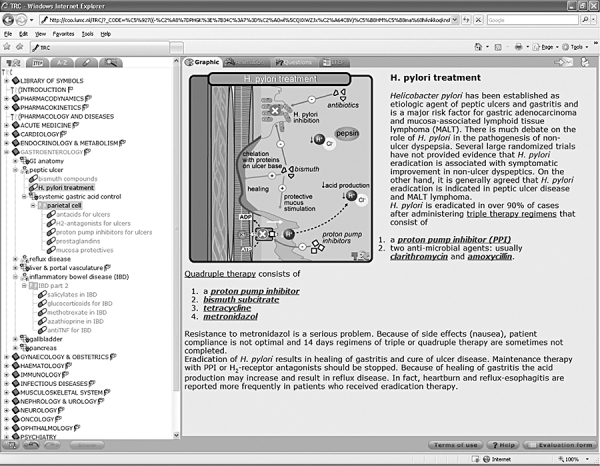
Self-study computer programs primarily teach pharmacology and pharmacotherapy at the Leiden University Medical Centre. The Teaching Resource Centre (TRC) began to provide computer-based education to medical students at a time when there was no formalized pharmacology education in the curriculum. The TRC Pharmacology database (http://coo.lumc.nl/TRC) is a program containing information on drug mechanisms of action as they pertain to physiology and pathophysiology [1, 2]. It consists of multiple topics for each course containing schematic graphics using a unique icon language [3], explanation texts and questions with feedback (Figure 1). Students use the database as part of a blended learning strategy in which they use the database to (i) learn pharmacological mechanisms, (ii) review physiological mechanisms, and (iii) complete therapeutic plans for electronic patient cases [4]. Nearly each course of the curriculum has a chapter in the TRC database offered for self-study. However, the question remains, how can we evaluate our computer-based teaching (CBT) program? Many groups evaluate how much students like the program, others evaluate the usage patterns, and still others look for ways to measure learning. These methods all have their limitations. Student opinions are, of course, merely opinions and tend to be biased [4, 5]. Typically, only students who like and enjoy the program answer the questionnaires, and are more likely to do so if they believe their comments will improve the course [6]. In contrast, when evaluations are made a required part of the curriculum, they tend to be more negative [7]. In addition, some studies use five-point Likert scales, which do not have sufficient sensitivity to show the differences between courses. Usage patterns can be helpful, as long as the CBT is used as a noncompulsory part of the course [8]. We have kept the TRC database as a noncompulsory activity, believing that if the CBT program is worthwhile, the students will use it. In a previous article [2] we have described how students began using the database after its introduction. In this study, we show that a majority of students use the program and that their activity increases as they approach the exam, indicating that students perceive the program as a good study tool. However, can we measure what they have learned from the program? As a clinical pharmacology group, we typically evaluate the effectiveness of an intervention by randomized, double-blind, placebo-controlled trials. Although this may be optimal, it is not practical, as it is difficult to maintain a control in different educational groups [9]. Some students will invariably utilize whatever educational means to complete a course. The real difficulty comes with determining the appropriate measurement to use for the assessment [10]. It is well recognized that most self-created assessments of an intervention are likely to show an improvement. So we choose to use the final examination grades (the only form of summative assessment used at Leiden) as a measurement of learning, which still remains a standard as a strong predictive factor for success on medical examinations [11], and a moderate predictor of clinical performance [12].
Figure 1.

The Teaching Resource Centre database as it appears online
Aim
To determine (with as few confounding variables as possible) if student utilization of the TRC Pharmacology program relates to final examination grades.
Methods
We evaluated students' TRC database utilization across the curriculum for two different years of study: 2003–2004 and 2005–2006. The 2003–2004 data represent student utilization of the TRC database when the program was still ‘new’ in the curriculum. The 2005–2006 data represent student utilization data for a CBT program that had been established and was generally accepted in the curriculum. All courses with pharmacological content on the TRC Pharmacology database were evaluated. The parameter of total time spent reviewing TRC database material for a particular course was compared with the student's final exam grade in that course (scale of 0–10). Time spent using the database in 2003–2004 was determined separately from the 2005–2006 data. Because time spent on a topic can include nonstudy-related activities (e.g. flicking through the program or getting a cup a coffee leaving the computer on), time spent on a topic was set to zero when very short (less than the fifth percentile of all time spent on a topic, in this case < 3 s in 2003 or <2 s in 2005) or set to the 95th percentile when greater than the 95th percentile for the whole dataset (in this case >6 min in 2003 or 9 min in 2005). Student Identification numbers that were used for logging into a particular topic but did not appear on the corresponding exam were deleted. Students who did not show up for the examination were given the grade of zero.
Data analysis
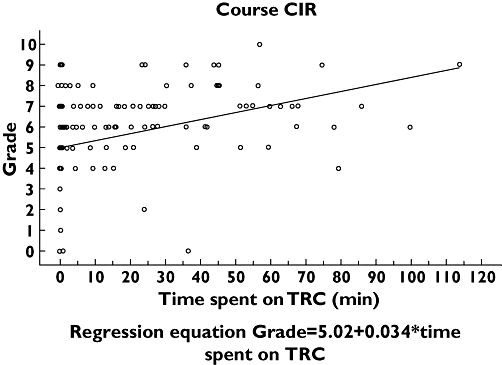
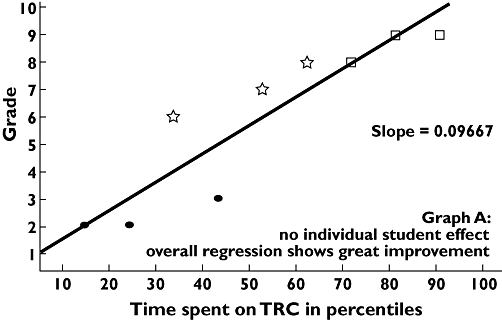
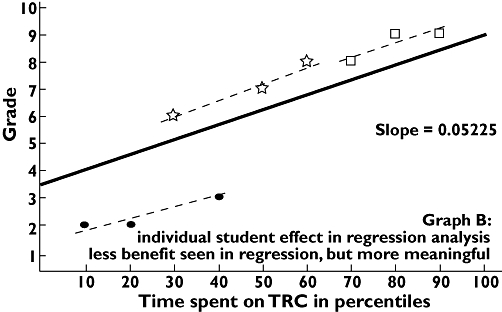
Data from each course were initially evaluated by placing the data in a scatterplot of time spent vs. final grade (an example using the results from the circulation course is shown in Figure 2). For each course a linear regression analysis can be performed; for the circulation course it shows a slope of 0.034 with a p value of <0.001. What do these data mean? It looks like individuals who study more on the TRC database achieve higher grades, and thus increase the slope. But when a regression is used in this manner, the variability between the individual students greatly influences the slope. Could it be that smarter students study more and achieve higher grades, independent of the effect of the TRC? One way to address this is to determine if, on a per student basis, increased time leads to increased grades. Fortunately, we can do this assessment, since we have repeated measures of the same students across the curriculum. However, because the average time required for students to study each course varied (some courses had more topics), we had to normalise the times spent studying by using the percentiles of time in which the student used the TRC database. At this point, the regression would look much like that shown in Figure 3, an example of 9 data points from three students’ grades in three different courses. But Figure 4 shows an illustration of two extreme examples of how an individual student's data could be lost in the overall regression. All data were then analysed together based on all the individual student's regression lines, and a new overall regression line was calculated taking into account the influence of the individual student. But because some courses are more difficult than others, the effect of the different average grades per course was taken along as covariate in the analysis (final example shown in Figure 5). Next to the overall regression line, the slope and intercept for each course are calculated. The slopes can be interpreted as a student who increases study time from one percentile to another will have an increase in grade equal to the slope. Finally, the grade regressions from study years 2003–2004 were compared with 2005–2006.
Figure 2.

Scatter plot from the course Circulation (CIR)
Figure 3.

Example of scatter plot of multiple students in multiple courses and the overall regression. Student 1 scores, ( ); student 2 scores, (
 ); student 3 scores, (□)
Figure 4.

Illustration of two extreme scenarios in which a student's individual learning can be hidden in a general regression analysis. Individual student's score on exam, ( ); group of individual student's scores, (
 ); overall regression of all scores (
 )
)
Figure 5.

Example of scatter plot with individual students' regressions and the resulting overall regression. Student 1 scores, ( ); student 2 scores, (
 ); student 3 scores, (□); individual student's regression of scores, (
 ); regression of scores with student effect, (
 )
)
Results
Time spent using the database in 2003–2004 was determined from >80 000 hits to the TRC by >900 students. The 2005–2006 data consisted of >175 000 hits from nearly 1100 students. This absolute increase in student users of the TRC can be attributed to two factors: (i) the nearly 20% increase in enrolment across all the courses and (ii) a 10% increase in TRC use.
The data from the all-courses regression table (Table 1) show that the average grades earned from students who did not look at the TRC database decreased from 6.3 to 5.9 between years 2004 and 2006. In addition, the net scores achieved by those students who used the program the longest decreased from 7.1 to 6.9. The data of grade by time using TRC in percentiles show the slopes to be 0.32 (p < 0.001), and 0.55 (p < 0.001) for the 2004 and 2006 years, respectively (difference in slopes P = 0.0014). Indicating that students could increase their grade by 0.3 in 2004 and 0.6 in 2006 if they spent to the 100th percentile of time on the TRC. The correlation between the estimated intercept and estimated slope for every course of the year 2005–2006 was −0.51 (no p-value as the correlation is based on estimates). (Thus, the lower the grade at the intercept, the greater the slope).
Table 1.
Results of the regression analysis across all courses for years 2003–2004 and 2005–2006
| Slope | Average grade of students in 0th Percentile | Average grade of students in 95–100th Percentile | Average time (min) spent by students in 50th Percentile | |||||||
|---|---|---|---|---|---|---|---|---|---|---|
| Course | 2003 | 2006 | difference between slopes | P-value | 2003 | 2006 | 2003 | 2006 | 2003 | 2006 |
| General | 0.0032 | 0.0055 | 0.0023 | 0.001 | 6.3 | 5.9 | 7.1 | 6.9 | ||
| Central nervous system | 0.0004 | 6.2 | 5.2 | 5 | ||||||
| Chest | 0.0046 | 0.0086 | 0.0040 | 0.071 | 6 | 5.6 | 7 | 7 | 57 | 52 |
| Circulation | 0.0091 | 5.6 | 6.4 | 23 | ||||||
| Developmental disorders | 0 | 6.5 | 7.4 | 20 | ||||||
| Endocrinology | 0.0056 | 0.0053 | −0.0003 | 0.896 | 6.3 | 5.7 | 7.3 | 6.6 | 89 | 123 |
| Gastroenterology | 0.0016 | −0.0002 | −0.0018 | 0.424 | 6.3 | 6.6 | 7 | 7.5 | 71 | 34 |
| Geriatrics | 0.0044 | 0.0025 | −0.0019 | 0.504 | 7.3 | 6.4 | 7.5 | 6.8 | 62 | 113 |
| Immunology | 0.0063 | 6.9 | 8.1 | 28 | ||||||
| Infectious diseases | 0.0048 | 0.0055 | 0.0007 | 0.785 | 5.9 | 6 | 7 | 7.4 | 24 | 30 |
| Molecular medicine | 0.0088 | 5.3 | 7.2 | 28 | ||||||
| Movement disorders | 0.0051 | 0.008 | 0.0029 | 0.203 | 5.8 | 5.3 | 6.7 | 6.4 | 31 | 51 |
| Oncology | 0.0027 | 0.0035 | 0.0007 | 0.753 | 6.7 | 6.7 | 7.4 | 7.2 | 24 | 49 |
| Pathophysiology | 0.0104 | 5 | 6.6 | 25 | ||||||
| Pediatrics | 0.0002 | 0.0059 | 0.0057 | 0.029 | 7.1 | 6 | 7.9 | 7 | 15 | 13 |
| Psychiatric diseases | −0.0008 | 0.0023 | 0.0031 | 0.182 | 6.1 | 6.1 | 6.7 | 6.4 | 26 | 75 |
| Psychopathology | 0.0023 | 0.0033 | 0.0010 | 0.721 | 6.5 | 6.2 | 7 | 6.8 | 9 | 19 |
| Regulatory systems | 0.0054 | 0.005 | −0.0004 | 0.906 | 6 | 6 | 6.5 | 6.7 | 19 | 31 |
| Renal & urology | 0.0086 | 0.0079 | −0.0007 | 0.760 | 6.3 | 5.5 | 7.8 | 6.3 | 11 | 25 |
| Reproduction | 0.0033 | 0.0021 | −0.0012 | 0.669 | 6.3 | 6.3 | 6.5 | 7 | 7 | 45 |
Discussion
This analysis has shown a significant relationship between the time students spend using the TRC Pharmacology Database and the ultimate grades they achieved in a course. In addition, the slope of the increase in course grades was larger in 2005–2006 when the results from the 2003–2004 and 2005–2006 years were compared. Although no statement can be made that the students are improving in the courses due to the TRC program and the TRC program alone, the relationship exists, and exists for an (increasingly) large number of students and courses.
In this analysis we have tried to eliminate systematically the typical shortcomings described from the evaluations of other (computer-based) learning interventions [13]. First of all, many other studies have evaluated teaching interventions that are implemented only in individual courses where the sample sizes are often not larger than 100. If the studies are then designed as a controlled trial, the numbers of each ‘treatment group’ can quickly fall, decreasing the power. Thus, it is fortunate that so many students have logged in and used the TRC database in so many different courses. This has provided us with sufficient power to make the various analyses possible.
This analysis also did not take place in an artificial controlled experimental environment. Our study has analysed the real-world results of the TRC Pharmacology database (users vs. nonusers) and tried to take as many confounding factors into account as possible. The final examinations were written by the course coordinators and contained maximally 10 percent of questions focused on pharmacology. However, because the TRC contains summaries of anatomy, physiology and pathophysiology as related to pharmacology, it reinforces the students understanding of these topics as well. Thus, it is all the more interesting that students show an increase in grade when using the program. The external validity (and therefore generalizability) of the study is therefore higher than that of a study which creates its own assessments of an educational intervention and controls the environment of the participants.
The internal validity is, however, lower for our study, as we cannot definitively say that the improvement in grades was the result of increased time studying the TRC. One option may have been to assess the other tools the students were exposed to or chose to use during their studies. In this case, we would have to rely on a questionnaire on student utilization of other interventions, and this type of self-reporting would be impossible to compare with the actual data collected from the back-end of a computer program.
Instead, we chose to have the students serve as their own controls. We assessed individual student performance when they chose to use the TRC more or less in one course vs. another. This individual user evaluation is the real strength of this analysis. Most other in-course evaluations have artificially separated the students into control vs. experimental groups, which may or may not be comparable. Alternatively, the study may have the groups be self-selecting, where those students choosing to participate are obviously more motivated and perform better. Then there are the few studies which have compared the results derived from a prediction of either having or not having participated in the intervention. Unfortunately, these studies are not able to demonstrate benefit from the studied intervention [14, 15]. Our study cannot indicate what motivates an individual student to use the TRC more or less. One may also argue that the average increase in grade seems small, but these courses run between three and six weeks and the average median study time over all the courses is only 28 minutes. It appears that an extra hour of study may increase grades by half a point, which seems efficient.
Perhaps the most intriguing result is the existence of a negative correlation between the slope and intercept. The results indicate that the TRC seems particularly good for the student who chooses not to study in one course and receives a poor grade versus another where the student is motivated study and receives a higher grade. Statistically, this makes sense, as bright students who always strive to achieve high scores cannot improve much from increased use of the TRC Pharmacology database. As an illustration, if they chose to study a little in one course and receive a 9, and then choose to study more and receive a 10 in another, the slope is not large. Thus, the TRC Pharmacology database is probably most effective where it needs to be. It assists under-performing students to do better. In attempt to motivate these students to use the TRC database, these results were included into the opening page of the program in the autumn of 2007.
Lastly, it is important to note the improvements in grades achieved by TRC users between the 2003–2004 and 2005–2006 data. The results are not attributable to the often-cited grade inflation, as the average grades for students sitting for the exams fell between the two study years. A more likely explanation is to be found in the increasing percentage of TRC users and falling intercepts from 2003 to 2005. As more students use the TRC, those that do not use the program are found to earn lower grades. In addition, the database has not been static between the years. Due to continuous assessment of the feedback provided to us in the form of questionnaires and online comments, we (together with the course coordinators) continuously updated the program. In situations where we had a poor relationship with the course materials in 2003–2004, we either increased the amount of relevant topics, or stopped participating in the course.
In summary, students are increasingly using the TRC Pharmacology Database program throughout the curriculum and demonstrating an increase in study efficiency. More importantly, an increase in TRC use by an individual student correlates with an increase in course grades without regard to student or course. Our ability to demonstrate the usefulness of our E-Learning program was heavily dependent on the fact that the program was already being widely used in many courses and by many students. By continuously analysing the utilization and performance of students using the program, we have been able to introduce improvements to the E-Learning program that improve the students' learning efficiency.
REFERENCES
- 1.Franson KL, Dubois EA, van Gerven JMA, Cornet F, Bolk JH, Cohen AF. Teaching resource centre (TRC): teaching clinical pharmacology in an integrated medical school curriculum. Br J Clin Pharmacol. 2004;57:358. [Google Scholar]
- 2.Frankson KL, Dubois EA, van Gerven JMA, Cohen AF. Development of visual pharmacology education across an integrated medical school curriculum. J Vis Commun Med. 2007;30(4):156–61. doi: 10.1080/17453050701700909. [DOI] [PubMed] [Google Scholar]
- 3.Benjamins E, Van Gerven JMA, Cohen AF. Uniform visual approach to disseminate clinical pharmacology basics in medical school. IUPHAR Pharmacol Int. 2000;55:6–7. [Google Scholar]
- 4.Franson KL, Dubois EA, van Gerven JM, Cohen AF. Pharmacology learning strategies for an integrated medical school curriculum. Clin Pharmacol Ther. 2004;75:91. [Google Scholar]
- 5.Feldman KA. The association between student-ratings of specific instructional dimensions and student-achievement – refining and extending the synthesis of data from multisection validity studies. Res Higher Educ. 1989;30:583–645. [Google Scholar]
- 6.Anderson HM, Cain J, Bird E. Online student course evaluations: Review of literature and a pilot study. Am J Pharm Educ. 2005;69:34–43. [Google Scholar]
- 7.Rudland JR, Pippard MJ, Rennie SC. Comparison of opinions and profiles of late or non-responding medical students with initial responders to a course evaluation questionnaire. Med Teach. 2005;27:644–6. doi: 10.1080/01421590500136287. [DOI] [PubMed] [Google Scholar]
- 8.Garritty C, El Emam K. Who's using PDAs? Estimates of PDA use by health-care providers: a systematic review of surveys. J Med Internet Res. 2006;8:e7. doi: 10.2196/jmir.8.2.e7. [DOI] [PMC free article] [PubMed] [Google Scholar]
- 9.Jolly B. Control and validity in medical educational research. Med Educ. 2001;35:920–1. [PubMed] [Google Scholar]
- 10.Morrison JM, Sullivan F, Murray E, Jolly B. Evidence-based education: development of an instrument to critically appraise reports of educational interventions. Med Educ. 1999;33:890–3. doi: 10.1046/j.1365-2923.1999.00479.x. [DOI] [PubMed] [Google Scholar]
- 11.Issenberg SB, McGaghie WC, Petrusa ER, Lee GD, Scalese RJ. Features and uses of high-fidelity medical simulations that lead to effective learning: a BEME systematic review. Med Teach. 2005;27:10–28. doi: 10.1080/01421590500046924. [DOI] [PubMed] [Google Scholar]
- 12.Dixon D. Relation between variables of preadmission, medical school performance, and COMLEX-USA levels 1 and 2 performance. J Am Osteopath Assoc. 2004;104:332–6. [PubMed] [Google Scholar]
- 13.Hamdy H, Prasad K, Anderson MB. BEME systematic review: predictive values of measurements obtained in medical schools and future performance in medical practice. Med Teach. 2006;28:103–16. doi: 10.1080/01421590600622723. [DOI] [PubMed] [Google Scholar]
- 14.Compton S, Henderson W, Schwartz L, Wyte C. A critical examination of the USMLE II: does a study month improve test performance? Acad Emerg Med. 2000;7:1167. [PubMed] [Google Scholar]
- 15.Werner LS, Bull BS. The effect of three commercial coaching courses on Step One USMLE performance. Med Educ. 2003;37:527–31. doi: 10.1046/j.1365-2923.2003.01534.x. [DOI] [PubMed] [Google Scholar]


