

Abstract
DNA exhibits a surprising multiplicity of structures when it is packed into dense aggregates. It undergoes various polymorphous transitions (e.g., from the B to A form) and mesomorphous transformations (from hexagonal to orthorhombic or monoclinic packing, changes in the mutual alignment of nearest neighbors, etc). In this report we show that such phenomena may have their origin in the specific helical symmetry of the charge distribution on DNA surface. Electrostatic interaction between neighboring DNA molecules exhibits strong dependence on the patterns of molecular surface groups and adsorbed counter-ions. As a result, it is affected by such structural parameters as the helical pitch, groove width, the number of base pairs per helical turn, etc. We derive expressions which relate the energy of electrostatic interaction with these parameters and with the packing variables characterizing the axial and azimuthal alignment between neighboring macromolecules. We show, in particular, that the structural changes upon the B-to-A transition reduce the electrostatic energy by ≈kcal/mol per base pair, at a random adsorption of counter ions. Ion binding into the narrow groove weakens or inverts this effect, stabilizing B-DNA, as it is presumably the case in Li+-DNA assemblies. The packing symmetry and molecular alignment in DNA aggregates are shown to be affected by the patterns of ion binding.
We recently suggested a theory of electrostatic interaction between two macromolecules with parallel cylindrical cores and arbitrary surface charge distributions (1). Applied to helical molecules, it explained such puzzling observations as DNA over-winding from 10.5 bp/turn in solution to 10 in hydrated fibers, counter-ion specificity in DNA condensation, mysteriously small decay lengths of the forces observed over the last 15 Å of separation between DNA, collagen, and four-stranded guanosine helices, etc. We found that all these effects are driven by the helical symmetry of the charge distributions and formulated the corresponding symmetry laws (2).
This theory was based on the solution of the linearized Poisson–Boltzmann equation for the electric field created by two opposing macromolecules in electrolyte solution (1). Such model may become invalid at small distances between helices due to effects of the finite size of electrolyte ions and water molecules and due to the breakdown of linear electrostatics. We, therefore, used it to interpret the phenomena observed in “wet” DNA assemblies. However, DNA helices in chromosomes, phage heads, and inside some cell nuclei are separated by only one to two monolayers of water. Crystallographic studies of even denser aggregates of natural DNA at ≤90% relative humidity revealed structural poly- and meso-morphism (3, 4), which is still poorly understood.
Generally, poly- and meso-morphous transitions are driven by intra- and inter-molecular stresses. Various approaches have been used for evaluation of different components of these stresses in DNA. For an isolated DNA molecule in solution, these include analytical and computer calculations of its electrostatic energy (see, e.g., refs. 5–15) and computer simulations of its energetics and dynamics based on simplified and all-atom potentials (see, e.g., refs. 16–23 and references therein). Geometrical analysis of inter-molecular fitting in aggregates of DNA oligomers also was reported (24, 25).
In the present work, we evaluate inter-molecular electrostatic interactions in DNA aggregates and investigate their role in the structural and packing transitions. Our goal is to understand the dependence of the electrostatic interaction energy on the structural parameters of DNA, such as the helical pitch, the number of charges per turn, and the groove width, as well as on the mutual alignment of neighboring helices. To the best of our knowledge, this is one of the least understood aspects of the overall problem.
Specifically, we calculate the electrostatic interaction energy between DNA molecules in columnar aggregates where helices are parallel to each other. As before (1), we assume that the interactions between helices are pairwise additive and calculate the interaction energy for two nearest neighbors. Unlike the previous model, we consider those aggregates, which contain only residual, bound water, and trapped counter-ions. We describe the dielectric response of the whole aggregate by a single dielectric constant, ɛ ≈ 2, determined by the electronic polarizability. We treat all fixed surface charges on DNA, counter-ions, and fixed fractional charges on bound water molecules explicitly; we do not restrict their location to any specific cylindrical surface, and we do not presume, generally, that the charges are point-like. In such formulation, the problem of dielectric saturation (26) does not arise because only electronic polarizability is treated within the continuous dielectric approximation. The limitations of the Poisson–Boltzmann approximation at short distances (9, 27–29) are absent as well because there is no Debye atmosphere of electrolyte ions.
We use this approach to study the dependence of the electrostatic interaction energy on the charge distribution pattern and on the mutual azimuthal orientation of neighboring helices at a given interaxial separation between them. This reveals electrostatic motives of poly- and meso-morphism in the aggregates. We discuss only those effects that are not accompanied by any considerable variation of the aggregate density because fractional water charges may rearrange significantly with changing distance between the macromolecules. [In terms of the continuous description, this would mean strong dependence of an effective water dielectric constant on the distance between helices (30, 31).]
Note that hydration forces (32, 33) as well as steric and direct hydrogen-bonding interactions (24) also are affected by changes in DNA structure and packing. These “nonelectrostatic” forces are likely to contribute to the discussed transitions, but their analysis is beyond the scope of this work.
THEORY
Basic Expression for the Pair Potential.
Consider the electrostatic interaction between two neighboring molecules in a dense aggregate (Fig. 1). For a given distribution of charged surface groups, counter-ions, and fractional water charges, which all add up to the total charge density ρ(r), the electrostatic potential ϕ(r) is described by the Poisson equation,
 |
1 |
where ϕ̃(k) and ρ̃(k) are the Fourier transforms of ϕ(r) and ρ(r), respectively.
Figure 1.

A sketch of the horizontal projection of a hexagonal aggregate of helical molecules. Shaded circles represent molecular backbones. All molecules are similar. Positive and negative charges, for simplicity shown only around the central molecule, are intrinsic surface charges, counter-ions, or fractional water charges. We assume that all essential charges are located within cylindrical shells shown by the dashed lines and neglect possible effects of charges, which may be located in interstices between the shells (a sample interstice is painted black). The thin solid circle with the radius a shows the radial center of mass of all charges associated with the central helix. The two-dimensional radius vectors R1 and R2 point from the coordinate origin to the central axes of the molecules 1 and 2, respectively, R = R2 − R1.
To calculate ϕ̃(k), we define cylindrical shells coaxial with the molecules (Fig. 1). Each shell encloses all charged groups of the molecule, adsorbed counter-ions, and bound water molecules. The shells of two neighboring molecules, labeled as ν,μ = 1,2, touch each other. The radius of each shell is R/2 where R = |R| is the interaxial distance between the molecules, R = R2 − R1, Rν is the 2D radius-vector from the center of Cartesian coordinates to the central axis of the shell ν (Fig. 1). We describe the charge density inside each shell in cylindrical coordinates (rν, zν, φν) associated with the central axis of the corresponding molecule so that ρ̃(k) = ρ̃1(k) + ρ̃2(k), where
 |
2 |
 |
Using the cylindrical Fourier transforms ρ̃v(rv, q, n) of ρv(rv, zv, φv),
 |
3 |
we find
 |
4 |
 |
where ϕ1,2 is the potential inside the first shell created by charges located inside the second shell, φk and φR are the azimuthal angles of the vectors k and R correspondingly, and Jn(x) is the Bessel function of n-th order.
Neglecting the effects from charges which may be located in the interstices between the shells, such as the black region shown in Fig. 1, we write the electrostatic interaction energy as
 |
5 |
 |
For the helices of the length L, after some algebra similar to that described in Appendix of ref. 1, we find
 |
6 |
 |
where Kn(x) and In(x) are the modified Bessel functions of n-th order. We introduce the charge density correlation function,
 |
 |
7 |
based on the “effective” surface charge density at the radial center of mass rν = a of the charge distribution (Fig. 1),
 |
8 |
In the case when all charges are point-like and located on a single cylindrical surface,
 |
9 |
where δ(x) is the Dirac delta function.
Interaction Between DNA Molecules.
Most important fixed charges on DNA surface are those of phosphate groups. These groups lie on two helical strands separated by the minor and major grooves, as defined with respect to the orientation of the base pairs. Note that in B-DNA the minor grove is the narrow one, whereas in A-DNA it is the wide one. The structural parameters characterizing the phosphate pattern are the helical pitch H, the azimuthal half-width of the minor groove, φ̃s (Fig. 2A), and the number of phosphates (base pairs) per helical turn N = H/h, where h is the axial rise per phosphate (see Table 1).
Figure 2.

An azimuthal (A) and axial (B) alignment of two neighboring B-DNA molecules. The sketch A is constructed as follows. We select the plane z = 0 at an arbitrary height. We then project the positions of two phosphates on molecule 1, each belonging to a different strand and nearest to the z = 0 plane. These projections are shown by the small, filled circles numbered as #1 and #2. We repeat the same projection procedure for molecule 2. We define the phosphate #1 on each molecule as the phosphate located at the major-to-minor groove crossover upon the counter clockwise rotation around the corresponding molecular axis. The angles φ′1 and φ′2 between the phosphates #1 and the direction of the vector R, defined as shown, give the azimuthal orientation of each molecule. The continuous helical lines in B are drawn through the centers of phosphate groups along the two strands of each molecule. H is the helical pitch, Δz is the axial shift needed to superimpose these helical lines after the lateral translation merging the axes of the molecules. The value of Δz characterizes the axial alignment.
Table 1.
Structural parameters of natural DNA in B and A forms (43)
| Structure type | a (Å) | H (Å) | g (Å−1) | G (Å−1) | N (G/g) | φ̃s (rad) | σ̄ (μC/cm2) |
|---|---|---|---|---|---|---|---|
| A | 9 | 28.2 | 0.223 | 2.45 | 11 | 0.66π | 22.1 |
| B | 9 | 33.8 | 0.186 | 1.86 | 10 | 0.40π | 16.8 |
The radius a characterizes the location of centers of phosphate groups, and it is smaller than the van der Waals radius of DNA. σ̄ is calculated under the assumption that each phosphate has a unit elementary charge.
Based on the phosphate pattern, we describe the charge density correlation function for two opposing DNA helices as (detailed derivation will be presented elsewhere)
 |
10 |
 |
 |
11 |
 |
where  is the average surface charge
density of phosphates, g =
2π/H, G
=2π/h, the angle φ′ν
characterizes the azimuthal orientation of the molecule ν
as shown in Fig. 2A, Δz is the axial
shift between opposing molecules (Fig. 2B),
δx, y is the Kroenecker delta. We
approximate each phosphate group by a spherically symmetric charge
density.
is the average surface charge
density of phosphates, g =
2π/H, G
=2π/h, the angle φ′ν
characterizes the azimuthal orientation of the molecule ν
as shown in Fig. 2A, Δz is the axial
shift between opposing molecules (Fig. 2B),
δx, y is the Kroenecker delta. We
approximate each phosphate group by a spherically symmetric charge
density.
This expression describes the discrete, periodical pattern of phosphates and a simplified model for the smeared distribution of counter-charges and fractional water charges. We assume that the radial “center of mass” of the overall charge distribution lies on the cylindrical surface passing through centers of phosphate groups. Counter-ions and water charges follow the helical pattern of phosphates, but unlike phosphates they may be delocalized or even completely disordered. Their axial distribution, relative to the center, of the minor groove is characterized by the form-factor P̃(q) = P̃ion(q) + P̃water(q). To describe the counter-ion pattern, we use the following approximation
 |
12 |
where f1, f2, and f3 are the fractions of counter-ions bound in the center of the minor and major grooves and on the phosphate strands, respectively, and (1 − f1 − f2 − f3) is the fraction of ions distributed randomly. In dense aggregates, counter-ions must fully compensate the charge of phosphates. This implies that s0,01,2(0) = 0, i.e., P̃ion(0) = 1.
The electrostatic contribution of bound water is described via the water form-factor P̃water(q). Because of water electro-neutrality, P̃water(0) = 0. Completely disordered water gives P̃water(q) 0. At a typical concentration [≈10 water molecules/phosphate (34)], ordered water in a dense DNA aggregate is likely to be close to the full dielectric saturation. If the only source of the order is water polarization around phosphates and counter-ions, the values of q, which contribute significantly to P̃(q), are q ∼ 2π/l, where l ∼ 3 Å is the characteristic distance between water molecules, i.e., q ∼ 2 Å−1 ≫ g (see Table 1). The contribution of such values of q to the interaction energy is negligible. At the same time, one may imagine that water forms hydrogen-bonded hydration spines such as those presumed to exist in crystals of oligonucleotides (35). This may give rise to nonnegligible P̃water(q) at q ∼ g. If the structure of these spines would be known from x-rays, NMR, or computer simulations, we could calculate their contribution into the electrostatic interaction energy. In the absence of sufficient information about such structures in dense aggregates of long, natural DNA, we analyze only the effects associated with phosphates and counter-ions and, thus, omit the terms containing P̃water(q).
Within this approximation, the energy of interaction between DNA helices is
 |
13 |
The main term,
 |
14 |
 |
corresponds to the interaction of helices whose strands form continuous, charged helical lines. The other two terms,
 |
15 |
 |
 |
16 |
 |
 |
 |
describe the effects associated with discreteness of phosphates along the strands at integer number of phosphates per helical turn, N.
Note that Eint(1)(R) ≫ Eint(2)(R) + Eint(3)(R) when the majority of counter-ions are located off the phosphate strands. As a rule, it is enough to take into account only the first three terms in the sum (14). This gives a transparent dependence of the interaction energy on the DNA structural parameters H(=2π/g) and φ̃s and on the mutual alignment of helices, Δz. The terms Eint(2)(R) and Eint(3)(R) are responsible for the dependence of the interaction energy on the azimuthal orientation φ′ν of each helix in the aggregate.
RESULTS AND DISCUSSION
Two- and Many-Body Interactions in Densely Packed DNA Fibers.
Eqs. 13–16 describe the pair interaction potential between any two helices in a densely packed fiber. Because of the additivity of coulombic interactions, the electrostatic energy of the fiber is the sum of all pairwise energies. Furthermore, because of the electroneutrality, the pair interaction potential decreases very rapidly with increasing separation between helices so that only the nearest neighbor interactions are important. Thus, the total energy is just the sum of such two-body interactions. Nevertheless, the two-body potential nontrivially depends on the orientation of each molecule. A change in the molecular orientation simultaneously affects several pairs of interactions. This results in many-body correlations and the corresponding contributions to the energy and entropy of the aggregate.
Below, we focus on the most important properties of the two-body potential in DNA fibers. We also qualitatively discuss the many-body effects and their role in DNA poly- and meso-morphism, expected as a result of the peculiar angular dependence of the pair potential. In principle, the many-body problem can be analyzed in greater detail quantitatively on the basis of the pair potential derived here. This could be a subject of future analytical and Monte Carlo simulation studies.
Electrostatics of the B-to-A transition.
This transition was observed in a single DNA molecule in mixed solvent solutions (36) and upon removal of water from hydrated DNA aggregates (4). For a single molecule, a number of models and computer simulations of the transition were reported (see, e.g., refs. 12, 37–41). These studies highlighted the role of specific DNA hydration patterns and of the DNA interaction with counter-ions. In DNA aggregates, experimental evidence suggested that the transition is also affected by inter-molecular interactions (34). It is, therefore, important to understand how the change in the structural parameters of DNA upon the transition (shown in Table 1) affects the energy of inter-molecular electrostatic interaction.
Using the traditional language of chemical reaction kinetics
(42), we introduce a “reaction coordinate,” x (0 ≤
x ≤ 1) for the B-to-A transition such
that x = 0 in the B form and
x = 1 in the A form. Specifically, from Eqs.
13-16, we find that the variation in
φ̃s has the dominant effect on the change
in the electrostatic interaction energy upon the transition. Thus, we
define the reaction coordinate as x = (φ̃s −
φ̃s(B))/(φ̃s(A) −
φ̃s(B)), where the superscripts label the
A and B forms of DNA, respectively, and the
intermediate states 0 < x < 1 are characterized by the
half-width of their minor groove, φ̃s. We
also assume that g, G, and  have linear dependence on x because their variation does not
exceed 20%. This allows us to visualize the potential energy landscape
for the B-to-A transformation as a function of
x and of the axial alignment Δz/H.
have linear dependence on x because their variation does not
exceed 20%. This allows us to visualize the potential energy landscape
for the B-to-A transformation as a function of
x and of the axial alignment Δz/H.
The “coarse resolution” energy landscape is shown in Fig. 3§ as the plot of Eint(1)(x,Δz/H) at random adsorption of counter-ions (Eint(1) ≫ Eint(2) + Eint(3)). This plot shows that the transition from B to A form is accompanied by ∼2 kBT of electrostatic interaction energy gain per DNA base pair as a result of minimizing unfavorable repulsion between opposing phosphates (the unit of thermal energy kBT ≈ 0.6 kcal/mol). More favorable phosphate pattern in the A form overweighs the unfavorable increase in the density of phosphates on DNA surface. This is because the structure of the A form allows more favorable axial separation of phosphate charges on the opposing molecules.
Figure 3.
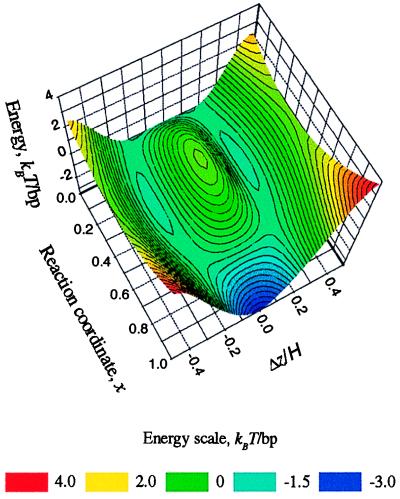
Pair-interaction potential landscape for the B-to-A transition in DNA fibers. Eint(1) in kBT units per base pair (bp) is plotted at a fixed interaxial separation R = 23 Å as a function of the axial alignment (Δz) and of the effective “reaction coordinate” (x) of the transition (x = 0 in the B-form and x = 1 in the A-form). The energy has two minima at Δz/H ≈ ±0.15 in the B form and one minimum at Δz = 0 in the A form. The energy scale is color coded as shown at the bottom. The landscape is symmetric with respect to the Δz = 0 plane. Note that the “reaction trajectory” along the two valleys, most favorable with respect to the electrostatic pair-interaction potential, may differ from the real optimal trajectory because the plotted energy landscape does not include the many-body effects and the internal mechanical energy of the molecules.
Fig. 3 shows that pair electrostatic interactions are optimized at Δz = 0 alignment of opposing molecules in the A-form and at Δz ≠ 0 in the B form. In fact, these are the alignments experimentally observed in fibers from natural DNA (4). The difference is significant because Δz = 0, but not Δ z ≠ 0, can be realized between all pairs at any lateral packing in an aggregate. Thus, close packing of B-DNA may produce energetically unfavorable frustrations of pairwise alignment, unlike similar packing of A-DNA. Detailed calculation of the free energy cost associated with such frustration requires full solution of the many-body problem.
Preferential adsorption of counter ions may influence the B-to-A transition and the Δz-alignment by changing the picture of the axial charge separation and, thus, affecting how well the opposing molecules can adjust to each other. In particular, Fig. 4 shows the change in the optimal value of Δz (Inset) and the change in the electrostatic cost of the transition upon preferential adsorption into the middle of the narrow groove. The stronger counter ion localization in the narrow groove favors the B form at more than ∼20% localization, as this leads to lower electrostatic interaction energy than that between A-DNA helices. Note that the B-to-A transition occurs in Na+-DNA fibers at ∼90% relative humidity, but not in Li+-DNA, where B-form remains stable up to 66% (43). If Li+ is, indeed, preferentially adsorbed in the minor groove of B-DNA (43), this should contribute significantly to the stabilization of the B-form.
Figure 4.

Effect of counter-ion adsorption pattern on the B-to-A transition. The change in Eint(1) upon the transition is plotted vs. the fraction of ions (f) preferentially adsorbed in the middle of the narrow groove, at R = 23 Å and at the optimal Δz-alignment (f = 0 corresponds to completely random distribution of counter-ions along molecular surfaces). The optimal Δz in each DNA form is plotted in the insert as the function of f. The optimal Δz is a continuous function of f in B-DNA. It exhibits a discontinuous behavior in A-DNA, Δz = 0 at f < f* and Δz/H > 0.1 at f > f*, where f* ≈ 0.24.
Structural Mesomorphism of DNA Assemblies.
A variety of nonhexagonal structures has been observed in dense aggregates of natural A- and B-DNA at low humidity (4). A driving force for such transitions may be optimization of pairwise alignments of DNA molecules.
Specifically, Δz ≠ 0-alignment cannot be optimized at hexagonal packing. The resulting frustration of the alignment may be at least partially relieved in nonhexagonal structures, such as orthorhombic structures formed by Li+-B-DNA at low humidity where Δz ≠ 0 for the nearest neighbor pairs (4).
Furthermore, the electrostatic interaction energy depends on the pairwise rotational alignment described by the angles φ′1 and φ′2. Although this dependence is much less pronounced than the effect of Δz, it still may affect the packing in the aggregate. Fig. 5 displays the dependence of the interaction energy on φ′1 and φ′2 at constant Δz in both A and B DNA forms. This dependence is affected by the patterns of counter-ions adsorption (e.g., compare Fig. 5 B and C). The preferential angles cannot be satisfied in a hexagonal unit cell, but they could be realized, e.g., in monoclinic and orthorhombic unit cells observed in A- and B-DNA fibers (4, 44).
Figure 5.
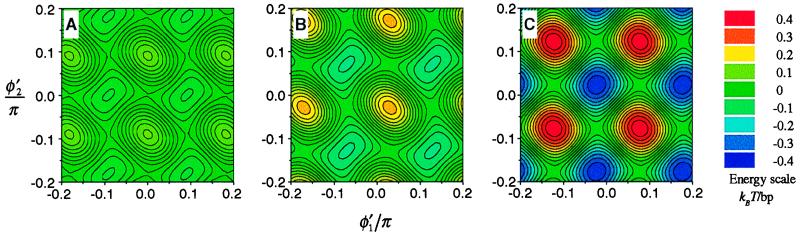
Dependence of electrostatic interaction energy on azimuthal orientation of neighboring DNA molecules. The dependence of Eint(2) + Eint(3) on φ′1 and φ′2 is shown at R = 23 Å and at optimal Δz for A-DNA helices at f = 0 (A), B-DNA helices at f = 0 (B), and B-DNA helices at f = 0.5 (C). The contours represent lines of constant energy. The values of the energy in the units of thermal energy (kBT) per base pair are shown by the color code. Different energy landscapes in the pair interaction may lead to different lateral packing of helices in these three cases.
Thermal Disorder Effects.
One may argue that the structure and mutual alignment of DNA helices are not truly static. They are perturbed by thermal motions which could, in principle, affect our analysis. However, the following estimate suggests that the amplitudes of such motions in dense DNA fibers are small enough to be neglected, at least in the first approximation. Consider, for example, torsional fluctuations. In solution, their mean-square amplitude increases with the size of DNA fragments. Significant fluctuations, capable of distorting the essential helical symmetry (rms amplitude ∼ 1 rad), occur only when the fragments have the length ltors ∼ C/kBT ∼ 300–1,000 Å or larger. Here C ≈ 1–3 10−19 erg cm (45) is the torsional elasticity modulus of DNA. In dense fibers, such fluctuations are eliminated by the enormous electrostatic cost, exceeding 100 kBT per ltors (∼1 kBT/bp, see Figs. 3 and 4). The electrostatic interaction energy is so strong that by itself it should be sufficient to ensure the crystalline-like order in densely packed DNA fibers, as it is observed (e.g., see ref. 3) by x-ray diffraction.
CONCLUSIONS
The goal of this report is to highlight the relationship between intermolecular electrostatic interactions in dense DNA aggregates and the helical symmetry of phosphate and adsorbed counter-ion distributions. To our knowledge, this never has been investigated before due to the absence of a closed form theory for the interaction between helices with discrete charge patterns. We analyze the electrostatic pair-interaction potential between DNA helices with random and various fixed counter-ion distributions and suggest that a variety of cooperative transitions in DNA aggregates may be affected by the nontrivial azimuthal and axial dependence of the potential.
We limit our discussion to aggregates of long, natural DNA with monovalent counter-ions. Such aggregates were used, e.g., in the original experiments, which led to the discovery of DNA structure. Our theory may be extended to describe more complex effects of multivalent counter-ions, particularly when their binding sites are known but this is beyond the scope of the present work. This theory is not likely to be appropriate for crystals of oligonucleotides. Modeling of such aggregates still poses a considerable challenge. Because of the short length of DNA fragments, the edge effects are likely to become important and the role of the helical symmetry (which enables us to perform analytical calculations here) is likely to be diminished.
Even with respect to the aggregates of long, natural DNA, there is still much to be understood. We view this work as a first step toward creating the self-consistent, complete theory of electrostatic interactions between DNA helices. Future development should incorporate the pair potential into a statistical theory that will take into account possible changes in the counter-ion and water adsorption patterns upon the structural transitions as well as many-body correlations in the alignment of neighboring helices. It also seems promising to combine our analytical theory of electrostatic interactions with computer-assisted calculations of other contributions to the pair potential. This may facilitate quantitative analysis of various DNA conformations and packing structures.
Of course, electrostatic interactions do not describe the energetics of DNA aggregates completely. Hydration forces, steric interactions, and hydrogen bonds also may contribute, their role being widely disputed in the literature. Hence, the theory presented here is rigorous within its assumptions, but the discussion of experiments is conjectural. Still, we have shown that the effects associated with helical symmetry patterns in surface charge distributions are very strong. They may be responsible for the energy gains of several kBT per DNA base pair. We also have demonstrated that these effects are in line with a number of experimental observations, which are puzzling otherwise. We have no direct evidence that the interactions discussed here are the dominant driving forces of the observed phenomena. Nevertheless, the estimated amplitude of these interactions suggests that, at the very least, they should be major contributors.
Finally, we have focused here on the columnar aggregates of DNA, but the same formalism may be extended (with proper modifications) to other systems, such as bundles of a-helices forming domains of many proteins, interaction between trans-membrane α-helices, and DNA–DNA interaction in nucleosomes, etc.
Acknowledgments
The authors are thankful to Adrian Parsegian, Don Rau, and Viktor Zhurkin for useful discussions. A.A.K. acknowledges the National Institutes of Health for the financial support of his visits to Bethesda.
Footnotes
This paper was submitted directly (Track II) to the Proceedings Office.
Of course, this landscape is somewhat artificial. It describes the complex change in DNA structure with the help of a single effective reaction coordinate, it represents the pair interaction potential rather than the full potential energy, and it incorporates only the electrostatic interaction energy. Still, we find it to be heuristically useful because it clearly illustrates the strong and nontrivial coupling between the structure, mutual alignment and electrostatic interaction in DNA fibers. Furthermore, the structures with 0 < x < 1 are not pure abstractions, e.g., a number of DNA fragments with structures intermediate between the canonical B and A forms have been observed in oligonucleotide crystals (35).
References
- 1.Kornyshev A A, Leikin S. J Chem Phys. 1997;107:3656–3674. ; Erratum (1998) 108, 7035. [Google Scholar]
- 2.Kornyshev, A. A. & Leikin, S. (1998) Biophys. J., in press. [DOI] [PMC free article] [PubMed]
- 3.Wilkins M H F. Cold Spring Harbor Symp Quant Biol. 1956;21:75–87. doi: 10.1101/sqb.1956.021.01.007. [DOI] [PubMed] [Google Scholar]
- 4.Langridge R, Wilson H R, Hooper C W, Wilkins M H F, Hamilton L D. J Mol Biol. 1960;2:19–37. [Google Scholar]
- 5.Bailey J M. Biopolymers. 1973;12:559–574. [Google Scholar]
- 6.Manning G S. Quart Rev Biophys. 1978;11:179–246. doi: 10.1017/s0033583500002031. [DOI] [PubMed] [Google Scholar]
- 7.Soumpasis D. J Chem Phys. 1978;69:3190–3196. [Google Scholar]
- 8.Pullman A, Pullman B. Quart Rev Biophys. 1981;14:289–380. doi: 10.1017/s0033583500002341. [DOI] [PubMed] [Google Scholar]
- 9.Frank-Kamenetskii M D, Anshelevich V V, Lukashin A V. Sov Phys Usp. 1987;30:317–330. [Google Scholar]
- 10.Conrad J, Troll M, Zimm B H. Biopolymers. 1988;27:1711–1732. doi: 10.1002/bip.360271103. [DOI] [PubMed] [Google Scholar]
- 11.Jayaram B, Sharp K A, Honig B. Biopolymers. 1989;28:975–993. doi: 10.1002/bip.360280506. [DOI] [PubMed] [Google Scholar]
- 12.Jayaram B, Beveridge D L. J Phys Chem. 1990;94:4666–4671. [Google Scholar]
- 13.Anderson C F, Record M T. Annu Rev Phys Chem. 1995;46:657–700. doi: 10.1146/annurev.pc.46.100195.003301. [DOI] [PubMed] [Google Scholar]
- 14.Duguid J G, Bloomfield V A. Biophys J. 1996;70:2838–2846. doi: 10.1016/S0006-3495(96)79853-3. [DOI] [PMC free article] [PubMed] [Google Scholar]
- 15.Wagner K, Keyes E, Kephart T W, Edwards G. Biophys J. 1997;73:21–30. doi: 10.1016/S0006-3495(97)78043-3. [DOI] [PMC free article] [PubMed] [Google Scholar]
- 16.Levitt M. Cold Spring Harbor Symp Quant Biol. 1983;47:251–262. doi: 10.1101/sqb.1983.047.01.030. [DOI] [PubMed] [Google Scholar]
- 17.Malenkov G G. In: The Chemical Physics of Solvation. Dogonadze R R, Kalman E, Kornyshev A A, Ulstrup J, editors. Amsterdam: Elsevier; 1988. , Part C, pp. 665. [Google Scholar]
- 18.Beveridge D L, Ravishanker G. Curr Opin Struct Biol. 1994;4:246–255. [Google Scholar]
- 19.Mackerell A D, Wiorkiewicz-Kuczera J, Karplus M. J Am Chem Soc. 1995;117:11946–11975. [Google Scholar]
- 20.Teplukhin A V, Zhurkin V B, Jernigan R, Poltev V I. Mol Biol. 1996;30:75–84. [PubMed] [Google Scholar]
- 21.Olson W K. Curr Opin Struct Biol. 1996;6:242–256. doi: 10.1016/s0959-440x(96)80082-0. [DOI] [PubMed] [Google Scholar]
- 22.Beveridge D L, Young M A, Sprous D. ACS Symp Ser. 1998;682:260–284. [Google Scholar]
- 23.Cheatham T E, Miller J L, Spector T I, Cieplak P, Kollman P A. ACS Symp Ser. 1998;682:285–303. [Google Scholar]
- 24.Timsit Y, Moras D. In: Methods in Enzymology. Lilley M J, Dahleberg J E, editors. Vol. 211. San Diego: Academic; 1992. pp. 409–429. [DOI] [PubMed] [Google Scholar]
- 25.Timsit Y, Moras D. J Mol Biol. 1995;251:629–647. doi: 10.1006/jmbi.1995.0461. [DOI] [PubMed] [Google Scholar]
- 26.Jayaram B, Beveridge D L. Annu Rev Biophys Biomol Struct. 1996;25:367–394. doi: 10.1146/annurev.bb.25.060196.002055. [DOI] [PubMed] [Google Scholar]
- 27.Fixman M. J Chem Phys. 1979;70:4995–5005. [Google Scholar]
- 28.Le Bret M, Zimm B. Biopolymers. 1984;23:271–285. doi: 10.1002/bip.360230208. [DOI] [PubMed] [Google Scholar]
- 29.Le Bret M, Zimm B. Biopolymers. 1984;23:287–312. doi: 10.1002/bip.360230208. [DOI] [PubMed] [Google Scholar]
- 30.Kornyshev A A. In: The Chemical Physics of Solvation. Dogonadze R R, Kalman E, Kornyshev A A, Ulstrup J, editors. Amsterdam: Elsevier; 1985. , Part A, pp. 77. [Google Scholar]
- 31.Mazur J, Jernigan R L. Biopolymers. 1991;31:1615–1629. doi: 10.1002/bip.360311316. [DOI] [PubMed] [Google Scholar]
- 32.Leikin S, Parsegian V A, Rau D C, Rand R P. Annu Rev Phys Chem. 1993;44:369–395. doi: 10.1146/annurev.pc.44.100193.002101. [DOI] [PubMed] [Google Scholar]
- 33.Strey H H, Podgornik R, Rau D C, Parsegian V A. Curr Opin Struct Biol. 1998;8:309–313. doi: 10.1016/s0959-440x(98)80063-8. [DOI] [PubMed] [Google Scholar]
- 34.Lavalle N, Lee S A, Rupprecht A. Biopolymers. 1990;30:877–887. doi: 10.1002/bip.360300903. [DOI] [PubMed] [Google Scholar]
- 35.Dickerson R E. In: Methods in Enzymology. Lilley M J, Dahleberg J E, editors. Vol. 211. San Diego: Academic; 1992. pp. 67–111. [DOI] [PubMed] [Google Scholar]
- 36.Ivanov V I, Krylov D Y. In: Methods in Enzymology. Lilley M J, Dahleberg J E, editors. Vol. 211. San Diego: Academic; 1992. pp. 111–127. [DOI] [PubMed] [Google Scholar]
- 37.Eyster J M, Prohofsky E W. Biopolymers. 1977;16:965–982. doi: 10.1002/bip.1977.360160503. [DOI] [PubMed] [Google Scholar]
- 38.Zhurkin V B, Lysov Y P, Ivanov V I. Biopolymers. 1978;17:377–412. doi: 10.1002/bip.1980.360190802. [DOI] [PubMed] [Google Scholar]
- 39.Soumpasis D M, Wiechen J, Jovin T M. J Biomol Struct Dyn. 1987;4:535–552. doi: 10.1080/07391102.1987.10507658. [DOI] [PubMed] [Google Scholar]
- 40.Yang L, Pettit B M. J Phys Chem. 1996;100:2564–2566. [Google Scholar]
- 41.Cheatham III T E, Kollman P A. J Mol Biol. 1996;259:434–444. doi: 10.1006/jmbi.1996.0330. [DOI] [PubMed] [Google Scholar]
- 42.Benson S W. The Foundations of Chemical Kinetics. New York: McGraw Hill; 1960. [Google Scholar]
- 43.Saenger W. Principles of Nucleic Acid Structure. New York: Springer; 1984. [Google Scholar]
- 44.Dover S D. J Mol Biol. 1977;110:699–700. doi: 10.1016/s0022-2836(77)80085-5. [DOI] [PubMed] [Google Scholar]
- 45.Crothers D M, Drak J, Kahn J D, Levene S D. In: Methods in Enzymology. Lilley D M J, Dahlberg J E, editors. 212 B. San Diego: Academic; 1992. pp. 3–29. [DOI] [PubMed] [Google Scholar]