

Abstract
Objective
Abnormalities of basal ganglia structure in schizophrenia have been attributed to the effects of antipsychotic drugs. Our aim was to test the hypothesis that abnormalities of basal ganglia structure are intrinsic features of schizophrenia, by assessing basal ganglia volume and shape in the unaffected siblings of schizophrenia subjects.
Method
The study involved 25 pairs of schizophrenia subjects and their unaffected siblings and 40 pairs of healthy controls and their siblings. Large deformation, high-dimensional brain mapping was used to obtain surface representations of the caudate, putamen, and globus pallidus. Surfaces were derived from transformations of anatomical templates and shapes were analyzed using reduced-dimensional measures of surface variability (i.e. principal components and canonical analysis). Canonical functions were derived using schizophrenia and control groups, and were then used to compare shapes in the sibling groups. To visualize shape differences, maps of the estimated surface displacement between groups were created.
Results
In the caudate, putamen and globus pallidus, the degree of shape abnormality observed in the siblings of the schizophrenia subjects was intermediate between the schizophrenia subjects and the controls. In the schizophrenia subjects, significant correlations were observed between measures of caudate, putamen and globus pallidus structure and the selected measures of lifetime psychopathology.
Conclusions
Attenuated abnormalities of basal ganglia structure are present in the unaffected siblings of schizophrenia subjects. This finding implies that basal ganglia structural abnormalities observed in subjects with schizophrenia are at least in part an intrinsic feature of the illness.
Keywords: Schizophrenia, Siblings, Basal Ganglia, Caudate, Putamen, Globus Pallidus
Evidence from family, twin and adoption studies suggest that genetic factors play an important role in the pathogenesis of schizophrenia (1,2). Consistent with the involvement of genetic factors in schizophrenia, cognitive (3,4), neurologic (5,6) and neurobiological (7,8) abnormalities have been found in the unaffected relatives of schizophrenia subjects, generally in attenuated form.
A number of lines of research suggest that basal ganglia abnormalities might also have genetic associations in schizophrenia. The basal ganglia play important roles in the regulation of both motor and non-motor functions (9–11), and motor abnormalities can occur in neuroleptic-naïve schizophrenia patients (12). Basal ganglia dysfunction, assessed with functional MRI, has been reported in schizophrenia and their unaffected siblings (13–15). Also, the caudate is involved in smooth pursuit and saccadic eye movement (16,17), which have been shown to be abnormal in individuals with schizophrenia and their relatives (18,19).
Enlargement of basal ganglia volume in schizophrenia has been reported (20–22); however, these findings have been generally attributed to treatment with older generation (“typical”) antipsychotic medications that act primarily as antagonists at D2-type dopamine receptors in the basal ganglia (23,24). Volumetric abnormalities in various brain areas have been reported in the non-psychotic first-degree relatives of schizophrenia patients (25–27), but there have been relatively few studies of basal ganglia structure in this population. Reduced volume of the right putamen has been reported in the unaffected siblings of subjects with schizophrenia (28). Other authors however did not find a significant difference in basal ganglia structures between the siblings of schizophrenia subjects and controls (21, 29).
We have previously used large-deformation high-dimensional brain mapping (HDBM-LD) (30, 31), to characterize shape deformities of the hippocampus (32) and thalamus (33) in unaffected siblings of schizophrenia subjects. Shape analysis has been shown to be complementary to volumetry in discriminating between normal and neuropsychiatric conditions (34,35). Recently, we used shape analysis to characterize basal ganglia structure in subjects with schizophrenia (36). Abnormal shape of the caudate has also been reported in antipsychotic-naïve subjects with schizotypal personality disorder (37), which is genetically linked to schizophrenia.
The objective of our current study was to test the hypothesis that abnormalities of basal ganglia structure are present in the unaffected siblings of individuals with schizophrenia. This hypothesis is based on the premise that genetic factors that influence the pathogenesis of schizophrenia could also alter the neurodevelopment of these structures. Schizophrenia subjects recruited for this study were generally treated with atypical antipsychotic drugs, but their siblings had not and were still within the age of risk for developing the disorder. Therefore, at least in siblings, we were able to assess basal ganglia structure as it is related to schizophrenia without the confounding effects of treatment factors. In addition to antipsychotic medications, recreational drugs are commonly used by schizophrenia patients and may also influence subcortical brain structure (38,39). Thus, we also explored the impact of significant substance use on basal ganglia structure. Finally, we investigated correlations between neuroanatomical measures and the severity of psychopathology on an exploratory basis.
METHODS
SUBJECTS
Four groups of subjects were recruited for this study by advertising in local area psychiatric clinics and in the community: schizophrenia probands (SCZ;n=25), unaffected siblings of schizophrenia probands (SCZ-SIB;n=25), healthy controls (CON;n=40), and siblings of healthy controls (CON-SIB;n=40). Siblings were full-siblings, based on self-report. From an initial group of 216 potential subjects that fit inclusion criteria (see below), the final group of study subjects were selected from those who had an MR scan of acceptable quality and whose sibling also completed MR scanning. This cohort of subjects was the same as that used in our previous report on the thalamus (33).
The demographic and clinical profiles of the subject groups are summarized in the TABLE 1. All subjects were diagnosed using DSM-IV criteria on the basis of a consensus between a research psychiatrist and a trained research assistant who used the Structured Clinical Interview for DSM-IV Axis I Disorders (SCID-I) (40). Subjects were excluded if they had neurologic disorders, unstable medical disorders, head injury with loss of consciousness, or if they met DSM-IV criteria for current substance abuse or dependence (i.e., during the month preceding assessment). Handedness was determined in all subjects as the hand used for writing. The cumulative amount of alcohol consumed during the two years preceding participation in the study was measured using structured questionnaires adapted from Skinner (1982;41).
TABLE 1.
Demographic, clinical and pharmacologic profiles.
| Characteristics/Profiles | SCZ n=25 | SCZ-SIB n=25 | CON-SIB n=40 | CON n=40 | F or χ2 | p |
|---|---|---|---|---|---|---|
| Age (yrs) | 22.6 (3.2) | 22.3 (3.5) | 20.0 (3.5) | 21.2 (3.6) | 3.68 | 0.01 |
| Gender (%) | χ2=18.4 | 0.0004 | ||||
| Female | 20.0 | 60.0 | 72.5 | 45.0 | ||
| Male | 80.0 | 40.0 | 27.5 | 55.0 | ||
| Race (%) | χ2=3.4 | 0.75 | ||||
| African American | 32.0 | 32.0 | 20.0 | 20.0 | ||
| Caucasian | 68.0 | 68.0 | 77.5 | 77.5 | ||
| Other | 0 | 0 | 2.5 | 2.5 | ||
| Handedness (%) | χ2=1.5 | 0.69 | ||||
| Right | 84.0 | 92.0 | 92.5 | 87.5 | ||
| Left | 16.0 | 8.0 | 7.5 | 12.5 | ||
| Parental Socioeconomic Statusa | 2.9 (1.2) | 2.9 (1.0) | 3.1 (0.9) | 2.9 (1.0) | 0.4 | 0.8 |
| Illness duration (yrs) | 4.6(4.4) | n/a | n/a | n/a | - | - |
| Current Antipsychotic (AP) (%)b | ||||||
| Atypical | 87.0 | 0 | 0 | 0 | - | - |
| Typical | 4.3 | 0 | 0 | 0 | - | - |
| Atypical & Typical | 8.7 | 0 | 0 | 0 | - | - |
| Lifetime Typical AP Use (%)c | 30.4 | 0 | 0 | 0 | - | - |
| Duration of Typical AP Use (months)d | 11.0 (7.0) | n/a | n/a | n/a | - | - |
| Lifetime Substance Dependence (%) | ||||||
| Alcohol | 28.0 | 12.0 | 0 | 5.0 | χ2=15.7 | 0.001 |
| Sedative/Hypnotic | 0 | 0 | 0 | 0 | - | - |
| Cannabis | 36.0 | 12.0 | 10.0 | 2.5 | χ2=15.9 | 0.001 |
| Stimulant | 0 | 4.0 | 2.5 | 0 | χ2=2.3 | 0.52 |
| Opioid | 0 | 0 | 0 | 0 | - | - |
| Cocaine | 0 | 4.0 | 2.5 | 0 | χ2=2.3 | 0.52 |
| Hallucinogen | 0 | 4.0 | 2.5 | 0 | χ2=2.3 | 0.52 |
| Total Alcohol Consumption in Last 2 yrs (kg) | 9.1 (14.8) | 7.6 (13.0) | 3.5 (6.7) | 5.2 (8.9) | 1.72 | 0.17 |
| Current Axis I Diagnosis (%) | ||||||
| Psychotic Disorder | 100 | 0 | 0 | 0 | χ2>100 | <0.0001 |
| Mood Disorder | 8.0 | 0 | 7.5 | 0 | χ2=5.2 | 0.16 |
| Anxiety Disorder | 16.0 | 16.0 | 10.0 | 2.5 | χ2=4.5 | 0.21 |
| Lifetime Axis I Diagnosis (%) | ||||||
| Psychotic Disorder | 100 | 0 | 0 | 0 | χ2>100 | <0.0001 |
| Mood Disorder | 52.0 | 52.0 | 35.0 | 2.5 | χ2=25.5 | <0.0001 |
| Anxiety Disorder | 20.0 | 24.0 | 15.0 | 5.0 | χ2=5.3 | 0.15 |
Values are means (standard deviation) unless stated otherwise.
F values were calculated using one-way ANOVA across all groups. The χ2 value is the result of a chi-square comparison.
Range is 1–5, with higher values indicating lower socioeconomic status. Minor differences in how the siblings reported their parental information account for the small differences in parental socioeconomic status
Atypical antipsychotics used (number of subjects) were risperidone (8), aripiprazole (5) olanzapine (5), clozapine (3), ziprasidone (3), and quetiapine (2). Typical antipsychotics used were haloperidol (1), thiothixene (1) and loxapine (1). Two SCZ were receiving an unknown study medication and were not used in calculating percentages.
Refers to lifetime use of scheduled typical antipsychotic for >1 week. Typical antipsychotics used on an “as needed” basis were not included.
Only patients with lifetime use of typical antipsychotics were used in calculating the mean. n/a=not applicable
SCZ were clinically stable; the global severity of their symptoms had remained unchanged for at least 2 weeks prior to the participation in the study. The majority of SCZ were currently on atypical antipsychotic drugs; only 3 SCZ subjects were currently treated with typical antipsychotics (see TABLE 1). Also, a lifetime history of scheduled typical antipsychotic drug use was reported by 7 SCZ subjects. CON had no lifetime history of Axis I psychotic or major mood disorders (i.e. major depression or bipolar disorder) or any first-degree relative with a psychotic disorder. SCZ-SIB were excluded if they had present or past Axis I psychotic disorders. CON-SIB were included as an additional comparison group, since a lifetime history of Axis I major mood disorders was not an exclusion criteria for SCZ-SIB subjects. CON-SIB were thus ascertained in a manner identical to SCZ-SIB: they were excluded if they had lifetime Axis I psychotic disorders, but not major mood disorders.
ASSESSMENT OF PSYCHOTIC SYMPTOMS
Measures of specific domains of psychopathology were derived in two ways. First, measures of lifetime history of psychopathology were derived for delusions, hallucinations, thought disorganization and negative symptoms using selected item scores extracted from the SCID-I. Scores for these domains of lifetime symptomatology were calculated as the sum of the corresponding item scores from the SCID-I (where absent=1, subthreshold=2, and present=3). Second, measures of current psychopathology were derived from the Scale for the Assessment of Negative Symptoms (SANS) and the Scale for the Assessment of Positive Symptoms (SAPS;42), the Structured Interview for Prodromal Syndromes (SIPS;43) and the Chapman Psychosis Proneness Scales (CPPS;44).
The domains for current symptomatology consisted of positive symptoms, negative symptoms, and thought disorganization, and were composed of the same items as in Delawalla et al. (45) but slightly modified as in Harms et al. (33) based on analyses of internal consistency in our larger subject sample (see supplemental information)
IMAGE ACQUISITION AND PREPROCESSING
Magnetic resonance (MR) scans of the whole brain were collected on a Siemens Magnetom Vision 1.5T imaging system using a 3D FLASH sequence (TR=20, TE=5.4, flip angle=30 degrees, number of acquisitions=1, voxel size=1×1×1 mm3, scanning time=13.5 minutes) Signal intensity differences across subjects were normalized by linear rescaling, using the intensity of the corpus callosum and the third ventricles as reference structures (46).
LARGE-DEFORMATION HIGH DIMENSIONAL BRAIN MAPPING (HDBM-LD)
An MR scan collected from a healthy comparison subject, not included in the study, was used to construct a neuroanatomical template as in prior studies (46, 39). In the construction of this template the right hemisphere caudate, putamen and globus pallidus were manually outlined by expert consensus using atlas (47) guidelines, supervised by a neuroradiologist with extensive neuroanatomical research experience (46). A set of landmarks were developed for placement within the basal ganglia-thalamus complex in MR scans of the template and each study subject (46). Transformation of the template MR scan onto the MR scan of study subjects (“subject scan”) occurred in a two-step process. First, the template scan was coarsely aligned to the left and right sides of each subject scan using the landmarks. Second, large deformation high-dimensional brain mapping (HDBM-LD) was used to determine the transformation between template and subject scan (48). During this transformation, the movement and deformation of template voxels were constrained by assigning them the physical properties of a fluid. The validity of HDBM-LD as used in this study has been demonstrated previously (46).
To derive a surface for each individual basal ganglia structure, a triangulated graph was first superimposed onto the surface of each structure outlined in the right hemisphere of the template scan. These surfaces were then carried along as the template scan was transformed to match the left and right sides of each of the subject scans. Volumes of the selected basal ganglia were calculated by computing the volumes enclosed by the transformed surfaces.
Measurements of total cerebral volume (excluding the ventricles, brainstem, and cerebellum) were obtained from Freesurfer, a semi-automated software package for segmentation and cortical surface reconstruction (49).
DATA ANALYSIS
Principal components analysis was used to reduce the high dimensionality of the surfaces of each structure, yielding an orthonormal set of principal components (PC) representing shape variation for each structure in the population under study (50). Each surface was projected into the space defined by the first 15 PCs for that structure, yielding 15 PC scores for each surface, which accounted for greater than 90% of total shape variance (across subjects and hemispheres).
To examine whether there were overall differences in the shapes of the basal ganglia structures across groups or hemisphere, MANOVA was applied to the PC scores of each basal ganglia structure (using all four subject groups). The 30 PC scores representing the left and right surfaces from each subject were entered as dependent variables, with hemisphere treated as a repeated factor, and gender included as a covariate. Next, to test for an ordered variation in shape across the subject groups, we computed a single set of 15 PC scores for each structure of each subject by averaging corresponding PC scores from the left and right hemisphere. We then performed canonical analysis using a general linear model with the averaged PC scores as dependent variables, and group and gender as predictor variables. The canonical analysis was designed to score the SCZ-SIB and CON-SIB along the dimension that “maximized” the difference between SCZ and CON. Thus, the canonical weighting coefficients were obtained from the contrast between SCZ and CON (33). A canonical score was obtained for each structure and subject by applying these weighting coefficients to the original dependent variables (i.e. PC scores).
Group differences in cerebral volume, basal ganglia volume, and canonical scores were assessed using mixed-model methods that explicitly estimated the covariance (correlation) in the residuals attributable to the sibling relationships. For basal ganglia volume, the mixed-model additionally included the correlation across hemispheres as part of the covariance structure. Gender was included as a covariate for all analyses of volume and canonical scores.
Model validity for the volumes and canonical scores was assessed by computing externally studentized residuals. Only the residuals from the volume of the putamen showed statistical evidence for a departure from normality (Shapiro-Wilk, p=0.0004; otherwise p>0.08). However, the skewness (0.59) and kurtosis (0.74) of that residual distribution was non-extreme. Three observations for putamen volume had a studentized residual >3 (but <4). However, visual examination of these revealed no odd appearing surfaces or segmentations. Notably, F-tests are robust for moderate departures from normality given a reasonable sample size (51), and thus we proceeded with statistical inference and testing under the mixed model for all structures.
RESULTS
VOLUME ANALYSES
Volume measures for the basal ganglia and cerebrum, and post-hoc comparisons, are summarized in TABLE 2. Volumes were compared across the four subject groups using a mixed linear model that specified group, hemisphere (for basal ganglia only), the interaction of group with hemisphere, and gender as fixed effects. Using this model, there was a significant effect of group status on cerebral volume (F[3,46]=6.3, p=0.001) and caudate volume (F[3,50]=3.77, p=0.016). There was a significant effect of hemisphere on caudate volume (left>right, F[1,54]=8.6,p=0.005), but no effect of group by hemisphere interaction (F[3,63]=0.9, p=0.43). The significant effect for the caudate disappeared after including cerebral volume as an additional covariate (F[3,46]=1.10, p=0.36).
TABLE 2.
Adjusted volumes of basal ganglia structures and the cerebrum.
| Brain Structure | Side | SCZ | SCZ-SIB | CON-SIB | CON | ||||
|---|---|---|---|---|---|---|---|---|---|
| Gender | Gender +Cerebral volume | Gender | Gender +Cerebral volume | Gender | Gender + Cerebral volume | Gender | Gender + Cerebral volume | ||
| * CAUDATE | Left | 3.39 (0.07) | 3.55 (0.06) | 3.33 (0.07) | 3.41 (0.06) | 3.62 (0.06) | 3.53 (0.04) | 3.56 (0.06) | 3.50 (0.05) |
| Right | 3.34 (0.07) | 3.50 (0.05) | 3.32 (0.07) | 3.40 (0.06) | 3.55 (0.06) | 3.46 (0.05) | 3.53 (0.06) | 3.46 (0.05) | |
| PUTAMEN | Left | 5.45 (0.10) | 5.65 (0.09) | 5.48 (0.10) | 5.58 (0.10) | 5.59 (0.08) | 5.47 (0.07) | 5.56 (0.08) | 5.47 (0.07) |
| Right | 5.38 (0.11) | 5.58 (0.11) | 5.41 (0.11) | 5.50 (0.11) | 5.52 (0.08) | 5.40 (0.07) | 5.44 (0.08) | 5.36 (0.07) | |
| GLOBUS PALLIDUS | Left | 1.71 (0.03) | 1.76 (0.03) | 1.74 (0.04) | 1.77 (0.04) | 1.77 (0.02) | 1.74 (0.02) | 1.74 (0.03) | 1.72 (0.02) |
| Right | 1.72 (0.04) | 1.77 (0.04) | 1.75 (0.05) | 1.77 (0.04) | 1.73 (0.02) | 1.70 (0.03) | 1.74 (0.03) | 1.73 (0.03) | |
| * CEREBRUM | Total | 916 (19.9) | n/a | 952 (15.6) | n/a | 1024 (14.3) | n/a | 1011 (14.4) | n/a |
Values are given in cm3, and are the least square means (standard errors) adjusted for the indicated effects. n/a = not applicable.
The caudate and cerebrum showed significant main effects across the four groups when adjusted for gender alone (see Volume Analyses results). For the caudate, post-hoc analyses showed significant differences between: 1) SCZ & CON [F(1,69)=4.7;p=0.03], 2) SCZ-SIB & CON [F(1,66)=6.0;p=0.02], 3) SCZ & CON-SIB [F(1,76)=6.2;p=0.02], and 4) SCZ-SIB & CON-SIB [F(1,64)=8.6;p=0.005].
For the cerebrum, post-hoc analyses showed significant differences between the same groups: 1) SCZ & CON [F(1,50)=15.1;p=0.0003], 2) SCZ-SIB & CON [F(1,57)=7.5;p=0.008], 3) SCZ & CON-SIB [F(1,54)=18.4;p<0.0001],and 4) SCZ-SIB & CON-SIB [F(1,56)=11.6;p=0.001]. SCZ vs. SCZ-SIB differences for the cerebrum almost reached significance [F(1,27)=4.2;p=0.051].
Mixed-model analysis indicated no main effect of group for the volume of the putamen (F[3,58]=0.4, p=0.75) or the globus pallidus (F[3,55]=0.3, p=0.86), even after covarying for cerebral volume (both p>0.4). There was a significant effect of hemisphere on putamen volume (left>right, F[1,58]=5.7,p=0.02), but no effect of group by hemisphere interaction (F[3,58]=0.2, p=0.89). For the globus pallidus, there was neither a significant effect of hemisphere on volume (F[1,64]=0.1,p=0.76) nor an effect of group by hemisphere interaction (F[3,58]=1.1, p=0.35).
SUBSTANCE AND ALCOHOL EFFECTS ON VOLUMES
When either (1) lifetime history of alcohol and cannabis dependence or (2) total grams of alcohol consumed over the previous two years were included as covariates in the mixed-model analysis (but not cerebral volume), the main effect of group on caudate volume remained significant (F[3,50]=3.2,p=0.03 and F[3,50]=3.9, p=0.01 respectively) None of the substance use variables themselves had a significant effect on the volume of any basal ganglia structure. However, there was a trend towards significance of the effect of cannabis dependence on globus pallidus volume (F[1,94]=3.7,p=0.06).
SHAPE ANALYSES
1. Caudate Shape
Using all four subject groups, MANOVA applied to the PC scores for the caudate (covarying for gender) showed a significant group effect on shape (λ=0.52, F[45,331]=1.8, p=0.002). Differences between groups based on the canonical shape score are shown in FIGURE 1A.
Figure 1. Canonical Shape Scores of basal ganglia structures.

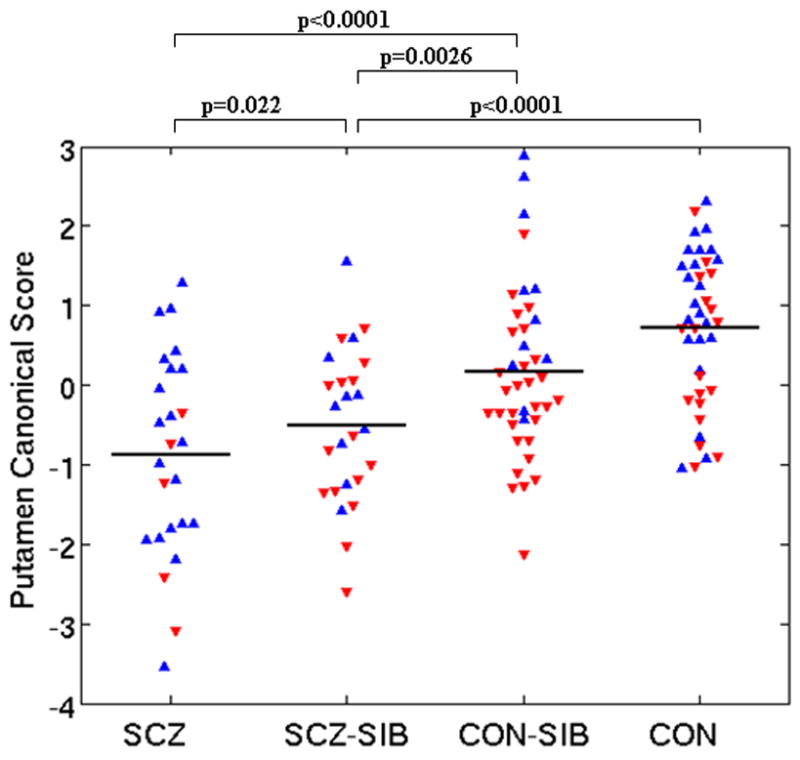
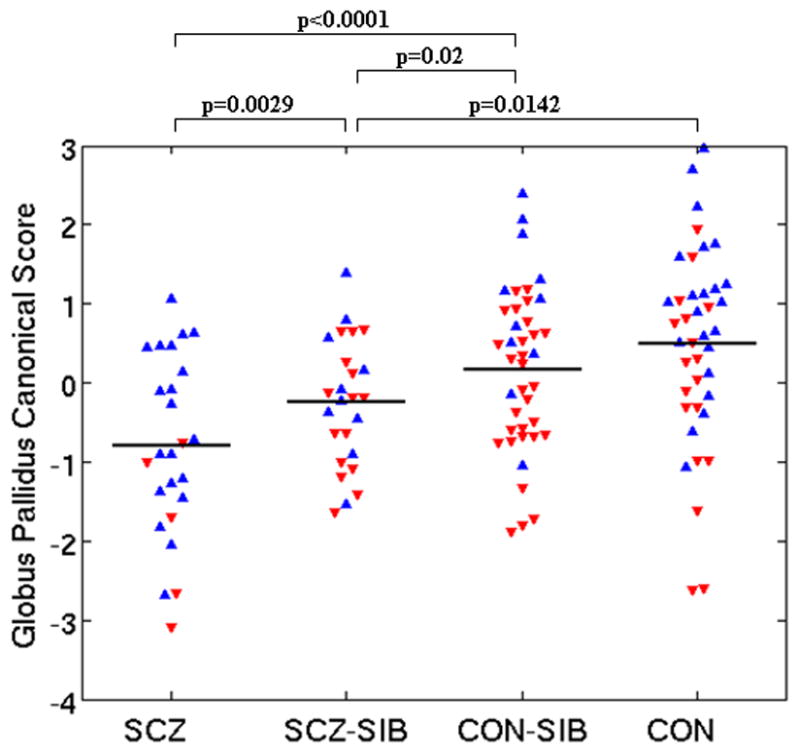
For each structure, canonical analysis was used to establish the linear combination of primary principal components (representing shape variation) which maximized the difference between SCZ and CON. The resulting weighting coefficients were then used to score all subjects. Graphs shown are: A) Caudate B) Putamen and C) Globus pallidus. Stated p values represent group differences between groups from a mixed model that included gender as a covariate. Horizontal lines are raw shape score means. Blue upward triangles=males. Red downward triangles=females.
A visual representation of caudate shape in SCZ and SCZ-SIB compared to CON is shown in FIGURE 2A. The most prominent shape patterns in the caudate of SCZ and SCZ-SIB were: 1) an inward deformation in a large region of the caudate head anteriorly and anterodorsally, and 2) an inward deformation along a large segment of the posterior side of the tail, with a reciprocal outward deformation on the anterior side of the tail. The noted shape abnormalities were observed bilaterally and more prominently in SCZ than SCZ-SIB.
Figure 2. Basal ganglia surface map abnormalities in schizophrenia subjects and their unaffected siblings.


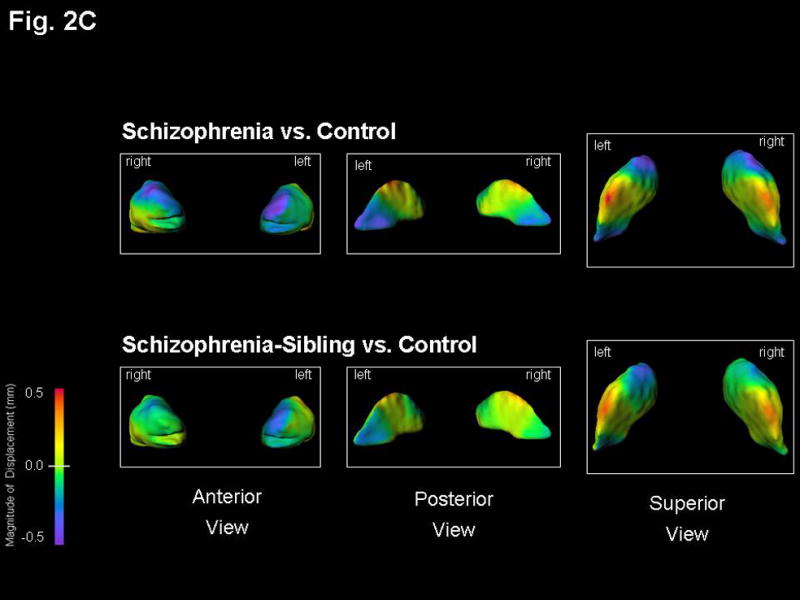
Structures shown are: A) Caudate B) Putamen, and C) Globus Pallidus. Figures represent mean estimated displacement between subject groups, controlling for gender. Surface displacement maps were obtained by first computing for every structure and subject the surface-normal component of the displacement of each surface point of that structure relative to the average surface of all 130 subjects. The least square mean of these displacements for each group (and surface point) was then computed, controlling for gender. Lastly, the difference of these least square means between the two selected subject groups was displayed as a color map (overlaid on the mean surface of the CON subjects).
Purple-to-blue shading denotes regions of inward deformation compared to CON. Red-to-orange shading denotes regions of outward deformation compared to CON. For the SCZ vs. CON maps in the caudate, the largest inward deformation was 0.8 mm bilaterally in its anterior, while for the SCZ-SIB vs. CON maps the inward deformation in this area was 0.6 mm bilaterally. For the SCZ vs. CON maps in the putamen, the inward deformation was 0.7 mm bilaterally in its anterior, while the largest inward deformation was 0.8 mm posteriorly on the left side only. All other maximum deformations were approximately 0.5 mm or smaller, and thus well captured by the indicated color scale. The lateral view of the putamen showed a very similar surface pattern on both left and right sides.
2. Putamen Shape
MANOVA applied to PC scores for the putamen showed a significant group effect on shape (λ=0.58, F[45,331]=1.5,p=0.03). FIGURE 1B shows significant canonical shape score differences.
A visual representation of the shape of the putamen in SCZ and SCZ-SIB compared to CON is shown in FIGURE 2B. The most prominent shape patterns in the putamen of SCZ and SCZ-SIB were: 1) an inward deformation in a moderate sized region in the anterior edge of the putamen, which extends more medially on the left in SCZ, and 2) inward deformation along the posterior edges of the putamen, more notable on the left. Shape abnormalities are more prominent in SCZ than SCZ-SIB.
3. Globus Pallidus Shape
MANOVA applied to PC scores for the globus pallidus showed a near-significant group effect on shape (λ=0.60, F[45,331]=1.4,p=0.06). FIGURE 1C shows significant canonical shape score differences.
A visual representation of the shape of the globus pallidus in SCZ and SCZ-SIB compared to CON is shown in FIGURE 2C. The most prominent shape patterns in the globus pallidus of SCZ and SCZ-SIB were: 1) an inward deformation in a moderate sized region dorsally on the right and antero-dorsally on the left in SCZ (in SCZ-SIB a smaller region was inwardly deformed anterior-dorsally on the left), and 2) a small inward deformation postero-medially in SCZ, not notable in SCZ-SIB.
SUBSTANCE AND ALCOHOL EFFECTS ON SHAPES
When comparing canonical shape scores between groups, the inclusion of either: 1) a lifetime history of alcohol and cannabis dependence or 2) total grams of alcohol consumed over the previous two years as additional covariates did not alter the results (TABLE 3). Further, none of these three covariates had a significant relationship with the canonical shape scores of any of the basal ganglia structures.
TABLE 3.
Statistical significance of basal ganglia shape score differences between groups.
| Subject Groups Compared | Structure | Covariates included in mixed model analysis | ||
|---|---|---|---|---|
| Gender | Gender + History of Alcohol & Cannabis Dep. | Gender + 2 yr Amount of Alcohol | ||
| SCZ v SCZ-SIB | Caudate | 0.0009 | 0.0017 | 0.0006 |
| Putamen | 0.022 | 0.023 | 0.02 | |
| Globus Pallidus | 0.0029 | 0.0031 | 0.0029 | |
| SCZ v CON-SIB | Caudate | <0.0001 | <0.0001 | <0.0001 |
| Putamen | <0.0001 | <0.0001 | <0.0001 | |
| Globus Pallidus | <0.0001 | <0.0001 | <0.0001 | |
| SCZ-SIB v CON | Caudate | 0.0196 | 0.032 | 0.034 |
| Putamen | <0.0001 | <0.0001 | <0.0001 | |
| Globus Pallidus | 0.0142 | 0.012 | 0.017 | |
| SCZ-SIB v CON-SIB | Caudate | ns | Ns | ns |
| Putamen | 0.0026 | 0.0023 | 0.0036 | |
| Globus Pallidus | 0.02 | 0.016 | 0.025 | |
| CON v CON-SIB | Caudate | ns | Ns | ns |
| Putamen | ns | Ns | ns | |
| Globus Pallidus | ns | Ns | ns | |
Values are p values generated by comparing univariate canonical shape scores, and including as covariates: gender or gender and either 1) lifetime history of alcohol and cannabis dependence, or 2) two-year cumulative amount of alcohol consumed. Shape scores were derived from canonical analysis of shape principal components in SCZ and CON. Notably, the multivariate (MANOVA) contrast between the SCZ and CON groups was significant in all three basal ganglia structures (caudate: F[15,111]=2.5, p=0.003; putamen: F[15,111]=2.0, p=0.02; globus pallidus: F[15,111]=2.8, p=0.001), thus providing a basis for the canonical analysis comparing canonical scores of the SCZ-SIB and CON-SIB to the other groups. This analysis strategy maximized the power to detect differences between groups (as defined by the SCZ vs. CON difference). ns=not statistically significant (p>0.05).
SHAPE AND VOLUME RELATIONSHIPS TO CLINICAL SYMPTOMS
Using lifetime psychopathology measures derived from the SCID, significant correlations were observed in SCZ subjects between the severity of hallucinations and the volume of the caudate (Spearman’s r=−0.62,p=0.001) and globus pallidus (r=−0.39,p=0.05); a trend towards significance was also found for the putamen (r=−0.38,p=0.059). After covarying for cerebral volume, the correlation between lifetime hallucination severity and caudate volume was still nearly significant (r=−0.40,p=0.054). There was also a near-significant correlation between the lifetime severity of negative symptoms and putamen volume (r=0.39, p=0.054), which became significant after covarying for cerebral volume (r=0.45,p=0.03). Finally, there was a significant relationship between hallucination severity and caudate shape scores (r=−0.49,p=0.01). Similar analyses done in SCZ-SIB (who had little variability in their lifetime psychopathology scores) did not show any significant relationships.
Using current psychopathology measures obtained from standardized tests in SCZ, a significant correlation was observed between the severity of thought disorganization and the caudate shape score (r=−0.39,p=0.05). No other significant relationships between basal ganglia shape measures or volumes and the severity of current psychopathology were found in SCZ or SCZ-SIB subjects. There was also no significant relationship between the duration of illness of SCZ and either the canonical shape score or volume of any basal ganglia structure.
DISCUSSION
In this study, we did not find significant differences in basal ganglia volumes across the four subject groups after controlling for cerebral volume. However when caudate volumes were not adjusted for cerebral volume, they were smaller in SCZ and SCZ-SIB than control subjects. Our failure to find a relative increase in basal ganglia volume measures in SCZ differs from the results of other studies. This may be due to the fact that few of our SCZ were currently receiving typical antipsychotic drugs, which has been linked to such increases in other studies (52,53). In turn, and more consistent with our results, the use of atypical antipsychotic drugs have not usually been associated with alterations in basal ganglia size(54,55).
Despite the absence of volume differences between groups, we found significant shape abnormalities of every basal ganglia structure in SCZ. We also found that the unaffected siblings of these subjects demonstrate deformities in the shape of the basal ganglia in regions similar to those found in their affected siblings, but lesser in magnitude. The most notable shape found in SCZ and SCZ-SIB was an inward deformity on the anterior surface of the caudate and putamen. This pattern of structural change may have functional consequences because of topographic projections from these anterior basal ganglia regions to areas of the prefrontal, orbitofrontal and limbic cortices (56–58). Several other regional abnormalities were also observed in the basal ganglia of both SCZ and SCZ-SIB. Structural deficits noted in posterior-medial regions of the globus pallidus or the posterior edge of the putamen, for example, could be involved in neurologic “soft signs” sometimes observed in schizophrenia patients and their unaffected relatives (5,6), due to the roles of these regions in motor coordination (59).
Our findings of similar basal ganglia structural abnormalities in SCZ-SIB may indicate that such changes are related to genetic influences that predispose individuals to develop schizophrenia (60). However, these structural changes could also be traits that co-segregate with the disorder in families, but are not directly relevant to the psychopathology of schizophrenia. Although not directly addressed by our data, basal ganglia abnormalities may have some relationship to premorbid behavioral symptoms or cognitive deficits that have been found in the relatives of patients with schizophrenia (61,62).
Structural deficits of the caudate and putamen in SCZ from our current study are highly similar, but appear more pronounced than those observed in our prior study of a non-overlapping group of subjects with schizophrenia (36). The subjects in our prior study were older and had a longer duration of illness, and therefore were probably exposed to larger cumulative amounts of typical antipsychotics than subjects in our current study. The effect of typical antipsychotics, which are known to increase basal ganglia size (63,64), could have minimized a potentially greater basal ganglia structural deficit. As mentioned above, the large majority of SCZ subjects in this study were receiving atypical antipsychotic drugs.
The abnormalities in basal ganglia shape observed may not necessarily imply volume changes in exact proximity to the areas of surface change. Abnormalities could lie deeper within the basal ganglia, which could be clarified by post-mortem neuropathologic studies. Such studies would provide insights into the microscopic nature of surface shape abnormalities; for example, whether they represent changes in parenchymal volume (i.e. neuropil and/or somal) or physiologic compensations (e.g. dendritic, vascular or osmotic) to altered activity (65). Post-mortem studies in schizophrenia have previously demonstrated reductions in neuropil volume in the cerebral cortex and the hippocampus with a corresponding increase in neuronal density (66).
The canonical shape scores of SCZ-SIB were intermediate between those of SCZ and CON in all three of the basal ganglia structures, indicating that SCZ-SIB have attenuated forms of the structural abnormalities observed in SCZ. Statistically significant differences in canonical scores were not observed between CON and CON-SIB subjects for any of the three structures. This is of particular interest, as CON and CON-SIB had different recruitment criteria, the latter group being allowed to have a history of major mood disorder (i.e. major depression or bipolar disorder). This suggests that the presence of major mood disorders has little association with schizophrenia-like basal ganglia structural abnormalities.
We found an inverse relationship between the lifetime severity of hallucinations and caudate volume in SCZ subjects. A similar inverse relationship was also observed between a “schizophrenia-like” caudate canonical shape score and hallucination severity, as well as a similar, but less significant, correlation between hallucination severity and the volume of both the globus pallidus and putamen. Thus, abnormalities of basal ganglia structure, perhaps especially of the caudate, may be associated with impaired sensory perception and manifested as hallucinations. We also found a near significant relationship between the lifetime severity of negative symptoms and putamen volume, which could suggest unique role for this structure in alogia, avolition or affective blunting. Notably, prominent correlations were not found between the neuroanatomical measures and current severity of psychopathology, except for a relationship between a schizophrenia-like caudate shape and thought disorganization. Because psychosis severity often fluctuates within a short period, it may be difficult to correlate the current severity of such pathology with neuroanatomical measures (68,66). Rather, structural changes may be more closely related to lifetime measures of psychopathology severity.
Both schizophrenia patients and their unaffected siblings have been reported to have increased substance use compared to the general population (68,69). It is therefore plausible that some of the structural abnormalities observed in this study might have been influenced by substance use. However, after volume and shape results were controlled for lifetime substance dependence and the amount of alcohol used, there were no significant changes from our original findings, and these covariates themselves were not significant predictors of either volume or canonical scores. We were not able to evaluate the effects of milder degrees of substance use (i.e., those not meeting criteria for DSM-IV substance dependence) or the cumulative amounts of other drugs, which could potentially influence our results. Future studies designed to study specific associations between various degrees of substance use and brain structure are critical for validating structural findings in psychiatric disorders, due to their high comorbidity with drug use (70).
Additional studies could provide insight into the role of specific genotypes in the development of basal ganglia structural findings in schizophrenia. For example, a coding polymorphism (rs6280/Ser9Gly) has been reported at the gene for the dopamine D3 receptor (71) which is highly expressed specifically in limbic regions of the basal ganglia (72–74). However, little is known about the associations between such polymorphisms and structural abnormalities in schizophrenia. Valine substituted polymorphisms at the gene for catechol-O-methyltransferase (COMT), which degrades extracellular dopamine, have been related to smaller anterior cingulate gray matter in high-risk relatives of schizophrenia subjects (75). Distinct patterns of shape abnormality may serve as potential endophenotypes by fulfilling at least some criteria proposed by Gottesman & Gould, 2003 (60). In the case of the measures studied here, the structural abnormalities were similarly present in affected and unaffected family members. Furthermore, there did not appear to be a strong relationship with “current” illness severity, suggesting “state-independence”. However, the specificity of the noted neuroanatomical findings to schizophrenia, observed in this and our previous study (36), requires further study.
Structural studies of the basal ganglia in various diagnostic populations could help better understand the relationship between structure and clinical symptoms. We hope to follow the unaffected siblings of schizophrenia subjects included in this study prospectively to determine whether the structural differences observed predict the future appearance of schizophrenia psychopathology.
Supplementary Material
Acknowledgments
This research was funded by federal NIH grants P50 MH071616 (Conte Center for the Neuroscience of Mental Disorders), R01 MH056584 and T32 MH17104. All authors report no competing interests between financial supports and the interests of this manuscript. Dr. Csernansky has served as a consultant for Eli Lilly and Co., Sanofi-Aventis, Solvay and Wyeth Pharmaceuticals. He has also received honoraria for lectures from Eli Lilly. The authors thank the staff of the Conte Center for the Neuroscience of Mental Disorders at Washington University St. Louis and the Epidemiology and Prevention Research Group at Washington University St. Louis for their assistance in the project.
Footnotes
Publisher's Disclaimer: This is a PDF file of an unedited manuscript that has been accepted for publication. As a service to our customers we are providing this early version of the manuscript. The manuscript will undergo copyediting, typesetting, and review of the resulting proof before it is published in its final citable form. Please note that during the production process errors may be discovered which could affect the content, and all legal disclaimers that apply to the journal pertain.
References
- 1.Cardno AG, Marshall EJ, Coid B, Gottesmann II, Farmer AE, McGuffin P, Reveley AM, Murray RM. Heritability estimates for psychotic disorders. Arch Gen Psychiatry. 1999;56:162–168. doi: 10.1001/archpsyc.56.2.162. [DOI] [PubMed] [Google Scholar]
- 2.McGuffin P, Owens MJ, Gottesman II. Psychiatric genetics and genomics. Oxford University Press; New York: 2002. [Google Scholar]
- 3.Thaker GK, Ross DE, Cassady SL, Adami HM, Medoff DR, Sherr J. Saccadic eye movement abnormalities in relatives of patients with schizophrenia. Schizophr Res. 2000 Oct 27;45(3):235–44. doi: 10.1016/s0920-9964(99)00193-0. [DOI] [PubMed] [Google Scholar]
- 4.Krabbedam L, Marcelis M, Delespaul P, Jolles J, van Os J. Single or multiple familial cognitive risk factors in schizophrenia? Am J Med Genet. 2001;105:183–188. doi: 10.1002/ajmg.1197. [DOI] [PubMed] [Google Scholar]
- 5.Woods BT, Kinney DK, Yergelun-Todd D. Neurologic abnormalities in schizophrenic patients and their families. Arch Gen Psychiatry. 1986;43:657–663. doi: 10.1001/archpsyc.1986.01800070043006. [DOI] [PubMed] [Google Scholar]
- 6.Yazici AH, Demir B, Yazici KM, Gogus A. Neurological soft signs in schizophrenic patients and their nonpsychotic siblings. Schizophrenia Res. 2002;58:241–246. doi: 10.1016/s0920-9964(01)00338-3. [DOI] [PubMed] [Google Scholar]
- 7.Winterer G, Egan MF, Raedler T, Sanchez C, Jones DW, Coppola R, Weinberger DR. P300 and genetic risk for schizophrenia. Arch Gen Psychiatry. 2003 Nov;60(11):1158–67. doi: 10.1001/archpsyc.60.11.1158. [DOI] [PubMed] [Google Scholar]
- 8.Karoumi B, Saoud M, d’Amato T, Rosenfeld F, Denise P, Gutknecht C, Gaveau v, Beaulieu FE, Dalery J, Rochet T. Poor performance in smooth pursuit and antisaccadic eye-movement tasks in healthy siblings of patients with schizophrenia. Psychiatry Res. 2001 Apr 15;101(3):209–19. doi: 10.1016/s0165-1781(01)00227-x. [DOI] [PubMed] [Google Scholar]
- 9.Afifi AK. The basal ganglia: a neural network with more than motor function. Semin Pediatr Neurol. 2003 Mar;10(1):3–10. doi: 10.1016/s1071-9091(02)00003-7. [DOI] [PubMed] [Google Scholar]
- 10.Levy R, Friedman HR, Davachi L, Goldman Rakic PS. Differential activation of the caudate nucleus in primates performing spatial and nonspatial working Memory tasks. J Neurosci. 1997;17:3870–3882. doi: 10.1523/JNEUROSCI.17-10-03870.1997. [DOI] [PMC free article] [PubMed] [Google Scholar]
- 11.Mendez MF, Adams NL, Lewandowski KS. Neurobehavioral changes associated with caudate lesions. Neurology. 1989;39(3):349–354. doi: 10.1212/wnl.39.3.349. [DOI] [PubMed] [Google Scholar]
- 12.Gupta S, Andreasen NC, Arndt S, et al. Neurological soft signs in neuroleptic-naïve and neuroleptic treated schizophrenic patients and in normal comparison subjects. Am J Psychiatry. 1995;152:191–196. doi: 10.1176/ajp.152.2.191. [DOI] [PubMed] [Google Scholar]
- 13.Brahmbhatt SN, Haut K, Csernansky JG, Barch DM. Neural correlates of verbal and nonverbal working memory deficits in individuals with schizophrenia and their high-risk siblings. Schizophr Res. 2006;87:191–204. doi: 10.1016/j.schres.2006.05.019. [DOI] [PubMed] [Google Scholar]
- 14.Raemaekers M, Ramsey NF, Vink M, van den Heuvel MP, Kahn RS. Brain activation during antisaccades in unaffected relatives of schizophrenic patients. Biol Psychiatry. 2006;59:530–535. doi: 10.1016/j.biopsych.2005.07.030. [DOI] [PubMed] [Google Scholar]
- 15.Vink M, Ramsey NF, Raemaekers M, Kahn RS. Striatal dysfunction in schizophrenia and unaffected relatives. Biol Psychiatry. 2006;60:32–39. doi: 10.1016/j.biopsych.2005.11.026. [DOI] [PubMed] [Google Scholar]
- 16.Krauzlis RJ. Recasting the smooth pursuit eye movement system. J Neurophysiol. 2004;91:591–603. doi: 10.1152/jn.00801.2003. [DOI] [PubMed] [Google Scholar]
- 17.Cui DM, Yan YJ, Lynch JC. Pursuit subregion of the frontal eye field projects to the caudate nucleus in monkeys. J Neurophysiol. 2003;89:2678–2684. doi: 10.1152/jn.00501.2002. [DOI] [PubMed] [Google Scholar]
- 18.Calkins ME, Iacono WG. Eye movement dysfunction in schizophrenia: a heritable characteristic for enhancing phenotype definition. Am J Med Genet. 2000 Spring;97(1):72–6. doi: 10.1002/(sici)1096-8628(200021)97:1<72::aid-ajmg10>3.0.co;2-l. [DOI] [PubMed] [Google Scholar]
- 19.Abel LA, Levin S, Holzman PS. Abnormalities of smooth pursuit and saccadic control in schizophrenia and affective disorders. Vision Res. 1992 Jun;32(6):1009–14. doi: 10.1016/0042-6989(92)90002-z. [DOI] [PubMed] [Google Scholar]
- 20.Hokama H, Shenton ME, Nestor PG, Kikinis R, Levit JJ, Metalf D, Wible CG, O’Donnelll BF, Jolesz FA, McCarley JW. Caudate, putamen, and globus pallidus volume in schizophrenia: a quantitative MRI study. Psychiatric Res. 1995;61:209–229. doi: 10.1016/0925-4927(95)02729-h. [DOI] [PubMed] [Google Scholar]
- 21.Staal WG, Hulshoff Pol HE, Schnack HG, Hoogendoorn ML, Jellema K, Kahn RS. Structural brain abnormalities in patients with schizophrenia and their healthy siblings. Am J Psychiatry. 2000 Mar;157(3):416–21. doi: 10.1176/appi.ajp.157.3.416. [DOI] [PubMed] [Google Scholar]
- 22.Chakos MH, Liberman JA, Bilder RM, Borenstein M, Lerner G, Bogerts B, Wu H, Kinon B, Ashtari M. Increase in caudate nuclei volumes of first-episode schizophrenic patients taking antipsychotic drugs. Am J Psychiatry. 1994;151:1430–1436. doi: 10.1176/ajp.151.10.1430. [DOI] [PubMed] [Google Scholar]
- 23.Hall H, Sedvall G, Magnusson O, Kopp J, Halldin C, Fardel L. Distribution of D1- and D2-dopamine receptors, and dopamine and its metabolites in the human brain. Neuropsychopharmacology. 1994;11:245–256. doi: 10.1038/sj.npp.1380111. [DOI] [PubMed] [Google Scholar]
- 24.Khan ZU, Gutierrez A, Martin R, Penafiel A, Rivera A, De La Calle A. Differential regional and cellular distribution of dopamine D2-like receptors: an immunocytochemical study of subtype-specific antibodies in rat and human brain. J Comp Neurol. 1998 Dec 21;402(3):353–71. doi: 10.1002/(sici)1096-9861(19981221)402:3<353::aid-cne5>3.0.co;2-4. [DOI] [PubMed] [Google Scholar]
- 25.Baare WF, van Oel CJ, Hulshoff Pol HE, Schnack HG, Durston S, Sitskoorn MM, Kahn RS. Volumes of brain structures in twins discordant for schizophrenia. Arch Gen Psychiatry. 2001;58:33–40. doi: 10.1001/archpsyc.58.1.33. [DOI] [PubMed] [Google Scholar]
- 26.Boos HB, Aleman A, Cahn W, Pol HH, Kahn RS. Brain volumes in relatives of patients with schizophrenia: a meta-analysis. Arch Gen Psychiatry. 2007;64:297–304. doi: 10.1001/archpsyc.64.3.297. [DOI] [PubMed] [Google Scholar]
- 27.Steel RM, Whalley HC, Miller P, Best JJ, Johnstone EC, Lawrie SM. Structural MRI of the brain in presumed carriers of genes for schizophrenia, their affected and unaffected siblings. J Neurol Neurosurg Psychiatry. 2002;72:455–458. doi: 10.1136/jnnp.72.4.455. [DOI] [PMC free article] [PubMed] [Google Scholar]
- 28.Seidman LJ, Faraone SV, Goldstein JM, Goodman JM, Kremen WS, Matsuda G, Hoga EA, Kennedy D, Makris N, Caviness VS, Tsuang MT. Reduced subcortical brain volumes in nonpsychotic siblings of schizophrenic patients: a pilot magnetic resonance imaging study. American Journal of Med Genetics. 1997;74:507–514. doi: 10.1002/(sici)1096-8628(19970919)74:5<507::aid-ajmg11>3.0.co;2-g. [DOI] [PubMed] [Google Scholar]
- 29.Lawrie SM, Whalley HC, Abukmell SS, Kesterlman JN, Donnelly L, Miller P, Best JJ, Owens DG, Johnstone EC. Brain structure, genetic liability, and psychotic symptoms in subjects at high risk of developing schizophrenia. Biol Psychiatry. 2001 May 15;49(10):811–23. doi: 10.1016/s0006-3223(00)01117-3. [DOI] [PubMed] [Google Scholar]
- 30.Haller JW, Banerjee A, Christensen GE, Gado M, Joshi S, Miller MI, Sheline YI, Vannier MW, Vannier MW, Csernansky JG. Three-dimensional hippocampal MR morphometry by high-dimensional transformation of a neuroanatomic atlas. Radiology. 1997;202:504–510. doi: 10.1148/radiology.202.2.9015081. [DOI] [PubMed] [Google Scholar]
- 31.Wang L, Joshi SC, Miller MI, Grenander U, Csernansky JG. Statistical analysis of hippocampal asymmetry. Neuroimage. 2001;14:531–545. doi: 10.1006/nimg.2001.0830. [DOI] [PubMed] [Google Scholar]
- 32.Tepest R, Wang L, Miller MI, Falkai P, Csernansky JG. Hippocampal deformities in the unaffected siblings of schizophrenia subjects. Biol Psychiatry. 2003;54:1234–1240. doi: 10.1016/s0006-3223(03)00702-9. [DOI] [PubMed] [Google Scholar]
- 33.Harms MP, Wang L, Mamah D, Barch DM, Thompson PA, Csernansky JG. Thalamic shape abnormalities in individuals with schizophrenia and their non-psychotic siblings. J Neurosci. 2007 Dec 12;27(50):13835–42. doi: 10.1523/JNEUROSCI.2571-07.2007. [DOI] [PMC free article] [PubMed] [Google Scholar]
- 34.Csernansky JG, Schindler MK, Splinter NR, Wang L, Gado M, Selemon LD, Rastogi-Cruz D, Posener JA, Thompson PA, Miller MI. Abnormalities of thalamic volume and shape in schizophrenia. Am J Psychiatry. 2004;161:896–902. doi: 10.1176/appi.ajp.161.5.896. [DOI] [PubMed] [Google Scholar]
- 35.Posener JA, Wang L, Price JL, Gado MH, Province MA, Miller MI, Babb CM, Csernansky JG. High-dimensional mapping of the hippocampus in depression. Am J Psychiatry. 2003 Jan;160(1):83–9. doi: 10.1176/appi.ajp.160.1.83. [DOI] [PubMed] [Google Scholar]
- 36.Mamah D, Wang L, Barch D, de Erausquin GA, Gado M, Csernansky JG. Structural analysis of the basal ganglia in schizophrenia. Schizophr Res. 2007 Jan;89(1–3):59–71. doi: 10.1016/j.schres.2006.08.031. [DOI] [PMC free article] [PubMed] [Google Scholar]
- 37.Siever LJ, Davis KL. The pathophysiology of schizophrenia disorders: perspectives from the spectrum. Am J Psychiatry. 2004 Mar;161(3):398–413. doi: 10.1176/appi.ajp.161.3.398. [DOI] [PubMed] [Google Scholar]
- 38.Jacobsen LK, Giedd JN, Gottschalk C, Kosten TR, Krystal JH. Quantitative morphology of the caudate and putamen in patients with cocaine dependence. Am J Psychiatry. 2001 Mar;158(3):486–9. doi: 10.1176/appi.ajp.158.3.486. [DOI] [PubMed] [Google Scholar]
- 39.O’Neill J, Cardenas VA, Meyerhoff DJ. Separate and interactive effects of cocaine and alcohol dependence on brain structures and metabolites: quantitative MRI and proton MR spectroscopic imaging. Addict Biol. 2001 Sep;6(4):347–361. doi: 10.1080/13556210020077073. [DOI] [PubMed] [Google Scholar]
- 40.First MB, Spitzer RL, Gibbon M, Williams JBW. Structured Clinical Interview for DSM-IV Axis I Disorders, Patient Edition (SCID-P), version 2. New York: New York State Psychiatric Institute, Biometrics Research; 1995. [Google Scholar]
- 41.Skinner HA. Development and validation of a lifetime alcohol consumption assessment procedure. Toronto, Canada: Addiction Research Foundation; 1982. [Google Scholar]
- 42.Andreasen NC, Olsen S. Negative v positive schizophrenia. Arch Gen Psychiatry. 1982;39:789–94. doi: 10.1001/archpsyc.1982.04290070025006. [DOI] [PubMed] [Google Scholar]
- 43.McGlashan TH, Miller TJ, Woods SW, Rosen JL, Hoffman RE, Davidson L. Structured Interview for Prodromal Syndromes (SIPS) New Haven, Conn: Yale School of Medicine; 2000. [Google Scholar]
- 44.Chapman JP, Chapman LJ, Kwapil TR. Scales for the measurement of schizotypy. In: Raine T, Lencz T, Mednick S, editors. Schizotypal Personality. New York. NY: Cambridge University Press; 1995. pp. 79–106. [Google Scholar]
- 45.Delawalla Z, Barch DM, Fisher Eastep JL, Thomason ES, Hanewinkel MJ, Thompson PA, Csernansky JG. Factors mediating cognitive deficits and psychopathology among siblings of individuals with schizophrenia. Schizophr Bull. 2006 Jul;32(3):525–37. doi: 10.1093/schbul/sbj082. [DOI] [PMC free article] [PubMed] [Google Scholar]
- 46.Wang L, Lee DY, Bailey E, Hartlein JM, Gado MH, Miller MI, Black KJ. Validity of large-deformation high dimensional brain mapping of the basal ganglia in adults with Tourette syndrome. Psychiatry Res. 2007 Feb 28;154(2):181–90. doi: 10.1016/j.pscychresns.2006.08.006. [DOI] [PMC free article] [PubMed] [Google Scholar]
- 47.Mai JK, Assheuer J, Paxinos G. Atlas of the Human Brain. Academic Press; San Diego: 1997. [Google Scholar]
- 48.Miller M, Banerjee A, Christensen G, Joshi S, Khaneja N, Grenander U, Matejic L. Statistical methods in computational anatomy. Stat Methods Med Res. 1997 Sep;6(3):267–99. doi: 10.1177/096228029700600305. [DOI] [PubMed] [Google Scholar]
- 49.Dale AM, Fischl B, Sereno MI. Cortical surface-based analysis. I. Segmentation and surface reconstruction. Neuroimage. 1999 Feb;9(2):179–94. doi: 10.1006/nimg.1998.0395. [DOI] [PubMed] [Google Scholar]
- 50.Joshi SC, Miller MI, Grennder U. On the geometry and shape of brain sub-manifolds. Int J Pattern Recogn Artif Intell. 1997;11:1317–1343. [Google Scholar]
- 51.Jacqmin-Gadda H, Sibillot S, Proust C, Molina J, Thiebaut R. Computational Statistics and Data Analysis. 2007 June;51(10):5142–5154. [Google Scholar]
- 52.McCarley RW, Wible CG, Frumin M, Hirayasu Y, Levitt JJ, Fischer IA, Shenton ME. MRI anatomy of schizophrenia. Biol psychiatry. 1999 May 1;45(9):1099–119. doi: 10.1016/s0006-3223(99)00018-9. [DOI] [PMC free article] [PubMed] [Google Scholar]
- 53.Hokama H, Shenton ME, Nestor PG, Kikinis R, Levitt JJ, Metcalf D, Wible CG, O’Donnell BF, Jolesz FA, McCarley RW. Caudate, putamen and globus pallidus volume in schizophrenia: a quantitative MRI study. Psychiatry Res. 1995 Nov 10;61(4):209–29. doi: 10.1016/0925-4927(95)02729-h. [DOI] [PubMed] [Google Scholar]
- 54.Lang DJ, Kopala LC, Vandorpe RA, Rui Q, Smith GN, Goghari VM, Lapointe JS, Honer WG. Reduced basal ganglia volumes after switching to olanzapine in chronically treated patients with schizophrenia. Am J Psychiatry. 2004 Oct;161(10):1829–36. doi: 10.1176/ajp.161.10.1829. [DOI] [PubMed] [Google Scholar]
- 55.Corson PW, Nopoulos P, Miller DD, Arndt S, Andreasen NC. Change in basal ganglia volume over 2 years in patients with schizophrenia: typical versus atypical neuroleptics. Am J Psychiatry. 1999 Aug;156(8):1200–4. doi: 10.1176/ajp.156.8.1200. [DOI] [PubMed] [Google Scholar]
- 56.Lehericy S, Ducros M, Van de Moortele PF, Francois C, Thivard L, Poupon C, Swindale N, Ugurbil K, Kim DS. Diffusion tensor fiber tracking shows distinct corticostriatal circuits in humans. Ann Neurol. 2004 Apr;55(4):522–9. doi: 10.1002/ana.20030. [DOI] [PubMed] [Google Scholar]
- 57.Parent A, Hazrati LN. Functional anatomy of the basal ganglia: I. The cortico-basal ganglia-thalamo-cortical loop. Brain Res Brain Res Rev. 1995;20:91–127. doi: 10.1016/0165-0173(94)00007-c. [DOI] [PubMed] [Google Scholar]
- 58.Pantelis C, Barnes TR, Nelson HE, Tanner S, Weatherley L, Owewn AM, et al. Frontal-striatal cognitive deficits in patients with chronic schizophrenia. Brain. 1997;120( Pt10):1823–1843. doi: 10.1093/brain/120.10.1823. [DOI] [PubMed] [Google Scholar]
- 59.DeLong MR. The Basal Ganglia. In: Kandel ER, Schwartz JH, Jessell TM, editors. Principles of Neural Science. McGraw Hill; 2000. pp. 853–867. [Google Scholar]
- 60.Gottesmann II, Gould TD. The endophenotype concept in psychiatry: etymology and strategic intentions. American Journal of Psychiatry. 2003;160:636–45. doi: 10.1176/appi.ajp.160.4.636. [DOI] [PubMed] [Google Scholar]
- 61.Schurhoff F, Szoke A, Meary A, Bellivier F, Rouillon F, Pauls D, Leboyer M. Familial aggregation of delusional proneness in schizophrenia and bipolar pedigrees. Am J Psychiatry. 2003 Jul;160(7):1313–9. doi: 10.1176/appi.ajp.160.7.1313. [DOI] [PubMed] [Google Scholar]
- 62.Cannon TD, Bearden CE, Hollister JM, Rosso IM, Sanchez LE, Hadley T. Childhood cognitive functioning in schizophrenia patients and their unaffected siblings: a prospective cohort study. Schizophr Bull. 2000;26(2):379–93. doi: 10.1093/oxfordjournals.schbul.a033460. [DOI] [PubMed] [Google Scholar]
- 63.Andersson C, Hamer RM, Lawler CP, Mailman RB, Lieberman JA. Striatal volume changes in the rat following long-term administration of typical and atypical antipsychotic drugs. Neuropsychopharmacology. 2002 Aug;27(2):143–51. doi: 10.1016/S0893-133X(02)00287-7. [DOI] [PubMed] [Google Scholar]
- 64.Gur RE, Maany V, Mozley PD, Swanson C, Bilker W, Gur RC. Subcortical MRI volumes in neuroleptic-naive and treated patients with schizophrenia. Am J Psychiatry. 1998 Dec;155(12):1711–7. doi: 10.1176/ajp.155.12.1711. [DOI] [PubMed] [Google Scholar]
- 65.Keshavan MS. Development, disease and degeneration in schizophrenia: a unitary pathophysiological model. J Psychiatr Res. 1999 Nov-Dec;33(6):513–21. doi: 10.1016/s0022-3956(99)00033-3. [DOI] [PubMed] [Google Scholar]
- 66.Harrison PJ. The neuropathology of schizophrenia. A critical review of the data and their interpretation. Brain. 1999;122:593–624. doi: 10.1093/brain/122.4.593. [DOI] [PubMed] [Google Scholar]
- 67.Christensen J, Holcomb J, Garver DL. State-related changes in cerebral white matter may underlie psychosis exacerbation. Psychiatry Res. 2004 Jan 15;130(1):71–8. doi: 10.1016/j.pscychresns.2003.08.002. [DOI] [PubMed] [Google Scholar]
- 68.Margolese HC, Malchy L, Negrete JC, Tempier R, Gill K. Drug and alcohol use among patients with schizophrenia and related psychoses: levels and consequences. Schizophr Res. 2004 Apr 1;67(2–3):157–66. doi: 10.1016/S0920-9964(02)00523-6. [DOI] [PubMed] [Google Scholar]
- 69.Varma SL, Sharma I. Psychiatric morbidity in the first-degree relatives of schizophrenic patients. Br J Psychiatry. 1993 May;162:672–8. doi: 10.1192/bjp.162.5.672. [DOI] [PubMed] [Google Scholar]
- 70.Leweke FM, Gerth CW, Klosterkotter J. Cannabis-associated psychosis: current status of research. CNS Drugs. 2004;18(13):895–910. doi: 10.2165/00023210-200418130-00005. [DOI] [PubMed] [Google Scholar]
- 71.Talkowski ME, Mansour H, Chowdari KV, Wood J, Butler A, Varma PG, Prasad S, Semwal P, Bhatia T, Deshpande S, Devlin B, Thelma BK, Nimgaonkar VL. Novel, replicated associations between dopamine D3 receptor gene polymorphisms and schizophrenia in two independent samples. Biol Psychiatry. 2006 Sep 15;60(6):570–7. doi: 10.1016/j.biopsych.2006.04.012. [DOI] [PubMed] [Google Scholar]
- 72.Joyce JN, Gurevich EV. D3 receptors and the actions of neuroleptics in the ventral striatopallidal system of schizophrenics. Ann N Y Acad Sci. 1999 Jun 29;877:595–613. doi: 10.1111/j.1749-6632.1999.tb09291.x. [DOI] [PubMed] [Google Scholar]
- 73.Morissette M, Goulet M, Grondin R, Blanchet P, Bedard PJ, Di Paolo T, Levesque D. Associative and limbic regions of monkey striatum express high levels of dopamine D3 receptors: effects of MPTP and dopamine agonist replacement therapies. Eur J Neurosci. 1998 Aug;10(8):2565–73. doi: 10.1046/j.1460-9568.1998.00264.x. [DOI] [PubMed] [Google Scholar]
- 74.Piggott MA, Marshall EF, Thomas N, Lloyd S, Court JA, Jaros E, Costa D, Perry RH, Perry EK. Dopaminergic activities in the human striatum: rostrocaudal gradients of uptake sites and of D1 and D2 but not of D3 receptor binding or dopamine. Neuroscience. 1999 May;90(2):433–45. doi: 10.1016/s0306-4522(98)00465-5. [DOI] [PubMed] [Google Scholar]
- 75.McIntosh AM, Baig BJ, Hall J, Job D, Whalley HC, Lymer GK, Moorhead TW, Owens DG, Miller P, Porteous D, Lawrie SM, Johnstone EC. Relationship of catechol-O-methyltransferase variants to brain structure and function in a population at high risk of psychosis. Biol Psychiatry. 2007 May 15;61(10):1127–34. doi: 10.1016/j.biopsych.2006.05.020. [DOI] [PubMed] [Google Scholar]
Associated Data
This section collects any data citations, data availability statements, or supplementary materials included in this article.