

Abstract
LIM-homeodomain (LIM-HD) transcription factors form a combinatorial ‘LIM code' that contributes to the specification of cell types. In the ventral spinal cord, the binary LIM homeobox protein 3 (Lhx3)/LIM domain-binding protein 1 (Ldb1) complex specifies the formation of V2 interneurons. The additional expression of islet-1 (Isl1) in adjacent cells instead specifies the formation of motor neurons through assembly of a ternary complex in which Isl1 contacts both Lhx3 and Ldb1, displacing Lhx3 as the binding partner of Ldb1. However, little is known about how this molecular switch occurs. Here, we have identified the 30-residue Lhx3-binding domain on Isl1 (Isl1LBD). Although the LIM interaction domain of Ldb1 (Ldb1LID) and Isl1LBD share low levels of sequence homology, X-ray and NMR structures reveal that they bind Lhx3 in an identical manner, that is, Isl1LBD mimics Ldb1LID. These data provide a structural basis for the formation of cell type-specific protein–protein interactions in which unstructured linear motifs with diverse sequences compete to bind protein partners. The resulting alternate protein complexes can target different genes to regulate key biological events.
Keywords: cell specification, competitive binding, LIM code, LIM homeodomain proteins, protein complexes
Introduction
The formation of cell type-specific complexes is crucial for the development of complex organisms. Unique combinations of LIM-homeodomain (LIM-HD) proteins are thought to form a transcriptional ‘LIM code' that is required for the specification of cell types within many different tissues and organs (reviewed in Gill, 2003). LIM-HD proteins are characterised by two tandemly arrayed LIM domains at or near their N termini that mediate interactions with other proteins (Bach, 2000), and a central homeodomain (HD) that recognises TAAT-containing DNA sequences. The LIM and HD regions share a high level of sequence conservation, but the C-terminal regions of the proteins are diverse.
The LIM domains from LIM-HD and related LIM-only (LMO) proteins bind to the LIM domain-binding (Ldb, also known as CLIM, NLI or CHIP) proteins, by means of an ∼30-residue LIM interaction domain (LID) on Ldb1 (Ldb1LID; Jurata et al, 1998; Deane et al, 2004). This broadly expressed protein is involved in multiple developmental pathways (reviewed by Matthews and Visvader, 2003). In LMO:Ldb1 complexes, Ldb1LID binds as an extended peptide, stretching across both LIM domains in a head-to-tail fashion (Deane et al, 2003, 2004). Ldb1 also contains an N-terminal self-association (SA) domain. Many of the biological activities of LIM-HD proteins depend on binding to Ldb1 oligomers, and at least two different LIM-HD or LMO proteins may simultaneously take part in Ldb1-containing complexes (Jurata et al, 1998).
Specific transcriptional codes involving LIM-HDs are particularly important in the developing central nervous system of vertebrates where these proteins are important in the specification of a large number of distinct cell types. For example, the two LIM-HD proteins, Lhx3 (LIM homeobox protein 3) and Isl1 (Islet-1), act together with Ldb1 to specify two distinct cell types that lie adjacent to each other in the developing spinal cord, namely V2 interneurons and motor neurons. Ldb1 and Lhx3 are both present in developing V2 interneurons, whereas Isl1 is additionally expressed in postmitotic motor neurons (Pfaff et al, 1996; Sharma et al, 1998). In the developing chick, the introduction of Isl1 into immature V2 interneurons gives rise to axonal outgrowths that are characteristic of motor neurons (Thaler et al, 2002). Thaler et al also provided compelling evidence that in V2 interneurons Lhx3 binds Ldb1 directly to form a transcriptionally active complex, whereas the additional presence of Isl1 in motor neurons results in a situation where Isl1 directly contacts Ldb1 and Lhx3.
Here we used a combination of structural, mutagenic and biophysical approaches to identify the region of Isl1 that binds the LIM domains of Lhx3 (Isl1LBD) and to establish the structural basis for the specification of motor neurons by Lhx3, Isl1 and Ldb1. Our X-ray and NMR structures of Lhx3:Ldb1LID and Lhx3:Isl1LBD complexes demonstrate that, despite the low homology between Ldb1LID and Isl1LBD, the two proteins bind in an essentially identical bipartite manner. Simulations of complex formation for these proteins based on experimental binding data indicate that binary and ternary complexes are likely to target different genes.
Results
Identification of the Lhx3-binding domain on Isl1
The region of Ldb1 that binds LIM domains, Ldb1LID, is well defined (Figure 1A; Jurata and Gill, 1997; Deane et al, 2004); however, the region on Isl1 that binds the LIM domains of Lhx3 was only roughly identified as lying C-terminal to the LIM domains in Isl1 (Figure 1B; Thaler et al, 2002). We therefore generated a series of deletion mutants of Isl1 and used yeast two-hybrid (Y2H) analysis to precisely delineate the Lhx3/Isl1 interaction. Our data revealed a 30-residue sequence in Isl1 that binds the tandem LIM domains of Lhx3. Isl1262–291, hereafter termed the Lhx3-binding domain Isl1LBD, lies C-terminal to the HD and N-terminal to the 16-residue Isl-specific domain (Thor and Thomas, 1997; Figure 1A and Supplementary data 1). Isl1LBD and Ldb1LID are essentially of the same length and share some slight sequence similarity near their N termini, but overall display very little sequence conservation. A far-UV CD spectrum of Isl1LBD suggests that, similar to Ldb1LID, the isolated domain is largely disordered (Figure 1C; Deane et al, 2004). Using Y2H, we showed that Isl1LBD was not able to interact with tandem LIM domains of Lhx3 (Lhx3LIM1+2) when the latter protein was expressed as a fusion with Ldb1LID (Figure 1D; see below for a description of tethered complexes). Thus, we hypothesised that Ldb1 and Isl1 might contact the same or overlapping sites on Lhx3.
Figure 1.

Interactions of Isl1, Lhx3 and Ldb1 in developing V2 interneurons and motor neurons. (A) Schematics of Isl1, Lhx3 and Ldb1 from mice showing the arrangement of key domains. In addition to the LIM and HD domains, Isl1 contains the Lhx3-binding domain (LBD; residues 262–291; identified herein) and the Isl-specific domain (ISD, identified on the basis of sequence conservation 296–310; Thor and Thomas, 1997). (B) Relative arrangement of Ldb1 and Lhx3 in developing V2 interneurons (left) and Ldb1, Lhx3 and Isl1 in postmitotic motor neurons (right). The interactions examined in this paper are indicated with dashed circles (1, 2, 3). (C) Far-UV CD spectra for Isl1LBD and Ldb1LID at concentrations of ∼ 20 μM. Raw baseline-corrected data are presented. (D) Y2H data comparing the interaction of Isl1 (residues 133–349) with Lhx3LIM1+2 in the absence or presence of Ldb1LID. The selection conditions used were -L-W-H, 1 mM 3-AT.
Structure determination of Lhx3-binding domain complexes
To test the above hypothesis, we determined the structures of Lhx3/Ldb1 and Lhx3/Isl1 complexes. The isolated LIM domains from Lhx3, similar to most other LIM-HD and LMO proteins, tend to be insoluble and/or aggregation prone; however, we have developed a strategy to circumvent these problems by generating tethered proteins in which the LIM domains are fused to the Ldb1LID by a flexible glycine/serine linker (Deane et al, 2001). Hence, we created tethered Lhx3LIM1+2–Ldb1LID and Lhx3LIM1+2–Isl1LBD complexes for structure determination. For the tethered Lhx3LIM1+2–Ldb1LID complex, we used restraints derived from multidimensional NMR data (Table I), whereas we used X-ray crystallography for the Lhx3LIM1+2–Isl1LBD complex (Table II; Supplementary data 2).
Table 1.
Statistics for the structural ensembles of Lhx3LIM1+2– Ldb1LID
| Distance restraints | ||
| Total | 2679 | |
| Intra-residue | 1342 | |
| Sequential ((∣i−j∣)=1) | 450 | |
| Medium range (∣i−j∣=2,3) | 136 | |
| Long range (∣i−j∣>3) | 742 | |
| Ambiguous | 9 | |
| Dihedral angle restraintsa | ||
| ϕ | 102 | |
| ψ | 102 | |
| Atomic RMS differences (Å) | Backbone | Heavy atoms |
| Lhx328–89+Ldb1316–327b | 0.70±0.11 | 1.18±0.12 |
| Lhx391–151+Ldb1301–311 | 0.60±0.12 | 0.97±0.16 |
| Lhx328–151 | 1.32±0.33 | 1.62±0.30 |
| Ldb1301–327 | 1.25±0.32 | 1.60±0.30 |
| Lhx328–151+Ldb1301–327 | 1.36±0.32 | 1.66±0.29 |
| PROCHECK-NMR statistics | ||
| residues in | ||
| Favoured region | 74.3% | |
| Allowed region | 23.3% | |
| Generously allowed regions | 1.5% | |
| Disallowed regions | 0.9% | |
| Mean deviations from the ideal geometry | ||
| Bond length (Å) | 0.00182±0.00147 | |
| Bond angles (deg) | 0.2895±0.184 | |
| aFrom TALOS. | ||
| bThe structured regions of the complex are defined as Ldb1301–327 and Lhx328–151, which have order angle parameters for ϕ and ψ >0.9, with the exception of Ldb1312–315 and Lhx339–40,76–78,90,140−141. | ||
Table 2.
Data collection and refinement statistics for Lhx3LIM1+2–Isl1LBD
| MAD data sets | Native data seta | |||
|---|---|---|---|---|
| Peak | Remote | Inflection | ||
| Space group | C2 | |||
| Unit cell parameters (Å, deg) | a=119, b=62.2, c=51.9, β=91.6 | |||
| Wavelength (Å) | 1.282 | 1.170 | 1.283 | 1.54 |
| Resolution (Å) | 2.30 (2.34–2.30) | 2.30 (2.34–2.30) | 2.30 (2.34–2.30) | 2.05 |
| Mosaicity (deg) | 1.05 | 1.05 | 1.05 | 1.04 |
| No. of unique reflections | 14 610 | 14 313 | 14 339 | 23 109 |
| Completeness (%) | 85.4 (54.1) | 83.5 (47.5) | 83.7 (48.9) | 96.5 (78.1) |
| Redundancy | 6.4 (4.8) | 6.1 (4.5) | 6.3 (4.6) | 3.5 (2.1) |
| Rmergeb | 0.045 (0.218) | 0.045 (0.243) | 0.042 (0.215) | 0.051 (0.388) |
| Average I/σ(I) | 15.2 (7.0) | 14.8 (6.2) | 15.3 (7.3) | 13.4 (2.4) |
| Phasing statistics | ||||
| Resolution range (Å) | 30–2.3 | |||
| Zn sites/asymmetric unit | 8 | |||
| FOMMADc | 0.66 | |||
| FOMRESOLVEd | 0.7 | |||
| Model refinement | ||||
| Rcryste | 0.214 (0.287) | |||
| Rfreef | 0.254 (0.346) | |||
| No. of reflections used in refinement | 21 921 | |||
| No. of reflections in the test set | 1188 (5.1%) | |||
| Protein atoms (including Zn) | 2377 | |||
| Water molecules | 48 | |||
| RMSD bond length (Å) | 0.02 | |||
| RMSD bond angle (deg) | 1.5 | |||
| Mean protein B factor, all non-H atoms (Å2) | 43.1 | |||
| Mean water B factor (Å2) | 43.5 | |||
| Estimated standard uncertainties | ||||
| Coordinates, based on residual R (Å) | 0.2 | |||
| Coordinates, based on Rfree (Å) | 0.18 | |||
| Ramachandran plot, residues in | ||||
| Favoured regions (%) | 93.9 | |||
| Additional allowed regions (%) | 6.1 | |||
| Disallowed regions (%) | 0 | |||
| Values for the highest resolution shell are given in parentheses. | ||||
| aNative set data from Bhati et al (2008). | ||||
| bRmerge=∑h∑i∣Ii−〈I〉∣/∑h∑iIi. | ||||
| cFigure of merit after SOLVE phasing. | ||||
| dFigure of merit after RESOLVE. | ||||
| eRcryst=∑∣∣Fobs∣−∣Fcalc∣∣/∑∣Fobs∣, where ∣Fobs∣ and ∣Fobs∣ are the observed and calculated structure factor amplitudes. | ||||
| fRfree is Rcryst for the 5% validation set. | ||||
The solution structure of Lhx3LIM1+2–Ldb1LID
Lhx3LIM1+2–Ldb1LID forms an elongated complex in which Ldb1LID binds along the length of the tandem LIM domains of Lhx3 and the engineered linker that tethers the two proteins is unstructured (Figure 2A). An overlay of the 20 lowest energy structures of Lhx3LIM1+2–Ldb1LID has a backbone RMSD of 1.4 Å over the structured regions of the complex (Lhx328–151 and Ldb1301–327). However, each half of the complex is better defined, with backbone RMSDs of 0.70 Å for the ‘LIM1 half' (Lhx328–89 and Ldb1316–327; Figure 2B) and 0.60 Å for the ‘LIM2 half' (Lhx391–151 and Ldb1301–311; Figure 2C). Although 15N-1H heteronuclear NOE data for the complex (Supplementary data 3A) do not reveal any region of increased flexibility between the two LIM domains, residues Ldb1313–315 (which lie between the two LIM-binding segments) do have slightly increased mobility (15N-1H NOE values of 0.4–0.6). Further, comparison with the structures of other double LIM domain complexes with LIM-binding peptides (i.e., the LMO4:Ldb1LID complexes (Deane et al, 2004; Jeffries et al, 2006) and the Lhx3LBD complex—see below) indicates that the two LIM domains can take up different relative orientations related by a hinge-like motion. These data suggest that the larger RMSD for the full complex might arise at least in part from a degree of mobility between the two LIM domains. In the ensemble, several residues that lie between the two halves of the complex, Lhx390 and Ldb1312–315, are less well defined (order angle parameters for ϕ and ψ angles <0.8); these regions are hereafter referred to as the ‘hinge' in Lhx3 and ‘spacer' in Ldb1LID.
Figure 2.

Structures of Lhx3LIM1+2–LID complexes. (A) Ribbon representation of the lowest energy structure of Lhx3LIM1+2–Ldb1LID in solution. Only the structured regions of Lhx3 (blue) and Ldb1LID (yellow) are shown. The zinc ions (grey spheres) and the side chains of the zinc-ligating residues (orange) are shown. The position of the unstructured linker is indicated. (B, C) Backbone traces of the 20 lowest energy structures of the Lhx3LIM1+2–Ldb1LID complex. Overlays over the backbone atoms of (B) LIM1 (Lhx328–89 plus Ldb1316–327) and (C) LIM2 (Lhx391–151 and Ldb1301–311) are shown. (D) The structured residues of monomeric Lhx3LIM1+2–Isl1LBD complex. Lhx3 is shown in blue and Isl1LBD is shown in green. (E) The symmetry-related dimer Lhx3LIM1+2–Isl1LBD. Half-dimers are coloured green and blue, respectively, with Lhx3 in the darker and Isl1 in the lighter colour. (F) Overlay of dimeric (Lhx3 (green)/Isl1LBD (turquoise)) and monomeric (Lhx3 (yellow)/Isl1LBD (magenta)) forms of the Lhx3LIM1+2–Ldb1LID complex overlaid over the backbone atoms of Lhx3LIM2. Only residues 262–273 of Isl1LBD from the dimer are shown for clarity. Figures were prepared in MolMol (Koradi et al, 1996).
To confirm that the tethered Lhx3LIM1+2–Ldb1LID construct mimicked the native complex, we used a construct that contained a Factor Xa protease site in the linker. 15N-HSQC spectra from this variant before and after protease treatment are essentially identical (Supplementary data 3B and C), demonstrating that the conformations of Lhx3 and Ldb1LID are equivalent in the intra- and intermolecular complexes.
The crystal structure of Lhx3LIM1+2–Isl1LBD
The structure of the Lhx3LIM1+2–Isl1LBD complex was determined using native and multiple anomalous dispersion data (collected at the Zn X-ray absorption edge) recorded to 2.05 and 2.30 Å resolution, respectively. The R and Rfree values presented in Table II are consistent for an X-ray crystal structure to 2.05 Å resolution with disordered regions arising from the missing loop between Lhx3LIM1+2 and the Isl1LBD. There were two molecules of Lhx3–Isl1LBD in the asymmetric unit, a monomer and a half-dimer, where the other half of the dimer comes from a symmetry-related molecule (Figure 2D and E). The structured regions of the monomer comprise Lhx3 residues 28–153 (plus two N-terminal residues, GS, derived from the vector) and Isl1 residues 262–288, forming an extended rod-like complex that resembles the solution structure of Lhx3LIM1+2–Ldb1LID (Figure 2A and D). The dimer comprises Lhx3 residues 32–154 and Isl1 residues 262–286, and is effectively a domain-swapped version of the monomer. The N-terminal half of Isl1LBD (residues 262–273) binds its own intramolecular partner at the LIM2 domain of Lhx3, but is bent around by nearly 180° through Isl1LBD residues 274–278 (the Isl1LBD spacer) such that the remaining half of the Isl1LBD segment (residues 279–286) contacts the LIM1 domain of Lhx3 in the symmetry-related molecule. Data from gel filtration monitored by multiangle laser light scatting revealed that the protein is monomeric in solution (Supplementary data 4), indicating that the 1:1 complex represents the dominant biological species (see Discussion for possible functional hints suggested by the domain-swapped dimer).
When the LIM1 domains of the different oligomeric forms of the Lhx3–Isl1LBD complex are overlaid, it can be seen that the orientation of the two LIM domains with respect to each other differs; the LIM2 domain of the dimer has swung ‘downwards' from the hinge between the domains by ∼40° (Figure 2F). However, apart from differences that appear to be associated with the spacer residues in Isl1LBD and the hinge region of Lhx3, the two halves of the different oligomeric forms are essentially identical: the backbone RMSDs for Lhx3LIM1 (residues 32–89) are 0.86 Å and for Lhx3LIM2 (residues 90–152) are 0.83 Å, and the contacts between Lhx3 and Isl1 are identical.
Geometry of the Lhx3LIM1+2/peptide complexes
The LIM domains from the different structures conform to the typical LIM domain topology (Perez-Alvarado et al, 1996; Supplementary data 5), and are very similar to each other. RMSDs over the backbone residues of Lhx3 from the lowest energy member of the NMR ensemble of Lhx3–Ldb1LID and the Lhx3–Isl1LBD monomer are 1.8 Å for Lhx3LIM1 and 1.3 Å for Lhx3LIM2. However, the relative orientation of the two LIM domains differs in the different complexes (Supplementary data 5).
In the Lhx3–Ldb1LID and Lhx3–Isl1LBD structures, the Isl1/Ldb1 peptides bind both LIM domains from Lhx3 in an extended manner, forming β-strand(s) that pack in an antiparallel fashion against the second β-hairpin in each of the first and fourth Zn-ligating modules (Zn1 and Zn4, respectively; Figure 2A and D). Isl1LBD forms an additional β-strand that packs against the equivalent hairpin in the second Zn-ligating module in Lhx3 (Zn2), and interdomain backbone–backbone hydrogen bonds suggest that some β-strand is also forming in Ldb1LID where it packs against the second β-hairpin in the third Zn-ligating module (Zn3; Figure 3A). In the case of the Lhx3–Ldb1 complex, 3500–3600 Å2 of surface area is buried at the interface between the two proteins, whereas the Lhx3–Isl1 complex buries ∼3250 Å2. Both interactions involve a combination of main-chain and side-chain hydrogen bonds, hydrophobic interactions and some electrostatic interactions (Figure 3A and B).
Figure 3.

Comparison of Lhx3-bound Ldb1LID and Isl1LBD. Interaction maps of (A) Lhx3LIM1+2 and Ldb1LID and (B) Lhx3LIM1+2 and Isl1LBD. Residues from Ldb1LID are shown as yellow boxes and those from Isl1LBD as green boxes. Residues from Lhx3 that form contacts with the LIDs are classed as indicated. (C, D) Structural alignment over the backbone atoms of (C) Lhx3LIM1 and (D) Lhx3LIM2 showing the side-chain heavy atoms of Isl1LBD (green) and Ldb1LID (orange). The Lhx3 LIM domains from the Isl1LBD structure are shown as a grey surface. (E) Structure-based sequence alignment of Isl1LBD and Ldb1LID. Asterisks show residues that occupy equivalent positions in the structures. Key Lhx3-binding residues in (F) Ldb1LID and (G) Isl1LBD. Lhx3LIM1+2 in each case is shown as a surface model (grey) with Ldb1LID (yellow) or Isl1LBD (green). For Ldb1LID, the side chains of key residues from alanine scanning mutagenesis screens are classed as having a strong (red), moderate (orange) or weak (yellow) effect, whereas for Isl1LBD the indicated residues (green) all have a strong effect.
Despite low sequence homology, the backbone and many of the side-chain atoms of the Lhx3-binding peptides occupy identical positions on the surface of Lhx3 (Figure 3C and D). The main differences occur within the spacers of the binding domains. A structure-based alignment of those domains (Figure 3E) reveals two binding sites of nine and seven residues, separated by a variable length (six and nine residues in Isl1LBD and Ldb1LID, respectively) spacer. The increased flexibility noted above for residues in the Ldb1LID spacer is also consistent with the poor alignment of these residues between Ldb1LID and Isl1LBD and indicates that this stretch does not have an important role in recognition.
Mutagenic analysis of the interface
We used alanine scanning mutagenesis to look for key binding determinants of peptide/LIM-HD interactions. Sets of three residues in Ldb1LID and Isl1LBD were systematically mutated to alanine (and subsequently single and double point mutants were made) and tested for binding to LIM domain constructs of Lhx3 using Y2H (Table III and Figure 3F and G).
Table 3.
Mutagenic scanning of Ldb1LID and Isl1LBD
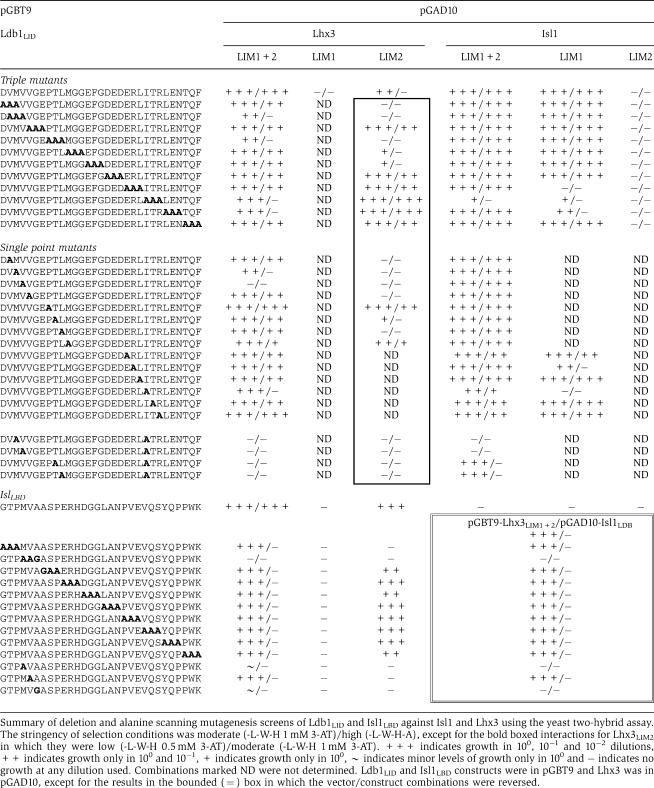 |
Mutations in either the N- or C-terminal halves of Ldb1LID were able to reduce binding to Lhx3LIM1+2. Ldb1LID-V303, which packs against the surface of Lhx3LIM2 and is only partially buried, had the strongest effect when mutated to alanine. I322 and M302, which are highly buried in the interface between Ldb1 and Lhx3LIM1 and Lhx3LIM2, respectively, had a more moderate effect when mutated. V304 and L309 were identified as having a weak effect on the interaction when mutated. These residues are buried in the Ldb1/Lhx3LIM2 interface. Only Lhx3LIM2 and not Lhx3LIM1 was able to independently bind Ldb1LID, indicating that although both ‘halves' of the interaction contribute to binding, the main binding determinants lie between the N-terminal half of Ldb1 and Lhx3LIM2.
Only mutations in the N-terminal half of Isl1LBD reduced binding to Lhx3LIM1+2, and only Lhx3LIM2 was able to independently bind the Isl1 peptide, showing that the main binding determinants between Isl1 and Lhx3 also lie in the N-terminal half of the peptide-binding domain and Lhx3LIM2. The residues in Isl1LBD that when mutated had the most effect on binding were M265 and A267, which are both highly buried at the interface. Notably, the key binding residues for the two complexes from our mutagenic data occupy very different physical spaces: Isl1A267 is buried in a hydrophobic pocket formed between Zn1 and Zn2 in Lhx3LIM1, whereas Ldb1V303 lies flat on the surface of Lhx3LIM1 (Figure 3F and G).
The peptides were also tested for binding against the LIM domains of Isl1. There was no evidence of an intermolecular interaction between Isl1LIM1+2 and Isl1LBD. However, in contrast to Lhx3, Isl1LIM1 but not Isl1LIM2, could mediate an interaction with Ldb1LID. Mutation of several residues in the C-terminal half of Ldb1LID impaired binding to Isl1LIM1+2 and Isl1LIM1, but no mutation in the N-terminal half of Ldb1LID perturbed binding to Isl1LIM1+2. These data indicate that the most important contacts are made between Isl1LIM1 and the C-terminal half of Ldb1LID, which is consistent with published glutathione-S-transferase (GST) pulldown data for this interaction (Jurata et al, 1996). However, mutations made against a background of the I322A mutation revealed that residues in the N-terminal half of Ldb1 (especially residues M302 and V303) are important in binding.
Relative stabilities of the LIM complexes
Having confirmed that both Lhx3 and Isl1 bind the same domain on Ldb1 and having determined that both Ldb1 and Isl1 bind the same site on Lhx3, we next sought to measure binding affinities for these different competing interactions to establish which complexes would be likely to form in vivo. Because the LIM domains of Isl1 and Lhx3 tend to be insoluble and prone to aggregation, it is not possible to measure the affinities using typical biophysical approaches. Thus, for the Ldb1/Lhx3 and Ldb1/Isl1 interactions, we generated tethered versions of the LIM–LID complexes where the linker contained a Factor Xa protease site (Figure 4A, inset). The tethered constructs were produced as GST fusion proteins and the linkers cut with Factor Xa to yield stable intermolecular LIM/LID and LIM/LBD complexes. FLAG-tagged Ldb1LID was then used to compete off the unlabelled peptide in a competition ELISA, yielding dissociation constants of 35 nM for Lhx3/Ldb1LID and 90 nM for Isl1/Ldb1LID (Figure 4A).
Figure 4.

Binding affinities and modelling of complex formation. (A) ELISAs showing the ability of FLAG-tagged Ldb1LID to bind to the cut Isl1/Ldb1LID and Lhx3/Ldb1LID complexes. Data were corrected for background binding to GST, and the error bars show the range of values obtained from triplicates of a single experiment. The inset shows a schematic of tethered intramolecular constructs of the Isl1–Ldb1LID, where the linker contains a Factor Xa protease site. After treatment with Factor Xa, the linker is cut to form an intermolecular complex. (B) GdnHCl denaturation curves for Lhx3–Ldb1LID and Lhx3–Isl1LBD constructs as indicated. (C–E) Trends for the formation of protein and protein:DNA complexes containing Ldb1, Lhx3 and Isl1. Concentrations of all components were set at 1, 10 and 100 nM. (C) Distribution of Ldb1/LIM-HD complexes using the binary model (no interaction between Isl1 and Lhx3, and no DNA). (D) Distribution of protein-only complexes using the ternary model, which also considers binding of Isl1 and Lhx3. (E) Distribution of key protein:DNA complexes relative to Ldb1/Lhx3/DNA. The I series shows the results of using the independent model, the SA series shows the results of the single-molecule DNA-binding advantage model where the binding of two and four HDs to a single molecule of DNA shows increased binding affinities over single HD binding.
The competition ELISA approach used above did not yield good quality data for Lhx3LIM1+2–Isl1LBD, so we instead compared the relative stability of Lhx3–Ldb1LID and Lhx3–Isl1LBD constructs to chemical denaturation monitored by tryptophan fluorescence (Figure 4B). The Lhx3 domains and the linkers in each case are identical, thus any differences in the stability of the different complexes should correlate with relative differences in binding of the LIDs. We used constructs of tethered complexes in both orientations (i.e., LID–LIM and LIM–LID) to control for any differences in stability conferred by the position of the linker (Jeffries et al, 2006): these differences were very small for either pairing. Importantly, it was evident that the Isl1LBD-containing complexes were significantly less resistant to GdnHCl denaturation than the Ldb1LID-containing complexes (midpoint of denaturation ∼3.4 versus 5.8 M GdnHCl, respectively). Thus, although it was not possible to determine dissociation constants by this approach, Isl1LBD appears to bind Lhx3 with significantly lower affinity than does Ldb1LID.
Estimating the population distributions of Ldb1-, Lhx3- and Isl1-containing complexes
We then used our binding data and the program DynaFit3 (Kuzmic, 1996) to model the relative populations of the various binary and ternary complexes containing Ldb1, Lhx3 and Isl1, together with DNA sequences containing either single or double sites for either or both the HDs of Lhx3 and Isl1 (Figure 4C–E and Supplementary data 7). As the effective local concentrations of these proteins within the nucleus are unknown, this modelling was designed to assess trends over a range of different conditions rather than to predict actual concentrations of complexes. Protein concentrations in the range 1 nM up to 1 mM were used, taking into account both the predicted concentrations of nuclear transcription factors (∼1–100 nM) (Ryan et al, 2007) and the possibility of local concentration effects, which might give rise to much higher effective concentrations. Equal concentrations of all starting components were used.
If we just consider the competition of Lhx3 and Isl1 for Ldb1 (i.e., ignoring both Isl1LBD and DNA; Figure 4C), simulations carried out at different concentrations reveal that in the absence of any other interactions, Ldb1LID exhibits a preference for binding Lhx3 over Isl1 at the level of approximately two-fold more Lhx3/Ldb1 rather than Isl1/Ldb1 complexes being formed (e.g., 2.5-fold at 1 nM protein concentrations and 1.9-fold at 100 nM protein concentrations).
If we additionally consider the Lhx3–Isl1 interaction in our model (Figure 4D), we find that the ternary Lhx3/Isl1/Ldb1 complex is unlikely to be significantly populated. Even in the presence of DNA (Figure 4E), ternary complex formation (right-hand bars in Figure 4E) is favoured only if the four HDs in the ternary complex can bind simultaneously to multiple DNA sites (SA series) and gain a free energy ‘bonus' through the chelate effect (the reduction of entropy loss when binding a second site on the same molecule; Figure 4E).
The other situation in which the ternary complex is favoured, even in the absence of DNA, arises when the protein concentrations are set to be very high (mM concentrations; Supplementary data 7). Finally, the modelling data also indicate that significant levels of Lhx3–Ldb1 and Isl1–Ldb1 complexes are also likely to be present in cells in which Lhx3, Isl1 and Ldb1 are all coexpressed.
Discussion
The formation of cell-specific LIM-HD-containing complexes
The data from this study reveal that Isl1 is able to alter the nature of transcriptional complexes formed by Lhx3 and Ldb1 at neuronal promoters by binding Lhx3 through a decoy peptide domain within its own C terminus and allowing Isl1 to instead bind Ldb1LID. The subsequent formation of the ternary Ldb1/Isl1/Lhx3 complex appears to be driven by enhanced binding to DNA sequences that contain multiple HD-binding sites. In support of this model, only constructs that can form ternary complexes (or artificial analogues of ternary complexes) with intact HDs from both Lhx3 and Isl1 can trigger motor neuron differentiation in cell lines (Thaler et al, 2002). Moreover, the enhancer for a key target of the ternary Ldb1/Isl1/Lhx3 complex in motor neuron development, Hb9 (Thaler et al, 1999), is bound only when both Lhx3 and Isl1 are present; neither Lhx3 nor Isl1 alone can bind (Lee and Pfaff, 2003). Thus, the ternary complex appears to be able to target different sets of genes compared with binary Ldb1/Lhx3 or Ldb1/Isl1 complexes. It is also possible that Ldb1/Lhx3 and Ldb1/Isl1 complexes are recruited to the vicinity of the motor neuron sites by interactions between Ldb1 and other transcription factors (Lee and Pfaff, 2003).
The common occurrence of Isl1/Lhx3 complexes
Isl1LBD is a common feature in Isl proteins from complex organisms (Supplementary data 8). Residues in the spacer region can vary considerably, whereas residues within the binding motifs tend to be highly conserved. Lhx3 family proteins are also found in the same organisms, suggesting that the Isl/Lhx3 interaction is highly conserved and has been central to nervous system development from its evolutionary beginnings. It should be noted that the interaction of Lhx3 and Isl1 is not restricted to V2 interneurons and/or motor neurons; the two proteins interact in pituitary cells to regulate expression of the gonadotropin-releasing hormone receptor (Granger et al, 2006). Notably, the promoter of the follicle-stimulating hormone β gene contains at least six HD-binding elements that might be recognised by ternary complexes (West et al, 2004).
A comparison of LIM–Ldb1LID complexes
We have previously determined structures of LIM domains from LMO proteins in complex with Ldb1LID (Deane et al, 2003, 2004; Jeffries et al, 2006). The relative orientations of the LIM domains from tandem LIM structures of LMO4 and Lhx3 differ, but the LIM1 and LIM2 domains are very similar, despite small gaps within the sequence alignments of these LIM domains (Figure 5A and Supplementary data 6). Although equivalent residues in the LIM domains contact Ldb1LID, the sequence conservation of those residues varies (Figure 5A). However, apart from significant structural differences around the hinge/spacer regions, there is a high level of structural conservation at the LIM/LID interfaces (Figure 5B and C). Mutagenic screens of Ldb1LID versus four different LMO and LIM-HD proteins (Deane et al, 2004; Ryan et al, 2006; this study) implicate similar residues in Ldb1LID as important for binding (Figure 5D). Several guiding principles emerge for Ldb1LID/LIM interactions: (i) Ldb1I322 is the key residue for binding LIM1; (ii) Ldb1V303 is the key residue for binding LIM2 with a secondary cluster of residues around Ldb1L309; (iii) mutations in both halves are often required to abrogate binding; and (iv) there is little or no contribution of residues from the spacer region in Ldb1LID to binding, indicating that Ldb1LID binds the tandem LIM domains of both LIM-HD and LMO proteins through two closely spaced binding motifs (Figure 5D). Thus, apart from different relative orientations of the two halves of the complexes, it is likely that Ldb1LID binds all LMO/LIM-HD proteins in fundamentally the same manner.
Figure 5.

Comparison of LIM–Ldb1LID complexes. (A) Structure-based sequence alignment of the LIM1 domains from murine LMO2, LMO4 and Lhx3 (Lhx3b numbering is used although the LIM domains are the same in different splice variants of Lhx3). Dots show conserved residues, dashes indicate gaps in the alignment and zinc-ligating residues are indicated by an asterisk. A consensus sequence for LIM domains from LIM-HD and LMO proteins from Deane et al (2004) is also shown. Fully conserved residues are indicated as capitals, + indicates R or K, − indicates D or E, and ϕ indicates bulky hydrophobic residues. Residues that are conserved at the interface of LIM–Ldb1LID interactions are shaded (grey—hydrophobic; blue—backbone–backbone hydrogen bonds; yellow—other hydrogen bonds; red—electrostatic; many residues coloured blue, yellow or red also make hydrophobic interactions). Underlined residues in Lhx3 are at the interface of the Lhx3/Isl1LBD complex. (B, C) Ldb1LID from complexes containing LMO2 (1J2O, cyan), LMO4 (1M3V, violet; IRUT, magenta) and Lhx3 (yellow) shown in relation to the LIM domains from Lhx3 (grey surface representation) structures are overlaid over the backbone atoms of the LIM domains. (B) LIM1 domains/C-terminal half of Ldb1LID as backbone traces. (C) LIM2 domains/side-chain heavy atoms of the N-terminal half of Ldb1LID. (D) Summary of alanine mutagenic screening of Ldb1LID against LMO2, LMO4, Lhx3 and Isl1. The sequence of Ldb1LID is shown at the top; coloured boxes indicate a weak (yellow), moderate (orange) and strong (red) effect on binding when residues were individually mutated to alanine. Grey boxes indicate no differences. Where structures have been determined (LMO2LIM1, LMO4, Lhx3), β-strands formed in Ldb1LID are shown as black bars. The spacer region from the Lhx3–Ldb1LID complex is shown as a green bar.
A mechanism for exchanging partners
The modular nature of LIM–peptide interactions, the apparent flexibility of the Ldb1LID spacer and the observation that the Isl1LBD can adopt different conformations (Figure 2E) all suggest a molecular mechanism for the disruption of the preferred Lhx3/Ldb1 complex by Isl1 (Figure 6). Lhx3 bound to Ldb1LID (Figure 6A) makes stronger contacts through Lhx3LIM2. It is possible that Lhx3LIM1 periodically becomes ‘unstuck' whereas Lhx3LIM2 remains in contact with Ldb1LID (Figure 6B). When Isl1 is introduced to this half-complex, it is free to bind to Ldb1LID through its favoured half (Isl1LIM1), leaving Lhx3LIM2 bound to the N-terminal half of Ldb1LID (Figure 6C). Isl1LBD would now be in close proximity to the Lhx3 LIM domains, encouraging the formation of an Isl1LBD/Lhx3LIM1 interaction (Figure 6D). Although this interaction is likely to be weak, it would be enhanced by the chelate effect. A final rearrangement of the LIM–LID interactions (Figure 6E and F) would give rise to the Ldb1/Isl1/Lhx3 complex.
Figure 6.

Putative mechanism for cofactor exchange between Lhx3 and Isl1. Only Ldb1LID is shown for simplicity. (A) Lhx3 and Ldb1 form a complex where Ldb1LID extends across both LIM domains of Lhx3. (B) Lhx3LIM2 binds more tightly than Lhx3LIM1 and for some of the time Lhx3LIM1 is exposed while Lhx3LIM2 remains bound. (C) Isl1LIM1 can bind the C-terminal half of Ldb1LID. (D) The C-terminal half of Isl1LBD is brought into close proximity to Lhx3 and binds Lhx3LIM1 (E, F) The N-terminal half of Ldb1LID dissociates from Lhx3LIM2 to bind Isl1LIM2, allowing the N-terminal half of Isl1LBD to bind Lhx3LIM2. Complexes in (C–F) are stabilised through the simultaneous binding to both Lhx3 and Isl1 recognition sites on target genes.
Tandem binding motifs as mediators of protein signalling networks
Many protein:protein interactions are regulated through intrinsically unstructured motifs that take up a defined structure on binding to their partner (Dyson and Wright, 2005). More than 30% of protein sequence within eukaryotes is predicted to be intrinsically unstructured (Ward et al, 2004), and these regions exhibit a preponderance of short repeated sequences that vary in length and number of repeats (Tompa, 2003). The Lhx3-binding domains characterised here resemble tandemly arrayed linear motifs, although they lack the sequence conservation through which linear motifs have thus far been identified (Neduva and Russell, 2006). Given our observations of tandem binding repeats with very low levels of sequence homology, we suggest that tandem binding events between unstructured domains and folded protein domains could be extremely common.
Despite the plethora of newly defined unstructured domains in the literature, the majority of unstructured domains are yet to be characterised. For example, LIM-HD proteins (and indeed the majority of transcription factors) all contain long stretches of putatively unstructured protein sequence. We predict that other interactions mediated by intrinsically unstructured domains within LIM-HDs will have significant roles in establishing the identity of developing cells through the implementation of transcriptional LIM codes. Thus, it is likely that tandemly arrayed interaction motifs competing for binding to target proteins will emerge as an important general strategy for the formation and dynamics of multiprotein complexes.
Materials and methods
Cloning, mutagenesis and protein expression
All clones and mutants were generated by PCR and sequenced to confirm identity (SUPAMAC, Royal Prince Alfred Hospital, Sydney). Proteins were expressed with a GST tag using pGEX vectors (either pGEX-2T or a modified version of this vector in which the thrombin protease site was removed) in Escherichia coli BL21(DE3) at 20 or 25°C for ∼16 h. All proteins were purified by GSH-Sepharose 4B™ (GE Healthcare) affinity chromatography. Tethered proteins used for structural studies were additionally treated with thrombin to remove the GST tag and purified using either anion exchange chromatography (20 mM Tris–HCl, 1 mM DTT (pH 7.5 or 8.0) plus 0–1 M NaCl) or size-exclusion chromatography (Sephadex 75 20/60; GE Healthcare).
NMR solution structure determination and refinement
Data for chemical shift assignments for Lhx3LIM1+2–Ldb1LID were collected using the suite of triple resonance experiments as described previously (Lee et al, 2005). NOE distance restraints were obtained from three-dimensional 15N-NOESY-HSQC (80 ms mixing time) and 13C-NOESY-HSQC spectra (120 ms mixing time). Dihedral restraints were derived from backbone chemical shifts using TALOS (Cornilescu et al, 1999). Iterative manual assignment of NOEs was used to calculate the initial structures of Lhx3LIM1+2–Ldb1LID using ARIA (version 1.2) (Nilges et al, 1997). Of the structures calculated by ARIA, the best (lowest energy) 10 structures were used as template structures for further refinement in CNS (version 1.1) (Brunger et al, 1998). The quality of the ensemble of 20 best structures was assessed using PROCHECK-NMR (Laskowski et al, 1996). Chemical shift assignments, and NOE and dihedral restraint data have been deposited at BMRB (accession code 6658) and the coordinates for the ensemble have been deposited in the Protein Data Bank (2JTN).
X-ray structure determination and refinement
The crystallisation, collection and processing of a native data set for Lhx3LIM1+2–Isl1LBD were described previously (Bhati et al, 2008). Multiple wavelength anomalous dispersion data were recorded at three wavelengths near the zinc absorption edge: λ1, 1.282 Å (the peak); λ2, 1.170 Å (a high energy remote); λ3, 1.283 Å (the inflection) on the GM/CA-CAT beamline 23ID-D at the Advanced Photon Source, Argonne National Laboratory, using a CCD detector, MARmosaic 300 (Marresearch). The synchrotron data were processed and scaled with HKL2000 (Otwinowski and Minor, 1997).
The zinc positions were located and the initial phases to 2.3 Å resolution were calculated with the program SOLVE (Terwilliger and Berendzen, 1999). The program RESOLVE (Terwilliger, 2000) was then employed for statistical density modification, local pattern matching and automated model building to 2.3 Å resolution. The resulting phases were combined with the high-resolution native data set and further automatic model building with phase extension to 2.05 Å resolution was carried out using ARP/warp (Perrakis et al, 1999). Manual manipulation of the structure was performed in COOT (Emsley and Cowtan, 2004). All refinement steps were carried out using REFMAC5 with TLS refinement (Murshudov et al, 1997; Winn et al, 2001). Analysis and validation of the structure were carried out with the assistance of the program PROCHECK (Laskowski et al, 1993) and the MOLPROBITY server (Lovell et al, 2003). The coordinates for the structures have been deposited in the Protein Data Bank (2RGT).
Yeast two-hybrid analysis
Y2H analysis was carried out using inserts cloned into modified pGBT9 and pGAD10 plasmids, and transformed into AH109 cells (Clontech), as described previously (Deane et al, 2004; Ryan et al, 2006). Selection conditions were all based on media lacking leucine and tryptophan to ensure co-transformation of both plasmids. For the detection of an interaction, media were also deficient in histidine and supplemented with X-α-Gal (40 μg ml−1), further supplemented with 3-amino-1,2,4-triazole (3-AT; moderate stringency), or were deficient in both histidine and adenine (high stringency) as indicated.
Binding and denaturation experiments
Competition ELISA experiments (Deane et al, 2004) and GdnHCl denaturation experiments were performed as described previously (Jeffries et al, 2006). Unfolding was monitored by the tryptophan fluorescence wavelength maximum (λmax) in the range 325–370 nm and data are reported as fraction folded. For the Lhx3–Ldb1LID proteins, it was assumed that the λmax of the fully unfolded proteins was 360 nm. Data were fitted to pseudo-two-state unfolding models to estimate the midpoints of denaturation of the curves (Fersht, 1998).
Modelling of population distributions of complexes
The relative populations of complexes that form were modelled using the program DynaFit3 (Biokin Inc., USA) (Kuzmic, 1996). For protein-only complexes, two different models were used: binary (B, no interaction between Isl1 and Lhx3) and ternary (T; interaction between Isl1 and Lhx3 was set at 200 nM). For protein binding in the presence of DNA, three different models were used: independent (I, each DNA site was considered to bind in an independent fashion with Kd=100 nM and was specific for either Lhx3 or Isl1), single-molecule DNA binding (S, protein complexes that bind two DNA sites were considered to bind with Kd=1 nM) and the single-molecule DNA-binding advantage (SA, four sites were additionally considered to bind with Kd=0.1 nM). The total concentrations of each protein and DNA species were all assigned the same value ranging from 1 nM to 1 mM in different simulations. For additional details, including the equations used in the models, see Supplementary data 7. The populations of key species under various conditions were estimated and are shown as relative populations (to Ldb1:Lhx3 or Ldb1:Lhx3:DNA).
Supplementary Material
Supplementary Figures
Acknowledgments
MB, CL and ML were supported by Australian Postgraduate Awards. JPM and JMM are Senior Research Fellows of the Australian National Health and Medical Research Council and Viertel Foundation, respectively. This work was supported by grant DP663289 from the Australian Research Council. GM/CA-CAT has been funded in whole or in part with federal funds from the National Cancer Institute (YI-CO-1020) and the National Institute of General Medical Sciences (YI-GM-1104). Use of the Advanced Photon Source was supported by the US Department of Energy, Basic Energy Sciences, Office of Science, under contract W-31-109-ENG-38.
References
- Bach I (2000) The LIM domain: regulation by association. Mech Dev 91: 5–17 [DOI] [PubMed] [Google Scholar]
- Bhati M, Lee M, Nancarrow AL, Bach I, Guss JM, Matthews JM (2008) Crystallization of an Lhx3–Isl1 complex. Acta Crystallogr Sect F Struct Biol Cryst Commun 64: 297–299 [DOI] [PMC free article] [PubMed] [Google Scholar]
- Brunger AT, Adams PD, Clore GM, Delano WL, Gros P, Grosse-Kunstleve RW, Jiang JS, Kuszewski J, Nilges N, Pannu NS, Read RJ, Rice LM, Simonson T, Warren GL (1998) Crystallography and NMR system (CNS): a new software system for macromolecular structure determination. Acta Crystallogr D Biol Crystallogr 54: 905–921 [DOI] [PubMed] [Google Scholar]
- Cornilescu G, Delaglio F, Bax A (1999) Protein backbone angle restraints from searching a database for chemical shift and sequence homology. J Biomol NMR 13: 289–302 [DOI] [PubMed] [Google Scholar]
- Deane JE, Mackay JP, Kwan AH, Sum EY, Visvader JE, Matthews JM (2003) Structural basis for the recognition of ldb1 by the N-terminal LIM domains of LMO2 and LMO4. EMBO J 22: 2224–2233 [DOI] [PMC free article] [PubMed] [Google Scholar]
- Deane JE, Ryan DP, Sunde M, Maher MJ, Guss JM, Visvader JE, Matthews JM (2004) Tandem LIM domains provide synergistic binding in the LMO4:Ldb1 complex. EMBO J 23: 3589–3598 [DOI] [PMC free article] [PubMed] [Google Scholar]
- Deane JE, Sum E, Mackay JP, Lindeman GJ, Visvader JE, Matthews JM (2001) Design, production and characterization of FLIN2 and FLIN4: the engineering of intramolecular LMO/ldb1 complexes. Protein Eng 14: 493–494 [DOI] [PubMed] [Google Scholar]
- Dyson HJ, Wright PE (2005) Intrinsically unstructured proteins and their functions. Nat Rev Mol Cell Biol 6: 197–208 [DOI] [PubMed] [Google Scholar]
- Emsley P, Cowtan K (2004) Coot: model-building tools for molecular graphics. Acta Crystallogr Sect D Biol Crystallogr 60: 2126–2132 [DOI] [PubMed] [Google Scholar]
- Fersht ARF (1998) Structure and Mechanism in Protein Science: A Guide to Enzyme Catalysis and Protein Folding, pp 513–515. New York: WH Freeman and Company [Google Scholar]
- Gill GN (2003) Decoding the LIM development code. Trans Am Clin Climatol Assoc 114: 179–189 [PMC free article] [PubMed] [Google Scholar]
- Granger A, Bleux C, Kottler ML, Rhodes SJ, Counis R, Laverriere JN (2006) The LIM-homeodomain proteins Isl-1 and Lhx3 act with steroidogenic factor 1 to enhance gonadotrope-specific activity of the gonadotropin-releasing hormone receptor gene promoter. Mol Endocrinol 20: 2093–2108 [DOI] [PubMed] [Google Scholar]
- Jeffries C, Graham S, Stokes PH, Collyer CA, Guss JM, Matthews JM (2006) Stabilization of a binary protein complex through intein-mediated circularization. Protein Sci 15: 2612–2618 [DOI] [PMC free article] [PubMed] [Google Scholar]
- Jurata LW, Gill GN (1997) Functional analysis of the nuclear LIM domain interactor NLI. Mol Cell Biol 17: 5688–5698 [DOI] [PMC free article] [PubMed] [Google Scholar]
- Jurata LW, Kenny DA, Gill GN (1996) Nuclear LIM interactor, a rhombotin and LIM homeodomain interacting protein, is expressed early in neuronal development. Proc Natl Acad Sci USA 93: 11693–11698 [DOI] [PMC free article] [PubMed] [Google Scholar]
- Jurata LW, Pfaff SL, Gill GN (1998) The nuclear LIM domain interactor NLI mediates homo- and heterodimerization of LIM domain transcription factors. J Biol Chem 273: 3152–3157 [DOI] [PubMed] [Google Scholar]
- Koradi R, Billeter M, Wüthrich K (1996) MOLMOL: a program for display and analysis of macromolecular structures. J Mol Graph 14: 51–55 [DOI] [PubMed] [Google Scholar]
- Kuzmic P (1996) Program DYNAFIT for the analysis of enzyme kinetic data: application to HIV proteinase. Anal Biochem 237: 260–273 [DOI] [PubMed] [Google Scholar]
- Laskowski RA, MacArthur MW, Moss DS, Thornton JM (1993) PROCHECK: a program to check the stereochemical quality of protein structures. J Appl Crystallogr 26: 283–291 [Google Scholar]
- Laskowski RA, Rullmannn JA, MacArthur MW, Kaptein R, Thornton JM (1996) AQUA and PROCHECK-NMR: programs for checking the quality of protein structures solved by NMR. J Biomol NMR 8: 477–486 [DOI] [PubMed] [Google Scholar]
- Lee C, Nancarrow AL, Bach I, Mackay JP, Matthews JM (2005) Letter to the Editor: 1H, 15N and 13C assignments of an intramolecular Lhx3:ldb1 complex. J Biomol NMR 33: 198. [DOI] [PubMed] [Google Scholar]
- Lee SK, Pfaff SL (2003) Synchronization of neurogenesis and motor neuron specification by direct coupling of bHLH and homeodomain transcription factors. Neuron 38: 731–745 [DOI] [PubMed] [Google Scholar]
- Lovell SC, Davis IW, Arendall WB III, de Bakker PI, Word JM, Prisant MG, Richardson JS, Richardson DC (2003) Structure validation by Calpha geometry: phi,psi and Cbeta deviation. Proteins 50: 437–450 [DOI] [PubMed] [Google Scholar]
- Matthews JM, Visvader JE (2003) LIM-domain-binding protein 1: a multifunctional cofactor that interacts with diverse proteins. EMBO Rep 4: 1132–1137 [DOI] [PMC free article] [PubMed] [Google Scholar]
- Murshudov GN, Vagin AA, Dodson EJ (1997) Refinement of macromolecular structures by the maximum-likelihood method. Acta Crystallogr Sect D Biol Crystallogr 53: 240–255 [DOI] [PubMed] [Google Scholar]
- Neduva V, Russell RB (2006) Peptides mediating interaction networks: new leads at last. Curr Opin Biotechnol 17: 465–471 [DOI] [PubMed] [Google Scholar]
- Nilges M, Macias MJ, O'Donoghue SI, Oschkinat H (1997) Automated NOESY interpretation with ambiguous distance restraints: the refined NMR solution structure of the pleckstrin homology domain from beta-spectrin. J Mol Biol 269: 408–422 [DOI] [PubMed] [Google Scholar]
- Otwinowski Z, Minor W (1997) Processing of X-ray diffraction data collected in oscillation mode. Methods Enzymol 276: 307–326 [DOI] [PubMed] [Google Scholar]
- Perez-Alvarado GC, Kosa JL, Louis HA, Beckerle MC, Winge DR, Summers MF (1996) Structure of the cysteine-rich intestinal protein, CRIP. J Mol Biol 257: 153–174 [DOI] [PubMed] [Google Scholar]
- Perrakis A, Morris R, Lamzin VS (1999) Automated protein model building combined with iterative structure refinement. Nat Struct Biol 6: 458–463 [DOI] [PubMed] [Google Scholar]
- Pfaff SL, Mendelsohn M, Stewart CL, Edlund T, Jessell TM (1996) Requirement for LIM homeobox gene Isl1 in motor neuron generation reveals a motor neuron-dependent step in interneuron differentiation. Cell 84: 309–320 [DOI] [PubMed] [Google Scholar]
- Ryan DP, Duncan JL, Lee C, Kuchel PW, Matthews JM (2007) Assembly of the oncogenic DNA-binding complex LMO2–Ldb1–TAL1–E12. Proteins 70: 1461–1474 [DOI] [PubMed] [Google Scholar]
- Ryan DP, Sunde M, Kwan AH-Y, Marianayagam NJ, Nancarrow AL, vanden Hoven RN, Thompson LS, Baca M, Mackay JP, Visvader JE, Matthews JM (2006) Identification of the key LMO2-binding determinants on Ldb1. J Mol Biol 359: 66–75 [DOI] [PubMed] [Google Scholar]
- Sharma K, Sheng HZ, Lettieri K, Li H, Karavanov A, Potter S, Westphal H, Pfaff SL (1998) LIM homeodomain factors Lhx3 and Lhx4 assign subtype identities for motor neurons. Cell 95: 817–828 [DOI] [PubMed] [Google Scholar]
- Terwilliger TC (2000) Maximum-likelihood density modification. Acta Crystallogr D Biol Crystallogr 56: 965–972 [DOI] [PMC free article] [PubMed] [Google Scholar]
- Terwilliger TC, Berendzen J (1999) Automated MAD and MIR structure solution. Acta Crystallogr D Biol Crystallogr 55: 849–861 [DOI] [PMC free article] [PubMed] [Google Scholar]
- Thaler J, Harrison K, Sharma K, Lettieri K, Kehrl J, Pfaff SL (1999) Active suppression of interneuron programs within developing motor neurons revealed by analysis of homeodomain factor HB9. Neuron 23:675–687. [DOI] [PubMed] [Google Scholar]
- Thaler JP, Lee SK, Jurata LW, Gill GN, Pfaff SL (2002) LIM factor Lhx3 contributes to the specification of motor neuron and interneuron identity through cell-type-specific protein–protein interactions. Cell 110: 237–249 [DOI] [PubMed] [Google Scholar]
- Thor S, Thomas JB (1997) The Drosophila islet gene governs axon pathfinding and neurotransmitter identity. Neuron 18: 397–409 [DOI] [PubMed] [Google Scholar]
- Tompa P (2003) Intrinsically unstructured proteins evolve by repeat expansion. BioEssays 25: 847–855 [DOI] [PubMed] [Google Scholar]
- Ward JJ, Sodhi JS, McGuffin LJ, Buxton BF, Jones DT (2004) Prediction and functional analysis of native disorder in proteins from the three kingdoms of life. J Mol Biol 337: 635–645 [DOI] [PubMed] [Google Scholar]
- West BE, Parker GE, Savage JJ, Kiratipranon P, Toomey KS, Beach LR, Colvin SC, Sloop KW, Rhodes SJ (2004) Regulation of the follicle-stimulating hormone beta gene by the LHX3 LIM-homeodomain transcription factor. Endocrinology 145: 4866–4879 [DOI] [PubMed] [Google Scholar]
- Winn MD, Isupov MN, Murshudov GN (2001) Use of TLS parameters to model anisotropic displacements in macromolecular refinement. Acta Crystallogr Sect D Biol Crystallogr 57: 122–133 [DOI] [PubMed] [Google Scholar]
Associated Data
This section collects any data citations, data availability statements, or supplementary materials included in this article.
Supplementary Materials
Supplementary Figures