

Abstract
Mechanisms underlying epileptic activities recorded from entorhinal cortex (EC) were studied through a computational model based on review of cytoarchitectonic and neurobiological data about this structure. The purpose of this study is to describe and use this model to interpret epileptiform discharge patterns recorded in an experimental model of ictogenesis (guinea-pig isolated brain perfused with bicuculline). A macroscopic modeling approach representing synaptic interactions between cells subpopulations in the EC was chosen for its adequacy to mimic field potentials reflecting overall dynamics rising from interconnected cells populations. Therefore, intrinsic properties of neurons were not included in the modeling design. Model parameters were adjusted from an identification procedure based on quantitative comparison between real and simulated signals. For both EC deep and superficial layers, results show that the model generates very realistic signals regarding temporal dynamics, spectral features and cross-correlation values. These simulations allowed us to infer information about the evolution of synaptic transmission between principal cell and interneuronal populations and about connectivity between deep and superficial layers during the transition from background to ictal activity. In the model, this transition was obtained for increased excitation in deep versus superficial layers. Transitions between epileptiform activities (interictal spikes, fast onset activity (25Hz), ictal bursting activity) were explained by changes of parameters mainly related to GABAergic interactions. Notably, the model predicted an important role of GABAa,fast and GABAb receptor-mediated inhibition in the generation of ictal fast onset and burst activities, respectively. These findings are discussed with respect to experimental data.
Keywords: Action Potentials; physiology; Animals; Bicuculline; pharmacology; Computer Simulation; Electrophysiology; Entorhinal Cortex; physiology; Epilepsy; physiopathology; GABA Antagonists; pharmacology; Guinea Pigs; Interneurons; physiology; Models, Theoretical; Receptors, GABA-A; physiology; Receptors, GABA-B; physiology; Synaptic Transmission; physiology
Keywords: entorhinal cortex, epilepsy, field potential, computational model, synaptic transmission
Introduction
The hippocampus has been largely implicated in temporal lobe epilepsy (TLE), based on the well described alteration defined as mesial temporal sclerosis (Falconer et al., 1964; Babb, 1991; Sloviter, 1994). For the past decade, the importance of entorhinal cortex (EC) in temporal lobe epileptogenesis has been increasingly recognized. Electrophysiological studies in animal models have shown that EC is able to generate spontaneous epileptiform activity independent of hippocampal inputs (Bear and Lothman, 1993). More recently, in combined entorhinal and hippocampal slices, seizure-like activity has been generated primarily in EC and perirhinal cortex and from there, propagated to the hippocampus (Avoli et al., 2002; de Guzman et al., 2004). In patients with intractable TLE, investigations with stereotactically implanted depth electrodes have shown that seizures may originate in EC (Spencer and Spencer, 1994). More recently, analysis of coupling directionality applied to stereoelectroencephalographic signals indicated that EC could be the leader structure in the interictal/ictal transition in mesial TLE (Bartolomei et al., 2004). EC atrophy ipsilateral to the seizure focus has also been shown to be specific to mesial temporal lobe structural damage (Bartolomei et al., 2005). Neuropathologic examination of surgically resected specimens has revealed cell loss and astrogliosis in EC (Bradford, 1995; Yilmazer-Hanke et al., 2000). Overall, these experimental findings suggest that EC plays a pivotal role in the neuronal circuitry necessary for temporal lobe seizure activity. However, circuit and synaptic transmission mechanisms underlying epileptic activities recorded from this structure remain to be understood. Indeed, these mechanisms involve complex, integrated mixes of excitability of principal and inhibitory neurons, efficacy of synaptic transmission, kinetics of postsynaptic responses, synapses location, inputs timing, and circuit response induced by activation of specific pathways, among other variables.
Without neglecting difficulties inherent to any model-based approach, a way to address this complexity (at least partially) is to relate observed field potentials to neuronal and interneuronal activities through relevant computational models based on cytoarchitectonic and neurobiological knowledge about the anatomical structure under analysis. In a previous study, a physiologically-relevant macroscopic model of hippocampus was proposed (Wendling et al., 2002) and used to interpret electrophysiological patterns recorded during the transition from interictal to ictal activity in humans. Among other findings, the model predicted that fast onset ictal activity was explained by the impairment of dendritic GABAa receptors-mediated inhibition with slow kinetics.
In the present study, we use a similar modeling approach to establish a relationship between epileptic activity recorded from the EC (field potentials) and cellular mechanisms at the origin of this activity. The purpose of this study is to fully describe a computational EC model and to use this model to interpret epileptiform activities recorded in an experimental model of ictogenesis developed in the guinea-pig isolated brain by arterial perfusion of bicuculline (De Curtis et al., 1994; Librizzi and de Curtis, 2003). From realistic simulation of field potentials, we infer information about the evolution of synaptic transmission between principal cell and interneuronal populations and about connectivity between EC deep and superficial layers during the transition from background to ictal activity. Although the macroscopic approach leaves out intrinsic properties of neurons, it was motivated in this work by two considerations. First, it is adapted to interpretation of extracellular patterns of activity (field potentials recorded in the isolated brain model) and it has been used on a number of occasions to analyze how a complex neuronal circuit might produce observed electrophysiological patterns. Second, after validation in an appropriate experimental framework, such an approach could provide a unique window to understand ictogenesis in an animal model and, ultimately, to open the possibility to interpret ictal changes from intracerebral EEG signals recorded in patients with intractable partial epilepsies.
Material and Methods
1. Experimental data
Experimental data were obtained from brains of Hartley guinea pigs (150–200g, Charles River, Calco, Italy) isolated and maintained in vitro according to the standard procedure described elsewhere (de Curtis et al., 1991; Muhlethaler et al., 1993; de Curtis et al., 1998).
In brief, animals were anesthetized with sodium tiopental (125mg/Kg i.p., Farmotal, Pharmacia) and transcardially perfused with a cold (4–10°C) oxigenated (95% O2, 5% CO2) complex saline solution composed of 126 mM NaCl, 3 mM KCl, 1.2 mM KH2PO4, 1.3 mM MgSO4, 2.4 mM CaCl2, 26 mM NaHCO3, 15 mM glucose, 2.1 mM HEPES and 3% dextran M. W. 70000 (pH=7.1). Brains were rapidly dissected out and transferred in the recording chamber where they were perfused through the basilar artery with the same solution (5.5ml/min, pH=7.3, 15°C). Experiments were performed at 32°C after gradually raising the temperature with 0.2°C/min steps.
Extracellular recordings were performed simultaneously in deep and superficial layers of the EC with 16-channels silicon probes (100 μm contact separation, provided by Jamille Hetcke, CNCT, University of Michigan, Ann Arbour, MI) inserted perpendicularly to EC lamination. Focal epileptiform discharges in the limbic region were induced by 3–5 minutes arterial applications of the GABAa receptor antagonist, bicuculline (50 μM; SIGMA) diluted in the perfusion solution (Librizzi and de Curtis, 2003).
The viability of the isolated brains was tested by recording the responses evoked in the limbic cortices by stimulating the lateral olfactory tract (LOT; see (Biella and de Curtis, 2000; Gnatkovsky et al., 2004; Uva and de Curtis, 2005) through a Grass isolation unit driven by a Grass S88 pulse generator (Warwick, RI, USA). Stimulating and recording electrodes were positioned under direct visual control with a stereoscopic microscope. At the end of the electrophysiological experiments, electrolytic lesion were made by passing a 30μA current for 30 seconds between the two deepest contacts of the silicon probe. Brains were then fixed in paraformaldehyde 4% for one week and cut at vibratome in 75–100μm thick coronal sections to verify the position of the electrodes. The experimental protocol was reviewed and approved by the Committee on Animal Care and Use and by Ethics Committee of the Istituto Nazionale Neurologico.
Typical seizure activity (Uva et al., 2005) was recorded in 10 isolated brains. The transition pattern from interictal to seizure-like activity recorded simultaneously from superficial and deep layers of the EC in an isolated guinea-pig brain is displayed in figure 1. It includes four successive phases defined by typical and reproducible electrophysiological features. The first phase corresponds to normal background activity. After injection of bicuculline, sporadic spikes appear, and become more frequent before seizure begins. This second phase is defined as the pre-ictal phase. At seizure onset, a fast rhythmic activity centered around 25 Hz and defined in the sequel as “fast onset activity” is consistently observed. Then, as seizure develops, the fast onset activity is gradually substituted by ictal burst activity (observed in 6 over 10 experiments) sometimes referred to as “afterdischarges”. During this last phase, the recurrence of bursts progressively decreases before seizure termination.
Figure 1.
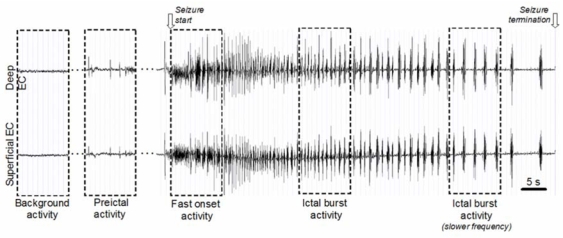
Real field potentials recorded from deep and superficial layers of the medial EC of the in vitro isolated guinea pig brain during a typical seizure pattern. Four phases (background, pre-ictal, fast onset and ictal burst activity) were chosen for model parameter identification.
This animal model has been chosen as experimental framework to validate our computational model because interictal to ictal transition pattern observed in this model well replicates the pattern observed in patients with TLE. Furthermore, solid experimental findings on the interictal to ictal transition pattern have been obtained with this model (Librizzi and de Curtis, 2003; Uva et al., 2005) while preliminary observations suggest that patterns observed with other acute models (4-aminopyridine, pilocarpine or high potassium) are different.
2. The model
The model design started from data about neuronal organization and connectivity of the EC. Intrinsic properties of EC neurons as persistent Na+ conductance, h-current, etc. (Magistretti and Alonso, 1999; Dickson et al., 2000b; Agrawal et al., 2001; Magistretti and Alonso, 2002) were not taken into consideration in our macroscopic modeling approach that essentially represents postsynaptic interactions between subpopulations of cells, which are the main contributors to measured field potentials. Main features obtained from literature review are illustrated in figure 2 and summarized in the sequel.
Figure 2.
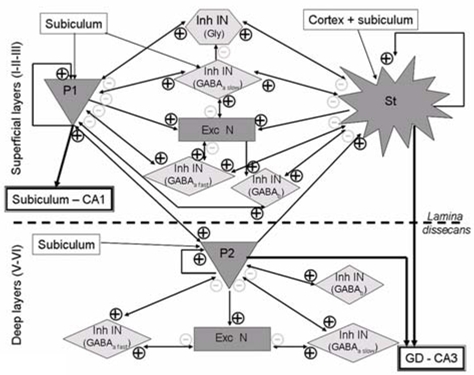
Schematic representation of synaptic interactions between principal neurons and interneurons (excitatory and inhibitory) present in deep and superficial layers of the EC. This representation was obtained from literature review and is the starting point in the EC model design. P1, P2: pyramidal cells. St: stellate cells. Exc: excitatory (Glutamate). Inh: inhibitory (receptor type on target cells is indicated between brackets). IN: interneurons. N: Neurons.
2.1. Cellular organization of entorhinal cortex
In this work, we referred to Lorente de No’s classification (1933) which considers the EC as a six-layered cortical structure corresponding to “area enthorinalis” proposed by Brodmann (1909). According with anatomical descriptions (Insausti et al., 1997; Wouterlood, 2002), we subdivide EC in “superficial layers”, that are superficial to lamina dissecans (layer IV) and “deep layers”, between lamina dissecans and the white matter. All following description of cytology and network connectivity of the EC when not explicitly mentioned is from rat entorhinal cortex studies.
a. Principal excitatory neurons
Two types of principal neurons have been distinguished in the EC: pyramidal cells localized in superficial layers (mainly in layer III) and deep layer (mainly layer V) and stellate cells in superficial layers (mainly layer II) (Insausti et al., 1997; Klink and Alonso, 1997; Mikkonen et al., 1997; Dolorfo and Amaral, 1998a, 1998b; Hamam et al., 2000; Hamam et al., 2002; Wouterlood et al., 2002).
As suggested by anatomical studies, pyramidal neurons in superficial layers receive afferent inputs from deep pyramidal neurons (Gloveli et al., 1997; Dolorfo and Amaral, 1998b; Kloosterman et al., 2003) and in turn, project back to these ones (Wouterlood et al., 2002). Furthermore, pyramidal neurons in deep layers send collateral axons to stellate cells (Gloveli et al., 2001; van Haeften et al., 2003). In variance with connectivity in neocortex (Thomson and Bannister, 2003), interconnections between deep and superficial EC layers are entirely sustained by principal excitatory neurons. This particularity could be due to the nature of the EC, which is a subdivision of paleocortex.
b. Interneurons and non principal cells
Inhibitory GABA interneurons have been identified in all layers of the EC (Miettinen et al., 1996). This finding has been confirmed in the human EC with identification of GABAergic interneurons named basket cells (Mikkonen et al., 1997). In further works (Wouterlood and Pothuizen, 2000; Wouterlood et al., 2000), GABA negative interneurons have also been observed. Authors suggested that this second class corresponded to excitatory non principal neurons.
A recent whole-cell patch-clamp study has shown that two kinetically distinct spontaneous inhibitory synaptic currents (IPSC) (fast or slow rise and decay times) could be recorded from EC inhibitory interneurons (layers II and V) (Woodhall et al., 2004). They appeared to be entirely mediated by GABAa receptors, as they were abolished by gabazine. Based on functional studies supporting the existence of subtypes of GABAa receptors with differing kinetics, spatially segregated on the same neuron (Banks and Pearce, 2000; Banks et al., 2000), it has been suggested that these IPSC with different kinetics could result from activation of different subtypes of GABAa receptors (fast and slow), possibly post-synaptic to subpopulations of EC GABA interneurons (Woodhall et al., 2004). According with this assumption, spatially segregated synapses (axo-somatic and axo-dendritic) from inhibitory interneurons to pyramidal and stellate cells have been identified (Wouterlood et al., 1995; Wouterlood and Pothuizen, 2000; Wouterlood et al., 2002). Taken together, these observations suggest that dendritic inhibition would involve mainly GABAa slow receptors while somatic inhibition would involve mainly GABAa fast ones (Banks and Pearce, 2000; Banks et al., 2000).
Furthermore, GABAergic inhibition involving GABAb receptors has also been identified in EC (Fountain et al., 1998; Funahashi and Stewart, 1998). This finding has been confirmed in human EC (Mizukami et al., 2002).
The origin of these slow GABAa and GABAb responses have been identified in neocortex (Tamas et al., 2003) and more recently in hippocampus (Price et al., 2005) within a inhibitory network of neurogliaform neurons. This novel interneuronal network appears well suited for modulating the flow of information between the entorhinal cortex and CA1 hippocampus.
As suggested by several anatomical and electrophysiological studies (Jones and Buhl, 1993; Wouterlood, 2002; Woodhall et al., 2004), each of these GABA interneuron classes receives afferent excitatory inputs presumably from stellate and pyramidal neurons as well as excitatory non principal cells in superficial layers and from pyramidal neurons as well as excitatory non principal cells in deep layers.
Similarly, excitatory non principal cells receive afferent excitatory inputs from stellate and pyramidal neurons in superficial layers and from pyramidal neurons in deep layers. Moreover, excitatory non principal cells also receive inhibitory feedback from GABA interneurons via GABAa (slow and fast) receptors (Wouterlood and Pothuizen, 2000; Wouterlood et al., 2000; Wouterlood, 2002).
Finally, pharmacological study (Kirchner et al., 2003) has demonstrated the effect of different glycine agonist – antagonist drugs on epileptiform activities recorded from EC superficial layers neurons. In a further work (Breustedt et al., 2004), glycine receptors have been identified on these neurons and a cross inhibition of glycine responses by GABA via GABAa slow receptors has been shown.
c. Extra-entorhinal inputs
An important input of EC comes from hippocampus and more precisely, from pre- and para-subiculum (Caballero-Bleda and Witter, 1994) as well as from CA1 (Tamamaki and Nojyo, 1995; van Haeften et al., 1997; Wouterlood et al., 2004; Craig and Commins, 2005). This input is mainly excitatory. Target neurons of subicular fibres are mainly pyramidal (deep and superficial) and stellate cells, and a projection from subiculum to GABA interneurons in superficial layers has also been observed (Wouterlood, 2002). More recently, a connection between presubiculum fibres and dendrites of pyramidal neurons of entorhinal layer V has also been demonstrated (Wouterlood et al., 2004).
In addition to the hippocampal input, EC receives another input from neocortex and olfactory cortex (Wouterlood, 2002) and from subcortical structures (Pikkarainen et al., 1999; Wouterlood, 2002). These cortical afferences project to superficial layer cells.
d. Entorhinal outputs
Anatomical studies in various mammalian species, including the rat, demonstrated that stellate cells in superficial layer II give rise to the perforant pathway, projecting to dentate gyrus and CA3/CA2 hippocampal fields (Witter et al., 1989a; Gloveli et al., 2001; Wouterlood et al., 2002; van Haeften et al., 2003). A second contribution to the perforant pathway comes from pyramidal cells in deep layers (Gloveli et al., 2001; van Haeften et al., 2003). Additionally, pyramidal neurons in superficial layers (mainly layer III) send their axons predominantly to hippocampal field CA1 and the subiculum, bearing the second output pathway from EC: the temporo-ammonic pathway (Wyss, 1981; Witter et al., 1989b; Wouterlood, 2002).
2.2. Computational model of entorhinal cortex extracellular activity
In order to interpret signals recorded from the EC during the transition from interictal to ictal activity in the experimental model of isolated brain (next paragraph), we designed a computational model of synaptic interactions between subpopulations of cells present in the EC, based on the above description. A macroscopic modeling approach (neuronal population level) was chosen because this level of modeling allows simulation of signals that can be directly compared to real signals (field potentials reflect overall dynamics rising from interconnected populations of principal neurons and interneurons). This approach was described theoretically by Wilson and Cowan (Wilson and Cowan, 1972) and first used by Freeman (Freeman, 1978) and Lopes da Silva (Lopes da Silva et al., 1974; Lopes da Silva et al., 1976) for electrophysiological data interpretation. More recently, this class of models was exploited in various neurophysiological or clinical studies. Jansen et al. (Jansen BH, 1993; Jansen BH, 1995) proposed a lumped-parameter model of the visual cortex to study the generation of evoked potentials (1995). Wendling et al (Wendling et al., 2000; Wendling et al., 2002) elaborated a model for the hippocampus. From comparison between simulated and real intracerebral signals recorded in human TLE, hypotheses were generated about the evolution of excitation, slow dendritic inhibition and fast somatic inhibition in hippocampal circuits during the transition from interictal to ictal activity. Suffczynski et al. (Suffczynski et al., 2004) investigated the mechanisms of transition between normal EEG activity and epileptiform paroxysmal activity using a computational macroscopic model of thalamocortical circuits. Bojak and Liley (Bojak and Liley, 2005) also proposed a model of the same type for cortical activity and simulated realistic EEG signals in response to specific and quantifiable physiological changes related to different anesthetic agents.
Generally speaking, in this class of model, a population of cells is considered. This population is composed by different subpopulations of cells (typically principal cells and interneurons) which interact via synaptic connections. At each subpopulation, a pulse-to-wave function transforms the average presynaptic pulse density of afferent action potentials (input) into an average postsynaptic membrane potential (output) whereas a wave-to-pulse function relates the average postsynaptic potential to an average pulse density of potentials fired by the neurons. The pulse-to-wave function is generally represented by a 2nd order linear transfer function impulse response:
| (eq. 1) |
where W is the amplitude of the average receptor-mediated postsynaptic potential (denoted as in the excitatory case and as in the inhibitory case) and where τ represents the decay time constant of this postsynaptic potential (PSP). According to the description above, excitatory PSP is mediated by glutamate while inhibitory PSP are mediated by GABA or Glycine (see the two following sections). GABA is considered as being exclusively inhibitory in our model. Although a depolarizing effect of GABA via GABAa receptors has been demonstrated (Cohen et al., 2002; Cohen et al., 2003; Cossart et al., 2005) this effect was shown in subicular cells and in immature neurons (Avoli et al., 2005). Since our objective is to use the model to interpret epileptiform activities in an acute experimental model obtained in adult animals, we chose to only consider hyperpolarizing (inhibitory) effect of GABA. The wave-to-pulse function is modeled by a static nonlinear function of sigmoid shape , where 2e0 is the maximum firing rate, v0 is the post-synaptic potential corresponding to a firing rate of e0 and r is the steepness of the sigmoid.
Interactions between neuronal and interneuronal subsets are represented in the model by connectivity constants which account for the average number of synaptic contacts.
The non specific influence from neighboring or distant populations is represented by a Gaussian input noise corresponding to an excitatory input p(t) that globally describes the average density of afferent action potentials.
One model output corresponds to the postsynaptic activity of principal neurons (summated postsynaptic potentials) and can be interpreted as a field potential. Others possible model outputs correspond to the postsynaptic activity of subpopulations, allowing to assess the participation of each cellular type in the observed field activity.
Finally, model equations are derived from functions h(t) (eq. 1) which introduce a pair of first order ordinary differential equations of the form :
where x(t) and z(t) are the respective input (afferent pulse density) and output (average postsynaptic membrane potential) signals. For a given model, the set of first order nonlinear ordinary differential equations (ODEs) obtained for all synaptic interactions present in the model is numerically solved to simulate signals.
Following these above general principles and according to the detailed description reported in the previous section, we established a model for the EC. The model consists in two interconnected parts corresponding respectively to the EC superficial and deep layers.
a. Superficial EC model
As shown in the figure 1, for superficial layers, the model consists in seven subsets of neurons corresponding to two subpopulations of main cells (pyramidal – P1- and stellate - St -neurons), one population of excitatory non principal cells targeting glutamatergic receptors and four subpopulations of interneurons (inhibitory interneurons targeting GABAa,slow, GABAa,fast, GABAb and glycine receptors). Consequently, for each type of synaptic interaction, equation 1 turns into
with t ≥ 0 and where denotes the amplitude of the average excitatory glutamate-mediated postsynaptic potential, denotes the amplitude of the average inhibitory postsynaptic potential mediated by receptors of type i and where τj represents the corresponding decay time constant. According to previous work (Wendling et al., 2002), the time constant value τ1 = 10 ms for the average excitatory postsynaptic potential corresponds to an average value of NMDA and AMPA receptor-mediated current decay times. For GABAergic IPSPs, the faster time constant τ3 was set to 5 ms, i.e. lower than the slower time constant τ2 set to 30 ms consistently with (Traub et al., 1999; White et al., 2000). Based on GABAb current recordings with whole-cell patch-clamp technique (Otis et al., 1993), the value of τ4 was set to 300 ms, corresponding to the average of the two inactivation time constants identified in this study. Finally, for glycine inhibitory postsynaptic potentials represented in the model, we used a value τ5 set to 27 ms corresponding to a weighted mean time constant as described in Lewis et al (Lewis et al., 2003). These values are summarized in table 1.
Table 1.
Amplitude of average post-synaptic potentials (initial values for which normal background activity is simulated) and decay time constants used in the model
| DEEP | SUPERFICIAL | ||
|---|---|---|---|
| Average amplitude (mV) | Average amplitude (mV) | Decay time (ms) | |
| Excitatory PSP (Glutamate) | τ1 = 10 | ||
| Inhibitory PSP (GABAa,slow) | τ2 = 30 | ||
| Inhibitory PSP (GABAa,fast) | τ3 = 4 | ||
| Inhibitory PSP (GABAb) | τ4 = 300 | ||
| Inhibitory PSP (Glycine) | Not present | τ5 = 27 |
Interactions between main cells, excitatory non principal cells and interneurons are represented in the model by 28 connectivity constants where x and y respectively denote the source and the target subpopulation. Since no information about the number of synaptic contacts between different classes of main cells and interneurons was available for the EC, we used the same range of values (20–50) than that used in Traub’s hippocampus model (Traub et al., 1999). Because our objective was to simulate epileptiform activities and to be consistent with increased recurrent excitation observed in epileptic tissues (Morimoto et al., 2004), we increased the number of synaptic contacts between pyramidal neurons and between stellate neurons (n = 160). Furthermore, as described by Banks (Banks and Pearce, 2000), the spatial location of GABAergic receptors depends on their type (GABAa, slow receptors are distributed along the dendrites whereas GABAa, fast receptors are located in the perisomatic region of pyramidal cells). Hence, we introduced an unbalance in the connectivity between GABAa, slow/ GABa,fast interneurons and main cells assuming a higher number of synaptic contacts between GABAa, slow interneurons and main cells. Connectivity constant values are given in table 2.
Table 2.
Local connectivity constants in superficial EC model
| y | P1 | St | INexc | INGABAa,s | INGABAa,f | INGABAb | INGly |
|---|---|---|---|---|---|---|---|
| x | |||||||
| P1 | 160 | - | 50 | 50 | 50 | 50 | 30 |
| St | - | 160 | 50 | 50 | 50 | 50 | 50 |
| IN exc | - | - | - | 20 | 20 | 20 | - |
| INGABAa,s | 35 | 35 | 20 | - | - | - | 10 |
| INGABAa,f | 25 | 25 | 20 | - | - | - | - |
| INGABAb | 15 | 15 | - | - | - | - | - |
| INGly | 35 | 35 | - | - | - | - | - |
Finally, an excitatory input representing non specific afferences from neighboring or distant populations was attributed to each one of the two main neuronal subpopulations (Gaussian input noisespP1(t) and pSt(t)).
The model output corresponds to the summated postsynaptic activities of both pyramidal and stellate cells.
b. Deep EC model
As shown in figure 1, the model is composed of 5 subsets of neurons, namely the main cells (pyramidal neurons -P2-), excitatory non principal cells and 3 interneuronal subpopulations. In a similar way as described above, excitatory, slow and fast inhibitory GABAa and inhibitory GABAb postsynaptic membrane potentials are obtained from impulse responses h1(t), h2(t), h3(t) and h4t), respectively. Non specific influence from other areas is represented by a Gaussian input noise pP2(t). Synaptic contacts between interconnected subpopulations (average number) are represented by 14 connectivity constants (see table 3). For EC deep layers, model output corresponds to the sum of postsynaptic activities of pyramidal cells.
Table 3.
Local connectivity constants in deep EC model
| y | P2 | IN exc | IN GABAa,s | IN GABAa,f | IN GABAb |
|---|---|---|---|---|---|
| x | |||||
| P2 | 160 | 50 | 50 | 50 | 50 |
| IN exc | - | - | 20 | 20 | 20 |
| IN GABAa,s | 35 | 20 | - | - | - |
| IN GABAa,f | 25 | 20 | - | - | - |
| IN GABAb | 15 | - | - | - | - |
c. Global EC model
The global EC model was obtained by interconnecting the superficial and deep EC models described above. According to the description given in section 1, pyramidal neurons P2 (deep EC model) project to both pyramidal neurons P1 and stellate neurons (superficial EC model). In turn, pyramidal neurons P1 project back to pyramidal neurons P2. Hence, three inter-layer connectivity constants ( ) were introduced to account for the average number of synaptic contacts between these three subpopulations of cells. Regarding these three parameters, the difficulty is that connectivity between deep and superficial layers in the EC is poorly described in the literature. Nevertheless, for deep to superficial connections, we assumed equal values for parameters in accordance to the recent stereological study of van Haeften (van Haeften et al., 2003). Parameters were identified by comparison between simulated and real signals using cross correlation analysis (see section 4, Model parameter identification procedure).
According to a previous work (Wendling et al., 2002), the mean and variance of gaussian noises in the model were adjusted to obtain a rate ranging from 30 to 150 pulses per second.
Finally, regarding numerical simulation details, the whole EC model is governed by a set of 42 first order nonlinear differential equations. For numerical integration, we used a fixed step Euler method that accounts for stochastic ODEs (each subpopulation of main cells has an input noise p(t)) To give an idea of the computation time, the generation of a 10 second period of EC activity requires a few seconds on a standard PC-type computer.
3. Identification procedure of model parameters
In order to get insight into synaptic interactions involved in the generation of observed signals during the transition to bicuculline-induced seizures, a qualitative and quantitative identification procedure was designed to study the sensitivity of model parameters and used to determine the necessary conditions to reproduce, in the model, real field potentials recorded during the four phases described above. This procedure is summarized in figure 3. It consisted in iteratively tuning model parameters in order to obtain realistic simulated activities that mimicked the experimental data. Only eight parameters were modified during this procedure: amplitudes of average excitatory and inhibitory postsynaptic potentials ( and. parameters) in deep and superficial EC models and connectivity between deep and superficial layers. In order to reduce the combinatorics of the identification procedure, we introduced two constraints in determining these parameters: i) we assumed values for parameters in deep and superficial models to be the same (the effect of systemic perfusion of bicuculline can reasonably be assumed to be equivalent in deep and superficial layers) and ii) we kept identical values for parameters and as justified above. All other parameters (local connectivity and decay time constants) were kept unchanged for all simulations (see values in table 1, 2 and 3).
Figure 3.
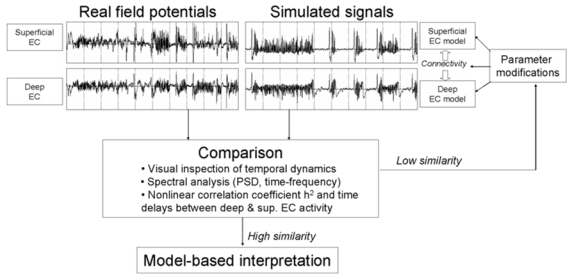
Synthetic representation of the identification procedure of model parameter values.
Realism of simulated activities was assessed by comparison of simulated signals to real field potentials. This comparison included temporal dynamics (visual inspection) and spectral features obtained by computing the power spectral density (periodogram method) and a time frequency representation (spectrogram method) of real and simulated activity. We also analyzed the cross correlation between deep and superficial EC activity using nonlinear regression analysis. Readers may refer to (Pijn, 1993) for detailed description of this technique. This analysis provided a way to determine values for inter-layer connectivity constants by comparing cross correlation values measured on real and simulated signals. In brief, this technique was introduced in the field of EEG analysis by Lopes da Silva and colleagues (Lopes da Silva et al., 1989). Evaluated in a model of coupled neuronal populations (Wendling et al., 2001), it was recently used on human intracerebral recordings to identify epileptogenic networks in TLE (Bartolomei et al., 2004). Nonlinear regression analysis is aimed at quantifying the degree of correlation between activities generated in two different sites. A fixed duration sliding window is used, over which a parameter (nonlinear correlation coefficient h2, ranging from 0 to 1) is computed. Low values of h2 denote that analyzed signals are independent. On the opposite, high values of h2 mean that one signal may be explained by a transformation (possibly nonlinear) of the other (i.e. both signals are dependent).
Results
As described in the following, for each of the four periods chosen during the transition from background to ictal activity, the model produced strikingly realistic signal dynamics and transitions when compared to those reflected in real field potential recordings for appropriate modifications of average post-synaptic potential parameters detailed below. Results also show that the model offers the possibility to decompose global mean field potentials into its main excitatory and inhibitory postsynaptic components originating from neuronal and interneuronal populations.
1. From background to pre-ictal activity
We first verified whether the model generates realistic background activity compared to real field potentials for initial conditions (see values in table 1). As shown in figure 4-A, this activity mainly includes theta (3–7 Hz) and alpha (8–12 Hz) frequency components as observed in the real signals from deep and superficial layers of the EC. Before the beginning of seizure (pre-ictal activity), sporadic spikes mixed with background activity could be observed in real recordings (Figure 4B, left). In the model, this electrophysiological pattern could be obtained exclusively when the value of parameter in the deep EC model was at least twice higher than that in the superficial EC model (Figure 4-B, right). In the opposite condition, pre-ictal activity (and other epileptiform activities) was never simulated. Additional necessary conditions to reproduce pre-ictal activity was to decrease parameter and values (−43%) as well as value ((−30%). At this point, for fixed parameter values, the occurrence times of spikes were random. Then, for further gradual decrease of and parameters, spike frequency increased and spikes became biphasic just before fast onset activity, as also observed in real experimental recordings (asterisks in Figure 4-B).
Figure 4.
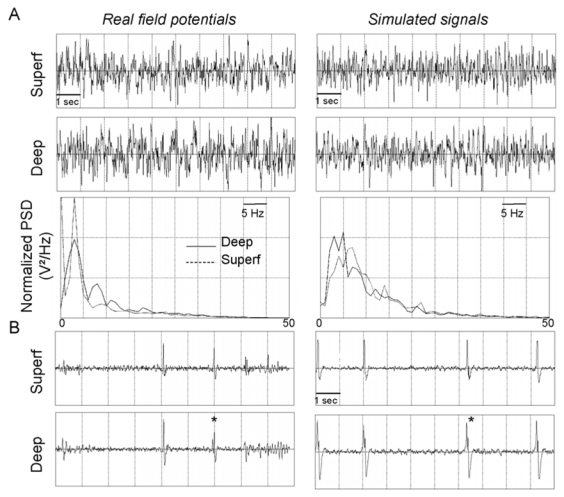
Comparison between real field potentials and simulated signals from deep and superficial (superf) layers for the background activity (A) and pre-ictal activity (B). Diphasic spikes are marked with an asterisk in real recording. Simulated signals displayed in the figure correspond to a set of parameters leading the model to produce biphasic spikes. This set of parameters corresponds to a sufficiently large decrease of and parameters with respect to previous values. The model can also reproduce monophasic epileptiform spikes similar to those recorded (example of spike without asterisk) for a lower decrease of and parameters.
2. From pre-ictal to fast onset activity
In the model, fast onset activity with features similar to those observed in the real field potential was obtained for a very low value of parameter (initial value divided by 10) and a re-increase of parameter value (+43 %). An additional condition was a new decrease of parameter ((−21%). As shown in figure 5-A, spectral and time-frequency analysis revealed that both real and simulated signals reflect a narrow band activity (around 25 Hz) disrupted by short periods where a “flattening” followed by a spike/fast activity sequence is observed. These results were obtained with inter-layer connectivity constants identified from comparison of the crosscorrelation values measured by the nonlinear correlation coefficient h2 between deep and superficial layer activity in real and simulated signals. Moreover, in real experiments, the most striking feature is a dramatic increase of h2 values from background (0.09 +/− 0.02) and to fast onset activity (0.59 +/− 0.11). In the model, this augmentation was also observed and similar average h2 values were obtained on simulated background (0.07 +/− 0.04) and fast onset (0.57+/− 0.07) activities, for unchanged inter-layer connectivity constants (figures 6-A and 6-B).
Figure 5.
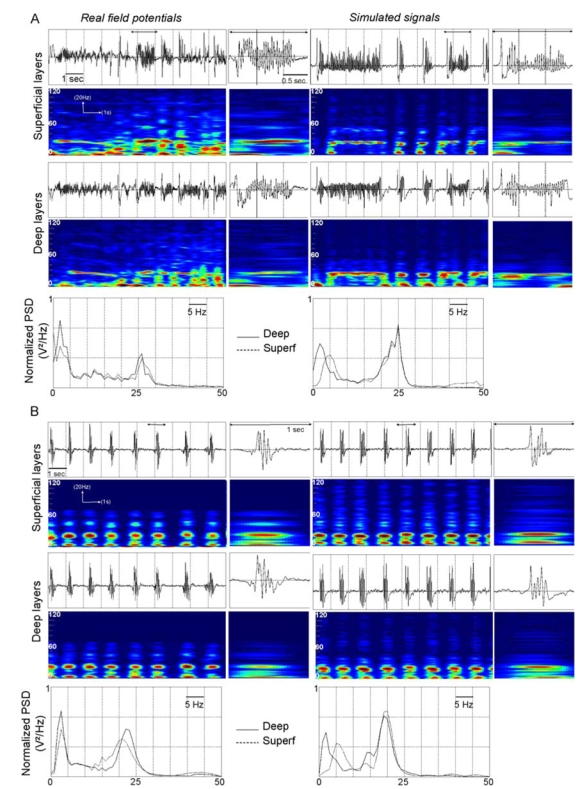
Comparison between real field potentials (right) and simulated signals (left) from deep and superficial layers of the EC. For fast onset activity (A) and ictal burst activity (B), time-frequency representations (spectrograms in which red and blue colors respectively denote high and low energy values at a given time-frequency point) and power spectral densities show that real and simulated signals exhibit similar spectral content. In each case, signals are displayed over a period of 10 seconds. A zoom in a shorter period (1.5 sec and 1 sec, double arrow) is provided to appreciate realism of temporal dynamics of simulated activity compared to real ones. The drop in frequency between fast onset and ictal burst activity is reproduced by the model.
Figure 6.
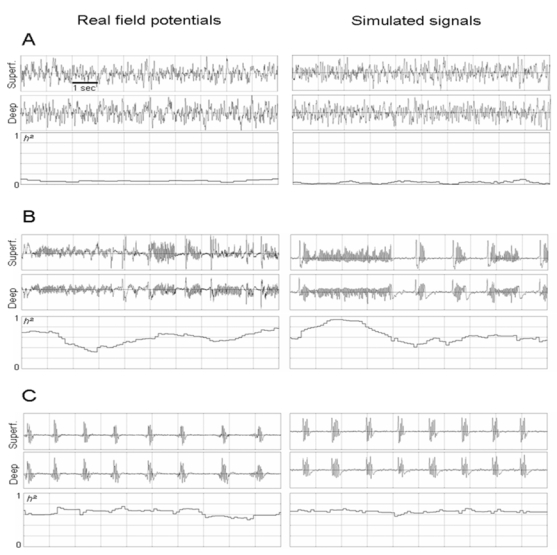
Nonlinear correlation coefficient (h2) measured on real field potentials and simulated signals from deep and superficial layers for background (A), fast onset activity (B) and ictal burst activity (C).
3. From fast onset to ictal burst activity
In most experiments, the duration of fast onset activity ranged from 6 to 10 seconds. Then, the ictal electrophysiological pattern typically evolved into bursts of fast activity that occur rhythmically and simultaneously in deep and superficial layers, also described as afterdischarges. The evolution towards this burst activity was primarily obtained in the model by reincreasing up to 23% of the initial value (set for background activity). This parameter change can be interpreted in the model as an augmentation of GABAergic inhibition efficacy (reduction of the number of blocked GABAa,slow receptors). For this new set of parameters, we observed realistic values of burst frequency (around 23 Hz), burst duration (from 200 to 400 ms) and interburst interval (about 1 second). As depicted in time-series and time-frequency representations shown in figure 5-B, the model produced very realistic ictal burst activity. In both real and simulated signals, bursts occur simultaneously in superficial and deep layers. Another important point is that the model generated spontaneous bursting activity with a recurrence rate compatible to that observed in experimental data for constant values of parameters over this period. Moreover, as displayed in figure 6-C, during bursting activity, we obtained comparable h2 values (real: 0.63+/− 0.05, simulations: 0.64+/−0.04). Here again, changes of inter-layer connectivity constants were not required to obtain realistic h2 values.
4. Late decrease of ictal bursts and seizure termination
As observed in real recordings during ictal activity, the interval between bursts progressively extends whilst the frequency of burst activity remains constant (around 23 Hz). This effect was reproduced in the model by progressively increasing parameter with respect to previous value (up to + 45%). Figure 7 provides the evolution of the interburst interval duration during the ictal period for simulated and real signals. Interval duration between two successive bursts was measured as the time separating their respective onset obtained from an automatic detection procedure. It can be observed that the model is able to accurately reproduce the progressive lengthening of the interburst interval for the aforementioned progressive increase of GABAb inhibition efficiency.
Figure 7.
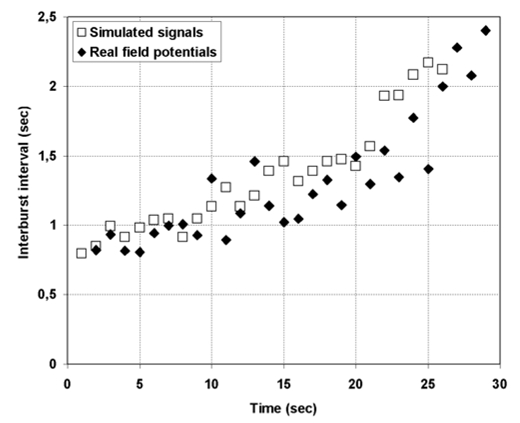
Comparison of the interburst interval measured during real and simulated ictal activity. In the simulation, lengthening of interval duration is obtained when inhibition mediated by GABAb receptors (parameter ) increases with time according to the curve given in figure 8.
From visual inspection, it is usually observed that the occurrence rate of bursts decreases until seizure termination. In the model, this seizure termination is obtained for a further increase of parameter (+25%) and (+33%).
To summarize the evolution of average post-synaptic potentials detailed above we plotted the values of corresponding parameters as a function of the analyzed phases (from background activity to seizure termination; Figure 8).
Figure 8.

Time-course of parameter values identified during the transition from background to seizure termination. Left part: amplitude of average excitatory and inhibitory post-synaptic potentials; right part: inter-layer connectivity constants.
5. Activities from each neuronal and interneuronal subpopulation
In the model, simulated mean field potentials are obtained from the summation at the main cells of average postsynaptic activity generated by local subpopulations of cells. Thus the model offers the possibility to investigate the temporal dynamics of simulated activities as a function of the temporal dynamics of postsynaptic components. An illustrative example is given in the figure 9 for ictal burst activity. Postsynaptic activities rising from excitatory and inhibitory subpopulations of cells start simultaneously but their time-course depends on receptor kinetics. Fast oscillations are explained by GABAa,fast inhibition, suggesting a important role of inhibitory interneurons projecting to the soma of principal neurons. Burst recurrence is controlled by inhibition mediated by GABAb receptors: beyond a threshold value, inhibition overcomes excitation and burst activity stops. The long time constant of this inhibitory activity explains the fact that no new burst can occur before a certain time (around 1 sec). One may also notice that the different time-course of post-synaptic potentials in deep and surface layers is explained by glycine-mediated inhibition, which is only present in superficial EC model. Even if this parameter remains unchanged in the model, the decrease of unmasks the influence of the parameter in the model, due to the cross-inhibition of glycine-mediated inhibition by GABA via GABAa,slow receptors. Consequently, as observed in superficial but not in deep layers (figure 9), there is a magnitude modulation of glutamate-, GABAa,slow and GABAa,fast receptors mediated-post synaptic potentials. When reaches a threshold value, there is a transient decrease of these post synaptic potentials.
Figure 9.
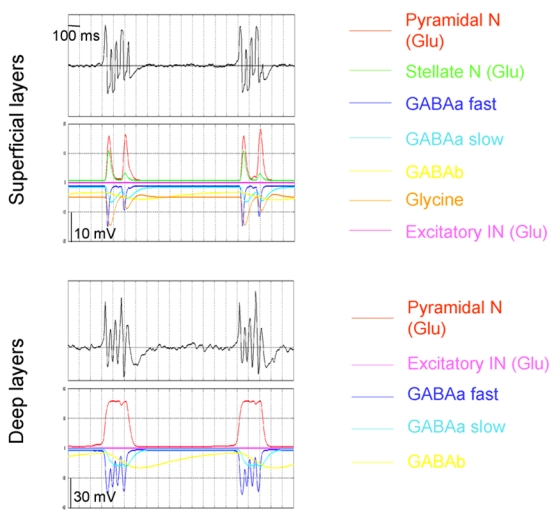
Decomposition of the simulated field potential as a function of its inhibitory and excitatory postsynaptic components. See text (Results section, §5) for details.
Discussion
Field potentials reflect either activities that diffuse across the cortical depth or locally generated events. We demonstrated that cortical layers represented by two groups in our EC model generate signals that are quantitatively comparable to real field potentials recorded from EC deep and superficial layers in terms of temporal dynamics, spectral features and crosscorrelation values. The findings derived by the analysis of the parameters of the model for which those realistic simulations were obtained, are summarized below. In the model, the transition towards epileptic activity is obtained for increased excitation in deep versus superficial layers of the EC. This model prediction corroborates results reported in several studies. Patch-clamp experiment (Berretta and Jones, 1996) showed that neurons exhibit larger amplitude spontaneous excitatory postsynaptic currents in deep than in superficial layers. A more recent study (Woodhall et al., 2004) also revealed that the overall level of background inhibition is higher in superficial than in deep EC layers. Furthermore, these differences in excitability between deep and superficial layers are strongly supported by several evidences that inhibitory neurons and terminals are more heavily concentrated in superficial layers in comparison to deep layers (Jones and Buhl, 1993; Wouterlood et al., 1995; Miettinen et al., 1996; Wouterlood et al., 2000).
Transitions between different phases of the interictal-to-ictal activity (background to pre-ictal, pre-ictal to fast onset activity, fast onset to ictal burst activity and from ictal burst activity to seizure termination) were obtained in the model by modifying of a small number of parameters only. In this study, qualitative and quantitative procedures, respectively based on visual inspection and signal analysis techniques, were used to compare simulated signals to real field potentials. Results from this semi-quantitative model parameter exploration showed that i) small variations around identified parameter values led to slight modifications of the temporal dynamics of simulated signals ii) only larger and specific variations of parameters could lead the model to reproduce realistic transitions in these dynamics, as reported. Even if we did not prove it formally, these results tend to show that observed transitions of activity can only be explained by a reduced number of solutions in the model (parameter-changes with respect to time). In the model, parameters modified in order to simulate realistic epileptiform activities are mainly related to GABAergic synaptic interactions between subpopulations of cells (excepted the twice higher value of parameter in the deep compared to superficial EC model). Indeed, the only increase of parameter did not allow the model to simulate realistic epileptiform activities, the decrease of GABAergic synaptic interactions being a necessary condition to obtain satisfactory matching between real and simulated signals.
In the model, the drop of GABAa, (slow and fast) and GABAb receptors-mediated inhibition led to the transition from background to pre-ictal activity. For intermediate values, these parameters also controlled the frequency of transient epileptic spikes mixed to background activity, explaining the variability of electrophysiological patterns during this phase. For GABAa receptors, this finding is consistent with the bicuculline effect (antagonist) in the isolated guinea-pig brain preparation. For GABAb inhibition, a transitory decrease in the involved potassium conductance is expected at seizure onset. The GABAb transmission is mediated by a potassium conductance and therefore, can be modulated by changes in extracellular potassium concentration (Gahwiler and Brown, 1985). Several reports demonstrated that during both ictal discharges and interictal spiking, extracellular potassium concentration increases rapidly (Jefferys, 1995; de Curtis et al., 1998). The enhancement of potassium in the extracellular space decreases the driving force of transmembrane potassium conductances and, therefore, also affects GABAb-mediated potentials. The extracellular potassium rise during the pre-ictal state and just or ahead of seizure onset may induce a transitory decrease in GABAb-mediated potassium conductance that promotes the further development of seizure-like discharges.
Then, in the model, fast onset activity (around 25Hz) was obtained for a re-increase of the GABAa,fast receptor-mediated inhibition. This fast activity is only obtained when the level of GABAa,slow receptor-mediated inhibition and GABAb receptor-mediated inhibition (in a lesser extent) are still low. This result might be interpreted in two ways. First, it might be consistent with the findings of Kapur (Kapur et al., 1997) who reported that bicuculline primarily acts on GABAa,slow receptors and in a lesser extent, on GABAa,fast receptors. The possible interpretation is that membrane depolarization and extracellular potassium increases during the fast onset activity could increase the driving force for Cl−, thus increasing the synaptic response to activation of GABAa,fast receptors. Second, it can be hypothesized that the time-course of bicuculline washout effect differs on both receptor types, with an earlier re-increase of GABAa,fast receptor-mediated inhibition compared to GABAa,slow receptor-mediated inhibition. Both cases lead to a transient period of time during which the level of GABAa,fast inhibition is higher than GABAa,slow inhibition. The global effect would be an augmentation of the IPSPs mediated by GABAa,fast receptors which explains the higher frequency oscillations observed at seizure onset.
This essential role of GABAergic network in the generation of fast oscillatory activity has already been suggested in several studies related to the mechanisms of generation of gamma activity (Chrobak and Buzsaki, 1998b; Dickson et al., 2000a; Cunningham et al., 2003), ripples and fast ripples (Staba et al., 2002; Bragin et al., 2004). More precisely, it has been shown in hippocampus that both gamma and higher frequency oscillations reflect synchronized input into the perisomatic region of principal neurons from an interconnected network of GABAergic interneurons (Chrobak and Buzsaki, 1998a). In accordance with these results, our modeling observations suggest that a strong GABAa,fast receptor-mediated inhibition (targeting peri-somatic region) might also be essential in generation of fast onset activity in the EC. This interpretation is in agreement with identification of two kinetically distinct spontaneous inhibitory synaptic currents (IPSC) (fast or slow rise and decay times) recorded from EC inhibitory interneurons (layers II and V), entirely mediated by GABAa receptors (Woodhall et al., 2004). According with previous works (Wouterlood et al., 1995; Wouterlood and Pothuizen, 2000; Wouterlood et al., 2002) reporting spatially segregated synapses (axo-somatic and axo-dendritic) from inhibitory interneurons to pyramidal and stellate cells in EC, authors suggested these IPSC with different kinetics could result from activation of different subtypes of GABAa receptors (fast and slow), possibly post-synaptic to subpopulations of EC GABA interneurons (Woodhall et al., 2004). Presynaptic mechanisms affecting a given type of interneurons could be another mechanism to explain these changes in ratios of GABAa,slow/GABAa,fast receptor-mediated inhibitions. At present, the model only represents post-synaptic interactions and therefore can not be used to investigate this hypothesis.
Fast onset activity evolves towards a spontaneous ictal burst activity in real recordings. Bursting activity with a recurrence rate could be generated in the model by appropriate setting of parameters. This model property (known as an intermittence phenomena in nonlinear systems dynamics) results from the coupling of processes that express on slow and fast time scales, respectively related to GABAb and GABAa,fast receptor kinetics. In the model, spontaneous burst activity is due to an “interplay” between GABAa,fast and GABAb receptor-mediated inhibition while interburst interval is controlled by the latter. Indeed, the lengthening of interburst interval was reproduced by increasing GABAb receptor-mediated inhibition and should be explained by an increased availability of GABA that does not bind to GABAa receptors blocked by bicuculline. A recent in situ hybridization study (Nishimura et al., 2005) revealed an impaired GABAa receptor-mediated inhibition in hippocampus and a persistent upregulation of several subunits of GABAa and GABAb receptors in granule cells as compensatory anticonvulsant mechanisms. Besides, it has been shown that GABAb agonist drugs permitted to to shorten ongoing ictal activity in hippocampus (Stringer and Lothman, 1990) while GABAb antagonist drugs induce convulsions in cortical and limbic structures (Vergnes et al., 1997). Another possibility might be that changes in extracellular potassium concentration during the ictal onset decrease the driving force of GABAb, which then progressively recovers and consequently slows down burst frequency, as extracellular potassium concentration decreases. All these hypotheses need further investigation in order to be confirmed.
However, we noticed that the model was not able to reproduce (and consequently explain) one type of ictal activity encountered in 1 over the 10 experiments performed in the isolated guinea pig brain, characterized by bursts mixed with slower waves. We interpreted this limit to be due to the influence of extrinsic activities that are not taken into account in the model, at present. A recent study (Uva et al., 2005) showed, indeed, that some features of real EC recordings could be due to interactions between the EC and the hippocampus, the perirhinal and/or the piriform cortex. At present, the model only represents activity within the EC, independently from that of other structures.
Very few studies quantify synaptic contacts between neurons in EC deep and superficial layers. In the model presented in this work, information about inter-layer connectivity and synaptic connections between neurons and interneurons subpopulations within deep or superficial layers is based on the only available report by van Haeften and collegues (van Haeften et al., 2003). Local connectivity constants in the model are based on previous work (Traub et al., 1999). These two points related to connectivity parameters may be seen as a limit of the model, directly related to available stereological data. Besides, as previously noticed, our modeling approach leaves out different intrinsic neuronal properties as h-current or persistent Na+ conductance, or presynaptic GABAb receptors which are also able to modulate GABAergic neurotransmission. Nevertheless, the model proved its ability to simulate realistic epileptiform signals and to produce pathophysiological hypotheses (predictions) about mechanisms underlying the generation of these epileptiform activities. Furthermore, some of these model predictions seem to be in agreement with previous experimental findings. Other model predictions will need to be experimentally tested as the role of GABAb-mediated inhibition in the lengthening of the interburst interval and in the process of seizure termination or the hypothesis that a moderate decrease of GABAa receptor-mediated inhibition results in spikes mixed to background activity (pre-ictal phase). The relationship between GABAb-mediated potentials, pH and extracellular potassium changes with respect to the seizure time-course or the role of glycine-mediated inhibition in the burst shape in superficial layers constitute other examples of experimentally testable hypotheses. The model will also be improved by integration of presynaptic inhibition mechanisms. Indeed, amplitude of GABAergic average IPSPs could be modulated as a function of inhibitory effects related to GABAb receptors present on the presynaptic membrane (Deisz et al., 1997; Bailey et al., 2004).
Another perspective will be to connect the hippocampus model previously developed (Wendling et al., 2000; Wendling et al., 2002) with the present EC model in order to obtain a more complete model of the hippocampus-EC loop. In this model extension, we will probably need to also represent the dentate gyms and the subiculum as they constitute the input and output pathways of the hippocampus (Wouterlood, 2002). Additionally, superficial EC neurons have also been shown to be inhibited by the hippocampal output via a feed-forward inhibitory pathway (Gnatkovsky and de Curtis, in press). Without neglecting the difficulties inherent to any modeling approach, we think that advances in the interpretation of field potentials recorded from the hippocampus-EC system can be expected from such a model if based on strong intervalidation with experimental data.
Acknowledgments
We are grateful to Mr. Jean-Jacques Bellanger for helpful discussion about the theoretical aspect of this work.
Grants
We would like to thank the French Foundation for Epilepsy Research (FFRE) which funded this work.
References
- Agrawal N, Hamam BN, Magistretti J, Alonso A, Ragsdale DS. Persistent sodium channel activity mediates subthreshold membrane potential oscillations and low-threshold spikes in rat entorhinal cortex layer V neurons. Neuroscience. 2001;102:53–64. doi: 10.1016/s0306-4522(00)00455-3. [DOI] [PubMed] [Google Scholar]
- Avoli M, Louvel J, Pumain R, Kohling R. Cellular and molecular mechanisms of epilepsy in the human brain. Prog Neurobiol. 2005 doi: 10.1016/j.pneurobio.2005.09.006. [DOI] [PubMed] [Google Scholar]
- Avoli M, D’Antuono M, Louvel J, Kohling R, Biagini G, Pumain R, D’Arcangelo G, Tancredi V. Network and pharmacological mechanisms leading to epileptiform synchronization in the limbic system in vitro. Prog Neurobiol. 2002;68:167–207. doi: 10.1016/s0301-0082(02)00077-1. [DOI] [PubMed] [Google Scholar]
- Babb TL. Bilateral pathological damage in temporal lobe epilepsy. Can J Neurol Sci. 1991;18:645–648. doi: 10.1017/s031716710003287x. [DOI] [PubMed] [Google Scholar]
- Bailey SJ, Dhillon A, Woodhall GL, Jones RS. Lamina-specific differences in GABA(B) autoreceptor-mediated regulation of spontaneous GABA release in rat entorhinal cortex. Neuropharmacology. 2004;46:31–42. doi: 10.1016/j.neuropharm.2003.07.001. [DOI] [PubMed] [Google Scholar]
- Banks MI, Pearce RA. Kinetic differences between synaptic and extrasynaptic GABA(A) receptors in CA1 pyramidal cells. J Neurosci. 2000;20:937–948. doi: 10.1523/JNEUROSCI.20-03-00937.2000. [DOI] [PMC free article] [PubMed] [Google Scholar]
- Banks MI, White JA, Pearce RA. Interactions between distinct GABA(A) circuits in hippocampus. Neuron. 2000;25:449–457. doi: 10.1016/s0896-6273(00)80907-1. [DOI] [PubMed] [Google Scholar]
- Bartolomei F, Wendling F, Regis J, Gavaret M, Guye M, Chauvel P. Pre-ictal synchronicity in limbic networks of mesial temporal lobe epilepsy. Epilepsy Res. 2004;61:89–104. doi: 10.1016/j.eplepsyres.2004.06.006. [DOI] [PubMed] [Google Scholar]
- Bartolomei F, Khalil M, Wendling F, Sontheimer A, Regis J, Ranjeva JP, Guye M, Chauvel P. Entorhinal cortex involvement in human mesial temporal lobe epilepsy: an electrophysiologic and volumetric study. Epilepsia. 2005;46:677–687. doi: 10.1111/j.1528-1167.2005.43804.x. [DOI] [PubMed] [Google Scholar]
- Bear J, Lothman EW. An in vitro study of focal epileptogenesis in combined hippocampal-parahippocampal slices. Epilepsy Res. 1993;14:183–193. doi: 10.1016/0920-1211(93)90043-7. [DOI] [PubMed] [Google Scholar]
- Berretta N, Jones RS. A comparison of spontaneous EPSCs in layer II and layer IV–V neurons of the rat entorhinal cortex in vitro. J Neurophysiol. 1996;76:1089–1100. doi: 10.1152/jn.1996.76.2.1089. [DOI] [PubMed] [Google Scholar]
- Biella G, de Curtis M. Olfactory inputs activate the medial entorhinal cortex via the hippocampus. J Neurophysiol. 2000;83:1924–1931. doi: 10.1152/jn.2000.83.4.1924. [DOI] [PubMed] [Google Scholar]
- Bojak I, Liley DT. Modeling the effects of anesthesia on the electroencephalogram. Phys Rev E Stat Nonlin Soft Matter Phys. 2005;71:041902. doi: 10.1103/PhysRevE.71.041902. [DOI] [PubMed] [Google Scholar]
- Bradford HF. Glutamate, GABA and epilepsy. Prog Neurobiol. 1995;47:477–511. doi: 10.1016/0301-0082(95)00030-5. [DOI] [PubMed] [Google Scholar]
- Bragin A, Wilson CL, Almajano J, Mody I, Engel J., Jr High-frequency oscillations after status epilepticus: epileptogenesis and seizure genesis. Epilepsia. 2004;45:1017–1023. doi: 10.1111/j.0013-9580.2004.17004.x. [DOI] [PubMed] [Google Scholar]
- Breustedt J, Schmitz D, Heinemann U, Schmieden V. Characterization of the inhibitory glycine receptor on entorhinal cortex neurons. Eur J Neurosci. 2004;19:1987–1991. doi: 10.1111/j.1460-9568.2004.03266.x. [DOI] [PubMed] [Google Scholar]
- Caballero-Bleda M, Witter MP. Projections from the presubiculum and the parasubiculum to morphologically characterized entorhinal-hippocampal projection neurons in the rat. Exp Brain Res. 1994;101:93–108. doi: 10.1007/BF00243220. [DOI] [PubMed] [Google Scholar]
- Chrobak JJ, Buzsaki G. Operational dynamics in the hippocampal-entorhinal axis. Neurosci Biobehav Rev. 1998a;22:303–310. doi: 10.1016/s0149-7634(97)00016-x. [DOI] [PubMed] [Google Scholar]
- Chrobak JJ, Buzsaki G. Gamma oscillations in the entorhinal cortex of the freely behaving rat. J Neurosci. 1998b;18:388–398. doi: 10.1523/JNEUROSCI.18-01-00388.1998. [DOI] [PMC free article] [PubMed] [Google Scholar]
- Cohen I, Navarro V, Le Duigou C, Miles R. Mesial temporal lobe epilepsy: a pathological replay of developmental mechanisms? Biol Cell. 2003;95:329–333. doi: 10.1016/s0248-4900(03)00081-9. [DOI] [PubMed] [Google Scholar]
- Cohen I, Navarro V, Clemenceau S, Baulac M, Miles R. On the origin of interictal activity in human temporal lobe epilepsy in vitro. Science. 2002;298:1418–1421. doi: 10.1126/science.1076510. [DOI] [PubMed] [Google Scholar]
- Cossart R, Bernard C, Ben-Ari Y. Multiple facets of GABAergic neurons and synapses: multiple fates of GABA signalling in epilepsies. Trends Neurosci. 2005;28:108–115. doi: 10.1016/j.tins.2004.11.011. [DOI] [PubMed] [Google Scholar]
- Craig S, Commins S. Interaction between paired-pulse facilitation and long-term potentiation in the projection from hippocampal area CA1 to the entorhinal cortex. Neurosci Res. 2005;53:140–146. doi: 10.1016/j.neures.2005.06.009. [DOI] [PubMed] [Google Scholar]
- Cunningham MO, Davies CH, Buhl EH, Kopell N, Whittington MA. Gamma oscillations induced by kainate receptor activation in the entorhinal cortex in vitro. J Neurosci. 2003;23:9761–9769. doi: 10.1523/JNEUROSCI.23-30-09761.2003. [DOI] [PMC free article] [PubMed] [Google Scholar]
- de Curtis M, Pare D, Llinas RR. The electrophysiology of the olfactory-hippocampal circuit in the isolated and perfused adult mammalian brain in vitro. Hippocampus. 1991;1:341–354. doi: 10.1002/hipo.450010402. [DOI] [PubMed] [Google Scholar]
- de Curtis M, Manfridi A, Biella G. Activity-dependent pH shifts and periodic recurrence of spontaneous interictal spikes in a model of focal epileptogenesis. J Neurosci. 1998;18:7543–7551. doi: 10.1523/JNEUROSCI.18-18-07543.1998. [DOI] [PMC free article] [PubMed] [Google Scholar]
- De Curtis M, Biella G, Forti M, Panzica F. Multifocal spontaneous epileptic activity induced by restricted bicuculline ejection in the piriform cortex of the isolated guinea pig brain. J Neurophysiol. 1994;71:2463–2476. doi: 10.1152/jn.1994.71.6.2463. [DOI] [PubMed] [Google Scholar]
- de Guzman P, D’Antuono M, Avoli M. Initiation of electrographic seizures by neuronal networks in entorhinal and perirhinal cortices in vitro. Neuroscience. 2004;123:875–886. doi: 10.1016/j.neuroscience.2003.11.013. [DOI] [PubMed] [Google Scholar]
- Deisz RA, Billard JM, Zieglgansberger W. Presynaptic and postsynaptic GABAB receptors of neocortical neurons of the rat in vitro: differences in pharmacology and ionic mechanisms. Synapse. 1997;25:62–72. doi: 10.1002/(SICI)1098-2396(199701)25:1<62::AID-SYN8>3.0.CO;2-D. [DOI] [PubMed] [Google Scholar]
- Dickson CT, Biella G, de Curtis M. Evidence for spatial modules mediated by temporal synchronization of carbachol-induced gamma rhythm in medial entorhinal cortex. J Neurosci. 2000a;20:7846–7854. doi: 10.1523/JNEUROSCI.20-20-07846.2000. [DOI] [PMC free article] [PubMed] [Google Scholar]
- Dickson CT, Magistretti J, Shalinsky MH, Fransen E, Hasselmo ME, Alonso A. Properties and role of I(h) in the pacing of subthreshold oscillations in entorhinal cortex layer II neurons. J Neurophysiol. 2000b;83:2562–2579. doi: 10.1152/jn.2000.83.5.2562. [DOI] [PubMed] [Google Scholar]
- Dolorfo CL, Amaral DG. Entorhinal cortex of the rat: topographic organization of the cells of origin of the perforant path projection to the dentate gyrus. J Comp Neurol. 1998a;398:25–48. [PubMed] [Google Scholar]
- Dolorfo CL, Amaral DG. Entorhinal cortex of the rat: organization of intrinsic connections. J Comp Neurol. 1998b;398:49–82. doi: 10.1002/(sici)1096-9861(19980817)398:1<49::aid-cne4>3.0.co;2-9. [DOI] [PubMed] [Google Scholar]
- Falconer MA, Serafetinides EA, Corsellis JA. Etiology and Pathogenesis of Temporal Lobe Epilepsy. Arch Neurol. 1964;10:233–248. doi: 10.1001/archneur.1964.00460150003001. [DOI] [PubMed] [Google Scholar]
- Fountain NB, Bear J, Bertram EH, 3rd, Lothman EW. Responses of deep entorhinal cortex are epileptiform in an electrogenic rat model of chronic temporal lobe epilepsy. J Neurophysiol. 1998;80:230–240. doi: 10.1152/jn.1998.80.1.230. [DOI] [PubMed] [Google Scholar]
- Freeman WJ. Models of the dynamics of neural populations. Electroencephalogr Clin Neurophysiol. 1978;(Suppl):9–18. [PubMed] [Google Scholar]
- Funahashi M, Stewart M. GABA receptor-mediated post-synaptic potentials in the retrohippocampal cortices: regional, laminar and cellular comparisons. Brain Res. 1998;787:19–33. doi: 10.1016/s0006-8993(97)01384-x. [DOI] [PubMed] [Google Scholar]
- Gahwiler BH, Brown DA. GABAB-receptor-activated K+ current in voltage-clamped CA3 pyramidal cells in hippocampal cultures. Proc Natl Acad Sci U S A. 1985;82:1558–1562. doi: 10.1073/pnas.82.5.1558. [DOI] [PMC free article] [PubMed] [Google Scholar]
- Gloveli T, Dugladze T, Schmitz D, Heinemann U. Properties of entorhinal cortex deep layer neurons projecting to the rat dentate gyrus. Eur J Neurosci. 2001;13:413–420. doi: 10.1046/j.0953-816x.2000.01405.x. [DOI] [PubMed] [Google Scholar]
- Gloveli T, Schmitz D, Empson RM, Dugladze T, Heinemann U. Morphological and electrophysiological characterization of layer III cells of the medial entorhinal cortex of the rat. Neuroscience. 1997;77:629–648. doi: 10.1016/s0306-4522(96)00494-0. [DOI] [PubMed] [Google Scholar]
- Gnatkovsky V, Uva L, de Curtis M. Topographic distribution of direct and hippocampus- mediated entorhinal cortex activity evoked by olfactory tract stimulation. Eur J Neurosci. 2004;20:1897–1905. doi: 10.1111/j.1460-9568.2004.03627.x. [DOI] [PubMed] [Google Scholar]
- Hamam BN, Amaral DG, Alonso AA. Morphological and electrophysiological characteristics of layer V neurons of the rat lateral entorhinal cortex. J Comp Neurol. 2002;451:45–61. doi: 10.1002/cne.10335. [DOI] [PubMed] [Google Scholar]
- Hamam BN, Kennedy TE, Alonso A, Amaral DG. Morphological and electrophysiological characteristics of layer V neurons of the rat medial entorhinal cortex. J Comp Neurol. 2000;418:457–472. [PubMed] [Google Scholar]
- Insausti R, Herrero MT, Witter MP. Entorhinal cortex of the rat: cytoarchitectonic subdivisions and the origin and distribution of cortical efferents. Hippocampus. 1997;7:146–183. doi: 10.1002/(SICI)1098-1063(1997)7:2<146::AID-HIPO4>3.0.CO;2-L. [DOI] [PubMed] [Google Scholar]
- Jansen BHRV. Electroencephalogram and visual evoked potential generation in a mathematical model of coupled cortical columns. Biol Cybern. 1995;73:357–366. doi: 10.1007/BF00199471. [DOI] [PubMed] [Google Scholar]
- Jansen BHZG, Brandt ME. A neurophysiologically-based mathematical model of flash visual evoked potentials. Biol Cybern. 1993;68:275–283. doi: 10.1007/BF00224863. [DOI] [PubMed] [Google Scholar]
- Jefferys JG. Nonsynaptic modulation of neuronal activity in the brain: electric currents and extracellular ions. Physiol Rev. 1995;75:689–723. doi: 10.1152/physrev.1995.75.4.689. [DOI] [PubMed] [Google Scholar]
- Jones RS, Buhl EH. Basket-like interneurones in layer II of the entorhinal cortex exhibit a powerful NMDA-mediated synaptic excitation. Neurosci Lett. 1993;149:35–39. doi: 10.1016/0304-3940(93)90341-h. [DOI] [PubMed] [Google Scholar]
- Kapur A, Pearce RA, Lytton WW, Haberly LB. GABAA-mediated IPSCs in piriform cortex have fast and slow components with different properties and locations on pyramidal cells. J Neurophysiol. 1997;78:2531–2545. doi: 10.1152/jn.1997.78.5.2531. [DOI] [PubMed] [Google Scholar]
- Kirchner A, Breustedt J, Rosche B, Heinemann UF, Schmieden V. Effects of taurine and glycine on epileptiform activity induced by removal of Mg2+ in combined rat entorhinal cortex-hippocampal slices. Epilepsia. 2003;44:1145–1152. doi: 10.1046/j.1528-1157.2003.01603.x. [DOI] [PubMed] [Google Scholar]
- Klink R, Alonso A. Morphological characteristics of layer II projection neurons in the rat medial entorhinal cortex. Hippocampus. 1997;7:571–583. doi: 10.1002/(SICI)1098-1063(1997)7:5<571::AID-HIPO12>3.0.CO;2-Y. [DOI] [PubMed] [Google Scholar]
- Kloosterman F, Witter MP, Van Haeften T. Topographical and laminar organization of subicular projections to the parahippocampal region of the rat. J Comp Neurol. 2003;455:156–171. doi: 10.1002/cne.10472. [DOI] [PubMed] [Google Scholar]
- Lewis TM, Schofield PR, McClellan AM. Kinetic determinants of agonist action at the recombinant human glycine receptor. J Physiol. 2003;549:361–374. doi: 10.1113/jphysiol.2002.037796. [DOI] [PMC free article] [PubMed] [Google Scholar]
- Librizzi L, de Curtis M. Epileptiform ictal discharges are prevented by periodic interictal spiking in the olfactory cortex. Ann Neurol. 2003;53:382–389. doi: 10.1002/ana.10471. [DOI] [PubMed] [Google Scholar]
- Lopes da Silva F, Pijn JP, Boeijinga P. Interdependence of EEG signals: linear vs. nonlinear associations and the significance of time delays and phase shifts. Brain Topogr. 1989;2:9–18. doi: 10.1007/BF01128839. [DOI] [PubMed] [Google Scholar]
- Lopes da Silva FH, Hoeks A, Smits H, Zetterberg LH. Model of brain rhythmic activity. The alpha-rhythm of the thalamus. Kybernetik. 1974;15:27–37. doi: 10.1007/BF00270757. [DOI] [PubMed] [Google Scholar]
- Lopes da Silva FH, van Rotterdam A, Barts P, van Heusden E, Burr W. Models of neuronal populations: the basic mechanisms of rhythmicity. Prog Brain Res. 1976;45:281–308. doi: 10.1016/S0079-6123(08)60995-4. [DOI] [PubMed] [Google Scholar]
- Magistretti J, Alonso A. Biophysical properties and slow voltage-dependent inactivation of a sustained sodium current in entorhinal cortex layer-II principal neurons: a whole-cell and single-channel study. J Gen Physiol. 1999;114:491–509. doi: 10.1085/jgp.114.4.491. [DOI] [PMC free article] [PubMed] [Google Scholar]
- Magistretti J, Alonso A. Fine gating properties of channels responsible for persistent sodium current generation in entorhinal cortex neurons. J Gen Physiol. 2002;120:855–873. doi: 10.1085/jgp.20028676. [DOI] [PMC free article] [PubMed] [Google Scholar]
- Miettinen M, Koivisto E, Riekkinen P, Miettinen R. Coexistence of parvalbumin and GABA in nonpyramidal neurons of the rat entorhinal cortex. Brain Res. 1996;706:113–122. doi: 10.1016/0006-8993(95)01203-6. [DOI] [PubMed] [Google Scholar]
- Mikkonen M, Soininen H, Pitkanen A. Distribution of parvalbumin-, calretinin-, and calbindin-D28k-immunoreactive neurons and fibers in the human entorhinal cortex. J Comp Neurol. 1997;388:64–88. [PubMed] [Google Scholar]
- Mizukami K, Ishikawa M, Hidaka S, Iwakiri M, Sasaki M, Iritani S. Immunohistochemical localization of GABAB receptor in the entorhinal cortex and inferior temporal cortex of schizophrenic brain. Prog Neuropsychopharmacol Biol Psychiatry. 2002;26:393–396. doi: 10.1016/s0278-5846(01)00247-0. [DOI] [PubMed] [Google Scholar]
- Morimoto K, Fahnestock M, Racine RJ. Kindling and status epilepticus models of epilepsy: rewiring the brain. Prog Neurobiol. 2004;73:1–60. doi: 10.1016/j.pneurobio.2004.03.009. [DOI] [PubMed] [Google Scholar]
- Muhlethaler M, de Curtis M, Walton K, Llinas R. The isolated and perfused brain of the guinea-pig in vitro. Eur J Neurosci. 1993;5:915–926. doi: 10.1111/j.1460-9568.1993.tb00942.x. [DOI] [PubMed] [Google Scholar]
- Nishimura T, Schwarzer C, Gasser E, Kato N, Vezzani A, Sperk G. Altered expression of GABA(A) and GABA(B) receptor subunit mRNAs in the hippocampus after kindling and electrically induced status epilepticus. Neuroscience. 2005;134:691–704. doi: 10.1016/j.neuroscience.2005.04.013. [DOI] [PubMed] [Google Scholar]
- Otis TS, De Koninck Y, Mody I. Characterization of synaptically elicited GABAB responses using patch-clamp recordings in rat hippocampal slices. J Physiol. 1993;463:391–407. doi: 10.1113/jphysiol.1993.sp019600. [DOI] [PMC free article] [PubMed] [Google Scholar]
- Pijn JP, Lopes da Silva FH. In: Propagation of electrical activity: nonlinear associations and time delays between EEG signals, in Basic Mechanisms of the EEG. ZaS, editor. Boston: Birkauser; 1993. [Google Scholar]
- Pikkarainen M, Ronkko S, Savander V, Insausti R, Pitkanen A. Projections from the lateral, basal, and accessory basal nuclei of the amygdala to the hippocampal formation in rat. J Comp Neurol. 1999;403:229–260. [PubMed] [Google Scholar]
- Price CJ, Cauli B, Kovacs ER, Kulik A, Lambolez B, Shigemoto R, Capogna M. Neurogliaform neurons form a novel inhibitory network in the hippocampal CA1 area. J Neurosci. 2005;25:6775–6786. doi: 10.1523/JNEUROSCI.1135-05.2005. [DOI] [PMC free article] [PubMed] [Google Scholar]
- Sloviter RS. The functional organization of the hippocampal dentate gyrus and its relevance to the pathogenesis of temporal lobe epilepsy. Ann Neurol. 1994;35:640–654. doi: 10.1002/ana.410350604. [DOI] [PubMed] [Google Scholar]
- Spencer SS, Spencer DD. Entorhinal-hippocampal interactions in medial temporal lobe epilepsy. Epilepsia. 1994;35:721–727. doi: 10.1111/j.1528-1157.1994.tb02502.x. [DOI] [PubMed] [Google Scholar]
- Staba RJ, Wilson CL, Bragin A, Fried I, Engel J., Jr Quantitative analysis of high-frequency oscillations (80–500 Hz) recorded in human epileptic hippocampus and entorhinal cortex. J Neurophysiol. 2002;88:1743–1752. doi: 10.1152/jn.2002.88.4.1743. [DOI] [PubMed] [Google Scholar]
- Stringer JL, Lothman EW. Pharmacological evidence indicating a role of GABAergic systems in termination of limbic seizures. Epilepsy Res. 1990;7:197–204. doi: 10.1016/0920-1211(90)90015-n. [DOI] [PubMed] [Google Scholar]
- Suffczynski P, Kalitzin S, Lopes Da Silva FH. Dynamics of non-convulsive epileptic phenomena modeled by a bistable neuronal network. Neuroscience. 2004;126:467–484. doi: 10.1016/j.neuroscience.2004.03.014. [DOI] [PubMed] [Google Scholar]
- Tamamaki N, Nojyo Y. Preservation of topography in the connections between the subiculum, field CA1, and the entorhinal cortex in rats. J Comp Neurol. 1995;353:379–390. doi: 10.1002/cne.903530306. [DOI] [PubMed] [Google Scholar]
- Tamas G, Lorincz A, Simon A, Szabadics J. Identified sources and targets of slow inhibition in the neocortex. Science. 2003;299:1902–1905. doi: 10.1126/science.1082053. [DOI] [PubMed] [Google Scholar]
- Thomson AM, Bannister AP. Interlaminar connections in the neocortex. Cereb Cortex. 2003;13:5–14. doi: 10.1093/cercor/13.1.5. [DOI] [PubMed] [Google Scholar]
- Traub RD, Whittington MA, Buhl EH, Jefferys JG, Faulkner HJ. On the mechanism of the gamma --> beta frequency shift in neuronal oscillations induced in rat hippocampal slices by tetanic stimulation. J Neurosci. 1999;19:1088–1105. doi: 10.1523/JNEUROSCI.19-03-01088.1999. [DOI] [PMC free article] [PubMed] [Google Scholar]
- Uva L, de Curtis M. Polysynaptic olfactory pathway to the ipsi- and contralateral entorhinal cortex mediated via the hippocampus. Neuroscience. 2005;130:249–258. doi: 10.1016/j.neuroscience.2004.08.042. [DOI] [PubMed] [Google Scholar]
- Uva L, Librizzi L, Wendling F, de Curtis M. Propagation dynamics of epileptiform activity acutely induced by bicuculline in the hippocampal-parahippocampal region of the isolated Guinea pig brain. Epilepsia. 2005;46:1914–1925. doi: 10.1111/j.1528-1167.2005.00342.x. [DOI] [PubMed] [Google Scholar]
- van Haeften T, Wouterlood FG, Jorritsma-Byham B, Witter MP. GABAergic presubicular projections to the medial entorhinal cortex of the rat. J Neurosci. 1997;17:862–874. doi: 10.1523/JNEUROSCI.17-02-00862.1997. [DOI] [PMC free article] [PubMed] [Google Scholar]
- van Haeften T, Baks-te-Bulte L, Goede PH, Wouterlood FG, Witter MP. Morphological and numerical analysis of synaptic interactions between neurons in deep and superficial layers of the entorhinal cortex of the rat. Hippocampus. 2003;13:943–952. doi: 10.1002/hipo.10144. [DOI] [PubMed] [Google Scholar]
- Vergnes M, Boehrer A, Simler S, Bernasconi R, Marescaux C. Opposite effects of GABAB receptor antagonists on absences and convulsive seizures. Eur J Pharmacol. 1997;332:245–255. doi: 10.1016/s0014-2999(97)01085-6. [DOI] [PubMed] [Google Scholar]
- Wendling F, Bellanger JJ, Bartolomei F, Chauvel P. Relevance of nonlinear lumped-parameter models in the analysis of depth-EEG epileptic signals. Biol Cybern. 2000;83:367–378. doi: 10.1007/s004220000160. [DOI] [PubMed] [Google Scholar]
- Wendling F, Bartolomei F, Bellanger JJ, Chauvel P. Interpretation of interdependencies in epileptic signals using a macroscopic physiological model of the EEG. Clin Neurophysiol. 2001;112:1201–1218. doi: 10.1016/s1388-2457(01)00547-8. [DOI] [PubMed] [Google Scholar]
- Wendling F, Bartolomei F, Bellanger JJ, Chauvel P. Epileptic fast activity can be explained by a model of impaired GABAergic dendritic inhibition. Eur J Neurosci. 2002;15:1499–1508. doi: 10.1046/j.1460-9568.2002.01985.x. [DOI] [PubMed] [Google Scholar]
- White JA, Banks MI, Pearce RA, Kopell NJ. Networks of interneurons with fast and slow gamma-aminobutyric acid type A (GABAA) kinetics provide substrate for mixed gamma-theta rhythm. Proc Natl Acad Sci U S A. 2000;97:8128–8133. doi: 10.1073/pnas.100124097. [DOI] [PMC free article] [PubMed] [Google Scholar]
- Wilson HR, Cowan JD. Excitatory and inhibitory interactions in localized populations of model neurons. Biophys J. 1972;12:1–24. doi: 10.1016/S0006-3495(72)86068-5. [DOI] [PMC free article] [PubMed] [Google Scholar]
- Witter MP, Van Hoesen GW, Amaral DG. Topographical organization of the entorhinal projection to the dentate gyrus of the monkey. J Neurosci. 1989a;9:216–228. doi: 10.1523/JNEUROSCI.09-01-00216.1989. [DOI] [PMC free article] [PubMed] [Google Scholar]
- Witter MP, Groenewegen HJ, Lopes da Silva FH, Lohman AH. Functional organization of the extrinsic and intrinsic circuitry of the parahippocampal region. Prog Neurobiol. 1989b;33:161–253. doi: 10.1016/0301-0082(89)90009-9. [DOI] [PubMed] [Google Scholar]
- Woodhall GL, Bailey SJ, Thompson SE, Evans DI, Jones RS. Fundamental differences in spontaneous synaptic inhibition between deep and superficial layers of the rat entorhinal cortex. Hippocampus. 2004 doi: 10.1002/hipo.20047. [DOI] [PubMed] [Google Scholar]
- Wouterlood FG, Pothuizen H. Sparse colocalization of somatostatin- and GABA-immunoreactivity in the entorhinal cortex of the rat. Hippocampus. 2000;10:77–86. doi: 10.1002/(SICI)1098-1063(2000)10:1<77::AID-HIPO8>3.0.CO;2-P. [DOI] [PubMed] [Google Scholar]
- Wouterlood FG, Vinkenoog M, van den Oever M. Tracing tools to resolve neural circuits. Network. 2002;13:327–342. [PubMed] [Google Scholar]
- Wouterlood FG, Hartig W, Bruckner G, Witter MP. Parvalbumin-immunoreactive neurons in the entorhinal cortex of the rat: localization, morphology, connectivity and ultrastructure. J Neurocytol. 1995;24:135–153. doi: 10.1007/BF01181556. [DOI] [PubMed] [Google Scholar]
- Wouterlood FG, van Denderen JC, van Haeften T, Witter MP. Calretinin in the entorhinal cortex of the rat: distribution, morphology, ultrastructure of neurons, and co-localization with gamma-aminobutyric acid and parvalbumin. J Comp Neurol. 2000;425:177–192. doi: 10.1002/1096-9861(20000918)425:2<177::aid-cne2>3.0.co;2-g. [DOI] [PubMed] [Google Scholar]
- Wouterlood FG, Van Haeften T, Eijkhoudt M, Baks-Te-Bulte L, Goede PH, Witter MP. Input from the presubiculum to dendrites of layer-V neurons of the medial entorhinal cortex of the rat. Brain Res. 2004;1013:1–12. doi: 10.1016/j.brainres.2004.03.017. [DOI] [PubMed] [Google Scholar]
- Wouterlood Wa. The parahippocampal region: organization and role in cognitive function. New York: Oxford University Press; 2002. [Google Scholar]
- Wyss JM. An autoradiographic study of the efferent connections of the entorhinal cortex in the rat. J Comp Neurol. 1981;199:495–512. doi: 10.1002/cne.901990405. [DOI] [PubMed] [Google Scholar]
- Yilmazer-Hanke DM, Wolf HK, Schramm J, Elger CE, Wiestler OD, Blumcke I. Subregional pathology of the amygdala complex and entorhinal region in surgical specimens from patients with pharmacoresistant temporal lobe epilepsy. J Neuropathol Exp Neurol. 2000;59:907–920. doi: 10.1093/jnen/59.10.907. [DOI] [PubMed] [Google Scholar]