

Abstract
We used 1H MRS to evaluate brain metabolic differences in sisters with partial ornithine transcarbamylase deficiency (OTCD) who had discordant clinical symptoms and urea synthetic capabilities to assess whether a brain biomarker of partial OTCD correlated with urea synthetic ability and clinical severity. We performed single voxel 3.0T 1H MRS in two adult sisters with partial OTCD, one symptomatic and one asymptomatic, in a stable medical state and compared it to one age matched adult control, as well as data collected on an additional 13 subjects with partial OTCD and 12 controls. Data from voxels placed in frontal and parietal white matter (FWM, PWM), posterior cingulate gray matter (PCGM), and thalamus (tha), were corrected for partial volume and analyzed using “LCModel”. All three subjects as well as the symptomatic mother of the two sisters, had neurocognitive testing, plasma ammonia levels, plasma amino acid, and urine organic acid analysis. Previous urea synthetic capabilities had been measured by stable isotope analysis. We found IQ scores to be inversely related to symptoms. Decreased myoinositol (mI) identified OTCD subjects, even the sister who is asymptomatic, in the posterior parietal white matter and frontal white matter. Brain metabolism is impaired in partial OTCD. Abnormal metabolism in apparently asymptomatic OTCD females may provide an explanation for neurocognitive impairments previously reported. The concentration of mI seen on 1HMRS in PWM and FWM in this family could be used to deduce clinical symptomatology and may serve as a non invasive marker of brain liability in OTCD.
Keywords: ammonia, urea cycle; 1H magnetic resonance spectroscopy (MRS); myoinositol; ornithine transcarbamylase deficiency (OTCD); stable isotopes
Introduction
The urea cycle disorders are a relatively common group of inborn errors of metabolism. Clinical syndromes have been described involving deficiencies of five urea cycle enzymes and three related cofactors and transporters [1–3]. The most common of these conditions, ornithine transcarbamylase deficiency (OTCD), is the only X-linked disorder, with an incidence of 1:70,000 [4]. Heterozygous females manifest a variable phenotype due to both allelic heterogeneity and differential X-inactivation. Approximately 85% of females seem asymptomatic; the others often display behavioral and learning disabilities, protein intolerance, cyclical vomiting, stroke like episodes and, in more extreme cases, hyperammonemic coma [5–9].
Clinical diagnosis may be difficult in females, especially in those with symptoms after the newborn period. In 1996, Yudkoff and colleagues developed a stable isotope method of measuring the urea synthesis rate in carriers [10]. They measured the incorporation of 15NH3 into [15N] urea in 11 males and 23 females with OTCD deficiency. The results indicated that asymptomatic carriers formed urea at a normal rate, but that the rate of [5-15N] glutamine production exceeded the control value, suggesting that nitrogen metabolism was abnormal even in the absence of overt clinical symptomatology. A correlation was observed between genotype and phenotype, with ureagenesis being most compromised in individuals with early-onset disease.
Subsequent studies have demonstrated specific neurocognitive deficits in affected females [11] despite normal IQ scores. These women manifest weaknesses in nonverbal intelligence, fine motor/dexterity/speed, visual memory, attention and executive skills, and mathematical reasoning. This neurocognitive profile supports a nonverbal learning disability, characteristic of subcortical white matter dysfunction [12].
1H MRS studies have demonstrated elevations in glutamine and decreases in myoinositol and choline in patients who are clinically symptomatic [13–15].We recently used 1HMRS to document a relative depletion of brain myoinositol in females who describe themselves as asymptomatic [16]. We have hypothesized that the decrement of myoinositol might constitute a useful biochemical marker with which to discriminate females with a partial deficiency.
In this report we correlate brain myoinositol concentration with clinical severity in two sisters who are heterozygous for a mutation in OTCD that is lethal in a male infant. One sister was asymptomatic. We performed neurocognitive testing in both women. We also measured ureagenesis with the 15NH3 loading procedure. These data indicate a correlation between disease severity and the biochemical findings, including the MRS data.
Material and Methods
Subjects
We performed 1HMRS in two females (case 1 and case 2) with late onset OTCD and in their mother (an OTCD carrier). We compare their results with an unaffected age matched control (Table3 1–3). These sisters are part of a pedigree that includes a male sibling who suffered hyperammonemic coma in the newborn period and died at 14 months of age as well as and two unaffected sisters (Figure 1). The mutation is known to be lethal in the male newborn (c. 421C>T; p. Arg141X) [17]. This study has been approved by the local IRB. All subjects gave informed consent for participation.
Table 3.
Neurocognitive studies and results. All subjects were tested with a neurocognitive battery including Weschler Abbreviated scales of intelligence (WASI), Behavior Rating inventory of executive function (BRIEF), Comprehensive trails making test (CTMT) and the STROOP test.
| WASI | BRIEF A | CTMT | Stroop | ||||||
|---|---|---|---|---|---|---|---|---|---|
| Full Scale | Verbal | Performance | BRI | MI | GEC | Composite | Percentile | Reaction Time | |
| Subject 1 (III.1.) | 114 | 110 | 114 | 37 | 38 | 36 | 46 | 35 | 628 ms |
| Subject 2 (III.3.) | 83 | 88 | 81 | 64 | 78 | 74 | 20 | <1 | 1279 ms |
| Subject 3 (II.2.) | 107 | 106 | 107 | 63 | 64 | 65 | 42 | 3 | 875 ms |
| Subject 4 (Control) | 126 | 119 | 126 | 36 | 40 | 37 | 68 | 96 | 705 ms |
Key. WASI=Weschler abbreviated scales of intelligence; BRIEF=Behavior Rating Inventory of Executive Function; CTMT=comprehensive trail making test; STROOP=test of mental flexibility.
Figure 1.
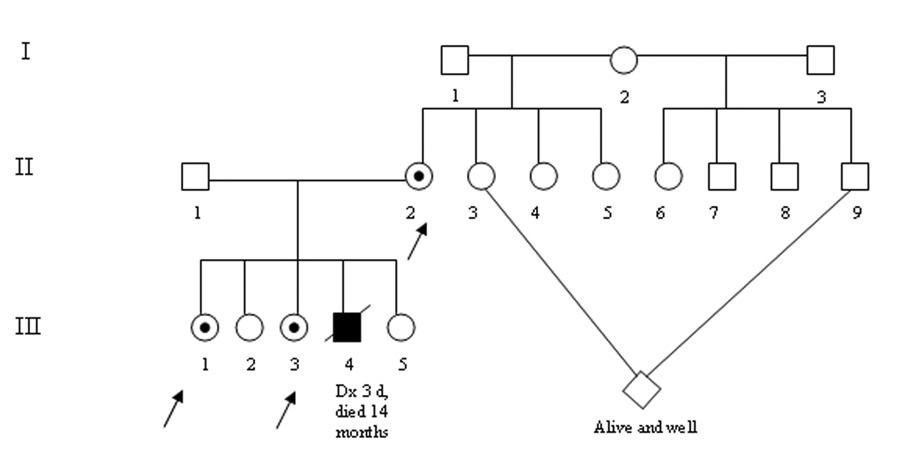
Pedigree of our study family. Case II.1 is an OTCD heterozygote who is clinically asymptomatic. Her sister, case III.3 presented at age 2 ½ with anorexia, vomiting and encephalopathy. She experiences intermittent hyperammonemia and cognitive impairments. Their mother, case II.2, had vomiting and headache with onset in the teen years.
Clinical and cognitive assessment
Each subject underwent a battery of neuropsychological tests, including IQ measures, and tests of specific domains including executive function, language skills, and nonverbal reasoning (Table 3). The neuroimaging was performed as part of a larger protocol which included structural/anatomic imaging, diffusion tensor imaging, 1HMRS, and functional MRI (fMRI).
Biochemical studies
Prior to imaging, blood was analyzed for post-absorptive levels of plasma ammonia and amino acids. Amino acids were analyzed by ion exchange chromatography (Beckman or Toshiba), with ninhydrin detection. Urine organic acids were extracted into ether, dried, derivatized with BSTFA 10% TMCS and washed and analyzed by GC/Mass spectrometry using electrospray ionization (Agilent Technologies). Ammonia levels were measured on a Dade-Behring RXL analyzer.
Stable isotope studies
We used gas chromatography-mass spectrometry to measure [15N] urea and [5-15N] glutamine formation after an oral load of 15NH4Cl. [10].
MRI data acquisition
MRI was performed using a 3T whole-body MRI scanner (Siemens Magnetom Trio, Erlengen, Germany). The structural protocol consisted of three MPRAGE scans acquired during the same scanning session with the following parameters: TR = 1600ms, TE = 4.38ms, TI = 640ms, flip angle 15°, averages = 1, 160 slices with a 1.0mm thickness, FOV = 256×256mm2, effective resolution = 1.0×1.0×1.03mm, scan time = 6:51 minutes.
Spectroscopy measurements were acquired using a manufacturer supplied eight-channel phased array head coil. To optimize signal-to-noise, we employed single-voxel spectroscopy using 2×2×2 cm3 volumes of interest (VOIs) in the posterior cingulate cortex (PCGM) the posterior parietal white matter (PWM), thalamus (tha), and the frontal white matter (FWM) (Figure 2). A point-resolved spectroscopy (PRESS) sequence with a TE 30ms, TR 2000ms, and 200 averages was used as well as a 15 second non water suppressed reference scan for eddy current correction. Automatic shimming was performed before each acquisition. A full width at half maximum of 0.1ppm used as the upper cut-off for acceptable shim results.
Figure 2.

Voxel locations for this study included a) posterior parietal white matter (PWM); b) posterior cingulate gray matter (PCGM); c) thalamus (tha); and d) frontal white matter (FWM).
Estimates of metabolite concentrations
The contribution of an individual metabolite to the in vivo spectrum was quantified using “LCModel” (Provencher Inc., Oakville, Canada) [18], a fully automatic method, without subjective inputs for phasing, referencing and initial estimates. The in vivo spectrum is modeled as a linear combination of adequately line broadened individual metabolite spectra. A standard basis set was used for this analysis, which was acquired on an equivalent Siemens 3T Trio scanner.
The intensity of the in-vivo spectrum was calibrated using the water signal from the same voxel as an internal reference, assuming water content of 43300mM for grey matter and 35880mM for white matter [19]. A full width half maximum of metabolites greater than 0.071-0.1ppm coupled with CRMVB >20% for large peak metabolites and >30% for glutamate and glutamine were used as criteria for rejection of spectra or individual metabolite spectra. Unexplainable features in the spectra such as unusual residuals, grossly asymmetrical line shape, split peaks – usually motion induced, and outer volume ghosting were also taken into account for exclusion [20].
Partial volume correction
A high-resolution anatomic scan was used for graphical positioning of the MRS voxels (Figure 3), and to determine tissue composition of the sampling voxel for use in partial volume correction. The voxels from the different locations were transformed onto the VBM (GM, WM, and CSF) maps to obtain the voxel tissue content.
Figure 3.
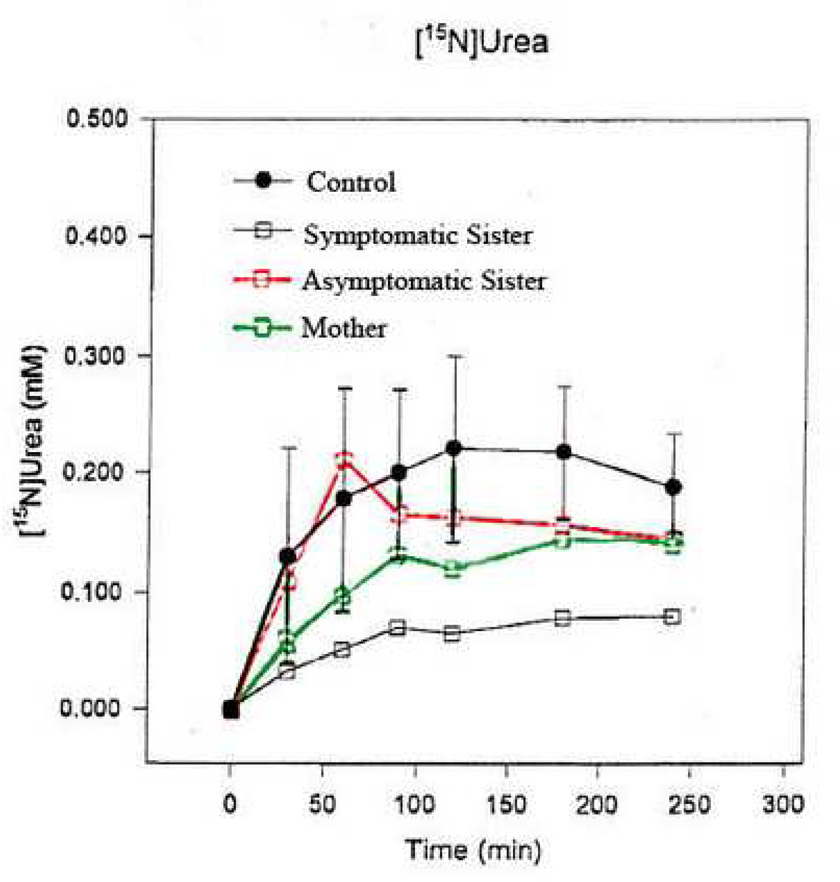
15N urea incorporation studies in cases III.1, III.3, and II.2 as compared to a normal control. Concentration incorporation into urea is depicted on the Y axis versus time (X axis). Lowest incorporation rate is seen in the most clinically symptomatic subject, III.3. The asymptomatic sister has values approaching that of controls. The mother (II.2), displays intermediate levels. Enzyme incorporation levels are correlated with clinical symptoms and inversely correlated with [mI] in this study.
Reliability estimation
Assessment of the reliability of the metabolite concentrations were based on the Cramér-Rao lower bounds (CRB), from the Cramér-Rao inequality, estimates of the standard deviations of the fit for each metabolite given in percent Standard deviation of the brain parenchyma fraction which is used for voxel CSF content correction [21].
Results
Clinical, neurocognitive, and laboratory values for ammonia and plasma glutamine are shown in Table 1–Table 3.
Table 1.
Patient demographics of our subjects including age of onset, full scale IQ, age at diagnosis and highest documented ammonia
| Subject # | Age | Gender | Clinical/Familial History | Symptoms | Age at Onset | Genotype | FSIQ | Age at Diagnosis | Highest Ammonia |
|---|---|---|---|---|---|---|---|---|---|
| Subject 1 (III.1.) | 24 | F | Non- symptomatic, |
n/a migraines |
n/a | c. 421C>T p. Arg141X neonatal |
114 | 6 | 20* |
| Subject 2 (III.3.) | 19 | F | Symptomatic | Vomiting, lethargy, confusion, picky eating |
Early childhood | c.421C>T p.Arg141X neonatal |
83 | 2 | 90 |
| Subject 3 (II.2.) | 48 | F | Symptomatic | Vomiting, headache | Teen years |
c.421C>T p.Arg141X neonatal |
107 | N/A | Unknown |
| Subject 4 (Control) | 23 | F | Control | N/A | N/A | N/A | 128 | N/A | N/A |
only known ammonia level is the one taken as part of this study
Clinical histories
Subject 1 (Case III.1.) was the first pregnancy to a healthy 22 year old G1P0-2 female and unrelated 22 year old husband. There were no pregnancy related complications, medication use or maternal illnesses. She was born at term by NSVD with a birth weight of 3690g (75th percentile), length of 53.34 cm (90th percentile) and orbital frontal circumference (OFC) of 36 cm (75th percentile). Apgar scores were 9195. There were no problems in the newborn period. Subsequent health and development were unremarkable except for a history of migraines later in life. She consumes a normal dietary protein (1.75 gms/kg) (weight 59.4 kg). 15N labeling studies were performed revealing incorporation to be mildly below normal (Figure 3). Her medical and neurological examinations were normal at the time of study.
Subject 2 (Case III.3.) was the 4th pregnancy to a 28 yo G4 P3-4 female. Pregnancy was uncomplicated. There were no pregnancy related complications, medication use or maternal illnesses. She was born at term by NSVD with a birth weight of 3.4 kg (50th percentile), length of 50.8 cm (50–75th percentile), and OFC of 35 cm (25th percentile). She exhibited tachypnea at birth. Early feeding was unremarkable although she developed lethargy and reflux as an infant. Her brother was born when she was 1 year of age. He succumbed to lethal hyperammonemia. At 2 1/2 years of age, she developed a febrile illness and lethargy. Her ammonia was 90 µmol/liter. Mutational analysis showed a mutation in exon 5, (Arg141Ter) m, arg to stop [17]. She has had approximately six hospitalizations for hyperammonemia, the last at 10 years of age. Her early development was normal but she had learning and attentional problems in school requiring special assistance. Her FSIQ is 83. She consumes a diet consisting of 0.6gm/kg protein (weight 61.5 kg) . She is treated with buphenyl and citrulline. Her medical examination was normal at the time of study. Her neurological examination was notable for decreased vibration sensation in the lower extremities.
Subject 3 (Case II.2.). This patient, the mother of the two sisters, was born to a 24 year old G2P1-2 healthy female and her 25 year old husband. There were no pregnancy related complications, medication use or maternal illnesses. She was born at term by NSVD with a birth weight of 3.63 kg (50th percentile), length of 50.8 cm (50–75th percentile), and OFC of 35 cm (25th percentile). Early infancy was unremarkable. As a child, she experienced multiple episodes of vomiting with dehydration attributed to flu like illness. She noticed that high protein meals caused nausea and vomiting. She described protein restriction since age 22 years. It was not until after her children were found to have OTCD, that her diagnosis was established. She daily consumes 0.79 mg/kg protein (weight 67.2 kg). Her medical and neurological examinations were normal at the time of study. She was unable to complete neuroimaging studies due to claustrophobia.
Subject 4 (Control Case). This female was born at term after an uncomplicated pregnancy to a 35 yo G2 P2 healthy female. The pregnancy was complicated by Rh incompatibility and breech presentation. She was born by Cesarean section with a birth weight of 4.08 kg (90th percentile) and length of 55.88 (95th percentile). The OFC was 36 cm (30th percentile). There were no problems in the neonatal period or in childhood. In particular, there were no feeding issues or developmental concerns noted. There is no family history of either genetic or neurological disease.
Neurocognitive performance
All subjects completed the Weschler Adult intelligence scales measurement, the “Comprehensive Trails Making Tests” (used to evaluate and diagnose frontal lobe deficits and problems with psychomotor speed, visual search and sequencing, and attention; and impairments in set-shifting), and “The Behavior Rating Inventory of Executive Function” (BRIEF), a standardized parent questionnaire that samples behaviors related to executive functioning. The global executive composite of the BRIEF was examined as an index of executive functioning, and the STROOP, a test of mental flexibility. The results are shown in Table 3. The FSIQ of subjects 1 and 3 were 114 and 107, whereas in subject 2, the affected sister, the FSIQ was 83. Subject 2 showed impairments in working memory, executive function, reaction speed, and mental flexibility. IQ inversely correlated with severity of symptoms and with height of mI peak.
Biochemical parameters
All subjects had normal ammonia levels at the time of study. Plasma glutamine levels were normal in all three OTCD subjects with a trend towards elevated glutamine in the symptomatic patient. In subjects 2 and 3, alanine and lactate were elevated (Table 2).
Table 2.
This table shows the results of biochemical data of our study subjects obtained on the day of study. Normal control ranges from our laboratory are shown in parentheses. An asterix (*) is used to indicate a value outside of the reference range.
| Subject 1 | Subject 2 | Subject 3 | Subject 4 | |
|---|---|---|---|---|
| (III.1.) | (III.3.) | (II.2.) | (Control) | |
| Ammonia (11–32) umol/L) | 20 | 14 | 28 | 25 |
| Asparagine (14–49 umol/L) | 110* | 67* | 79* | 56* |
| Glutamine (414–863 umol/L) | 559 | 717 | 547 | 408 |
| Alanine (220–620 umol/L) | 421 | 766* | 676* | 292 |
| Orotic Acid (0–4.0 ug/gU Cr) | 0.2 | 1.8 | 0.6 | 0.1 |
| Lactic Acid (ug/g U Cr) | 0 | 44.88* | 60.46* | 0 |
| Protein intake (gm protein/kg weight) |
1.75 | 0.6 | 0.79 | 0.77 |
indicates elevated level
Stable isotope studies revealed subject 2 to have 33% of normal 15N incorporation into urea. Subjects 1 and 3 had values mildly below average (Figure 3).
Dietary information
Subject 1 consumed a normal amount of dietary protein. Subject 2 was restricted to about 0.6 gm/kg/day at the time of study. Subject 3 self-restricted protein to 0.8 gm/kg.
Neuroimaging
High resolution Sagittal T1, Axial T1,T2, FLAIR, and coronal images were reviewed by a neuroradiologist who found no structural abnormalities in gray or white matter (data not presented).
1H MRS
Myoinositol was decreased in FWM, PWM, PCGM, and THA (Figure 4a–d and Figure 5a) in both the symptomatic and asymptomatic sister. The degree of mI decrease was inversely correlated with the disease severity score, a measure reflecting total number of hyperammonemic episodes and coma and IQ scores. Choline was decreased in both OTCD subjects in the frontal white matter, especially in the symptomatic sister (Figure 4b).
Figure 4.

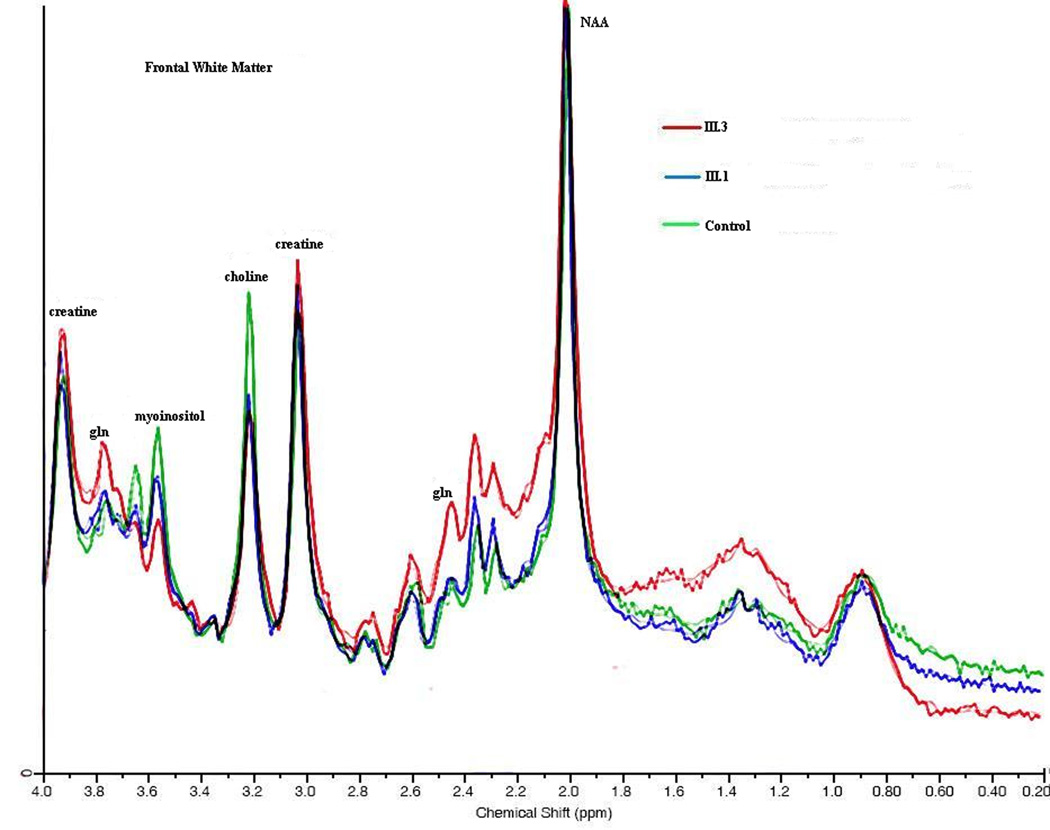
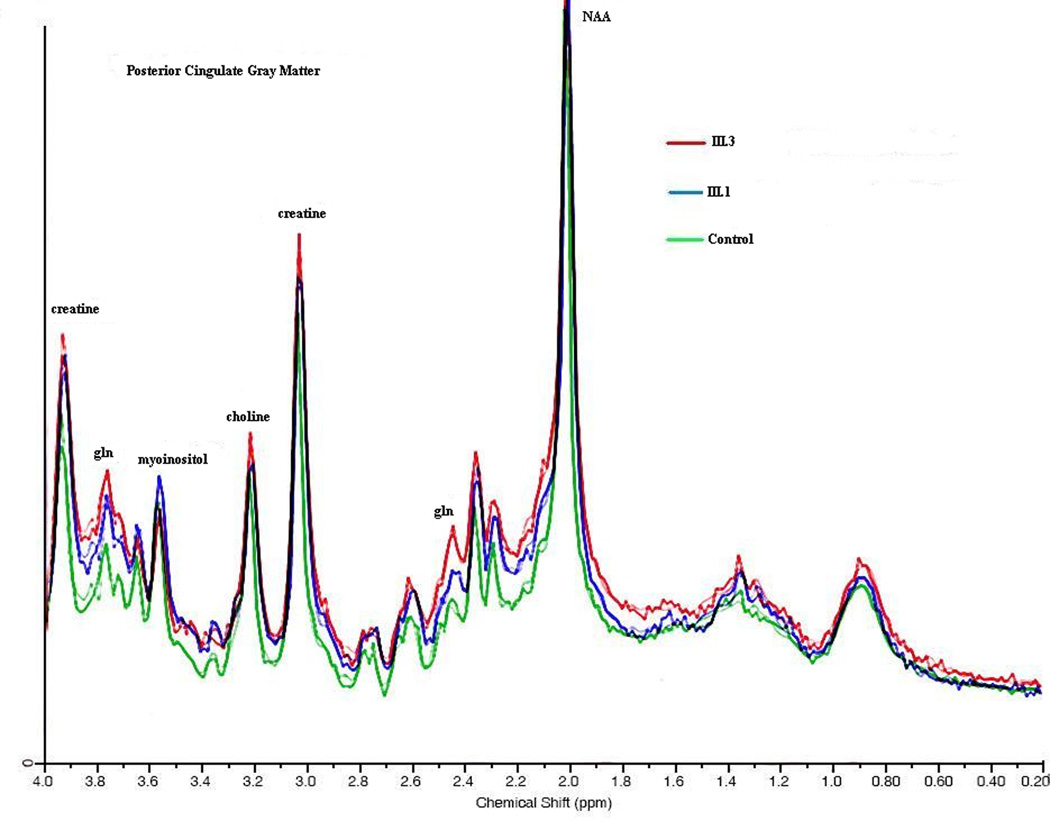
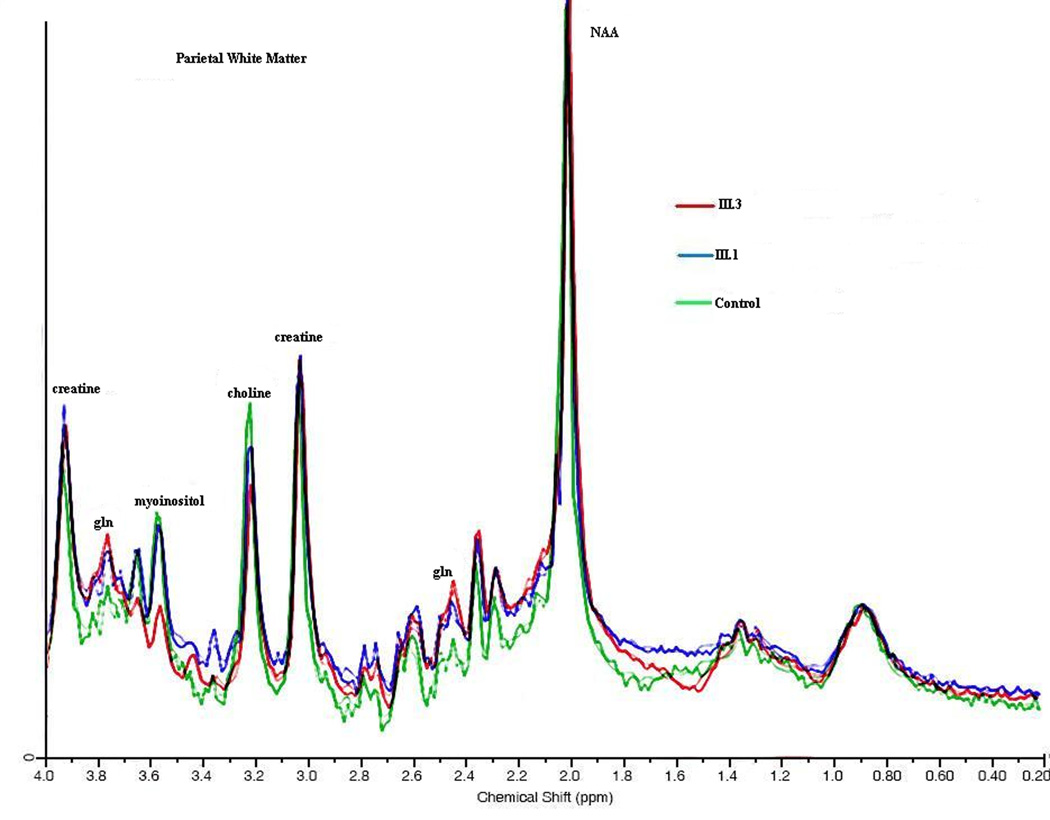
1H MRS: an overlay of the two sisters and normal control is seen taken from the posterior parietal white matter. NAA, myoinositol, choline, creatine peak heights are shown. Absolute concentrations are shown in figure 5.
Figure 5.
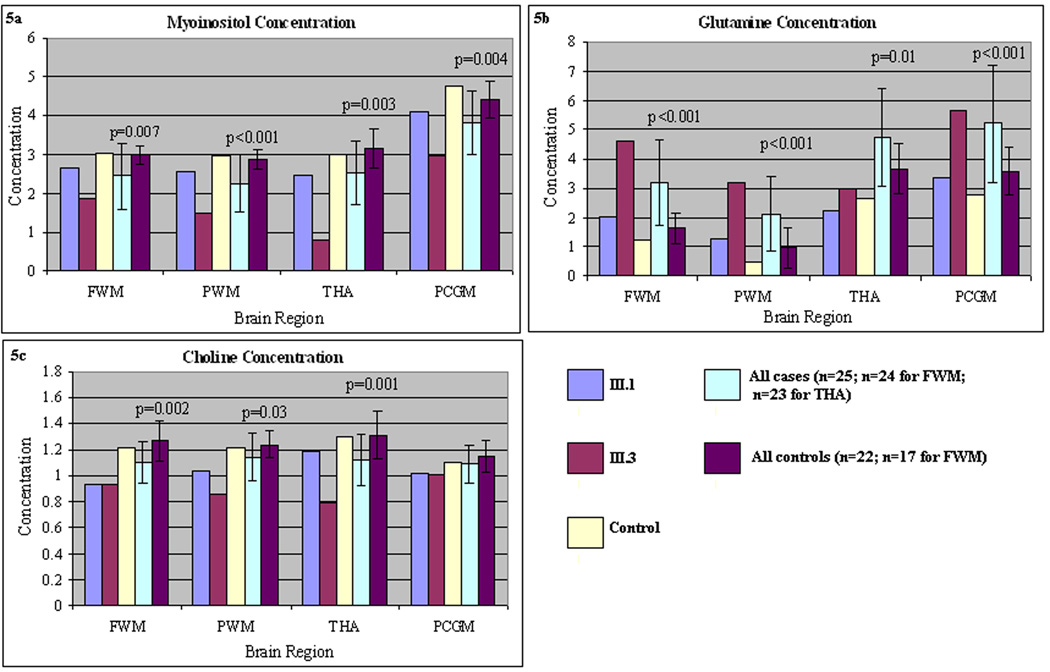
a–c: Absolute concentration of mI in four brain regions (FWM, PWM, PCGM, and tha). Note inverse correlation between clinical symptoms and [mI]. These are compared to a control subject, pooled additional subjects with partial OTCD, and a set of additional control subjects. Error bars depict range of [mI] in a set of control subjects studied as part of a larger imaging study.
Even though subjects were imaged when clinically stable, the glutamine concentration in both sisters was elevated in the frontal gray matter and parietal gray matter (Figure 4a and c).
Discussion
We found decreased levels of mI in the PWM and FWM of subjects with OTCD. The diminished concentration inversely correlated with the disease severity score, a measure of previous hyperammonemic episodes. Previous studies, by our group and others [13–16], shows that relative depletion of brain myoinositol as determined with 1H MRS is a biomarker of OTCD, including asymptomatic carriers [16]. Here, we found that the concentration of brain myoinositol inversely correlated with clinical phenotype in three female members of a family with a known OTCD mutation that previously was associated with lethal, neonatal onset disease in a hemizygous male infant. We also measured competence of ureagenesis with an in vivo stable isotope study that involved conversion of 15NH3 to [15N] urea and [5-15N]glutamine. Cases 1 and 3 had near normal residual ureagenesis, but 1H MRS still disclosed a brain metabolic derangement with regard to the myoinositol level. We hypothesize that mI decrements may mark prior hyperammonemic episodes and/or represent a marker of vulnerability. We have studied additional cases and controls with partial OTCD and have found this finding to hold true (manuscript submitted).
This observation may provide a metabolic etiology of the cognitive impairments that may typify even ostensibly asymptomatic female heterozygotes. Diminished myoinositol levels suggest injury in the deep white matter. The role of mI in the brain is not clear, but it has been shown to play a role as an important osmolyte to maintain water homeostasis in astrocytes. The mI signal in MRS is a composite signal with the bulk of the contributions coming from mI itself. It may be that a rise of astrocytic glutamine in response to elevated ammonia tends to increase water content and glial swelling [22]. In response, the astrocytes release mI in an effort to restore normal cell volume.
Our findings have possible implications for clinical practice and in particular, dietary management to prevent cognitive sequelae of hyperammonemia or its effects.
We propose that 1H MRS of brain is a practical method to identify carriers of OTCD and assess the severity of the clinical syndrome in individual cases. Futher studies to evaluate the underlying neural networks underlying the metabolic changes are being actively investigated.
Acknowledgments
A.L.G. is supported by an NCRR career development award K12RR17613. Parts of the study were also supported by U54RR019453-04 and 1M01RR020359-010058. We thank Drs. Peter Barker and Brian Ross for helpful comments about the manuscript. The authors would like to thank the subjects for their dedication to and participation in this study.
Abbreviations
- CTMT
comprehensive trail making test
- OTCD
ornithine transcarbamylase deficiency
- OFC
orbital frontal circumference
- 1H MRS
proton magnetic resonance spectroscopy
- FWM
frontal white matter
- PCGM
posterior cerebral gray matter
- PWM
parietal white matter
- tha
thalamus
Footnotes
Publisher's Disclaimer: This is a PDF file of an unedited manuscript that has been accepted for publication. As a service to our customers we are providing this early version of the manuscript. The manuscript will undergo copyediting, typesetting, and review of the resulting proof before it is published in its final citable form. Please note that during the production process errors may be discovered which could affect the content, and all legal disclaimers that apply to the journal pertain.
References
- 1.Brusilow SW, Beaudet AL, Valle D, Sly WS, Childs B, Kinzler KW, Vogelstein B, editors. The Metabolic and Molecular Bases of Inherited Disease. 8th ed. New York: McGraw-Hill; pp. 1909–1964. Year. [Google Scholar]
- 2.Caldovic L, Morizono H, Gracia Panglao M, Gallegos R, Yu X, Shi D, Malamy MH, Allewell NM, Tuchman M. Cloning and expression of the human N-acetylglutamate synthase gene. Biochem. Biophys. Res. Commun. 2002;299:581–586. doi: 10.1016/s0006-291x(02)02696-7. [DOI] [PubMed] [Google Scholar]
- 3.Caldovic L, Morizono H, Panglao MG, Cheng SF, Packman S, Tuchman M. Null mutations in the N-acetylglutamate synthase gene associated with acute neonatal disease and hyperammonemia. Hum Genet. 2003;112:364–368. doi: 10.1007/s00439-003-0909-5. [DOI] [PubMed] [Google Scholar]
- 4.Dionisi-Vici C, Rizzo C, Burlina AB. Inborn errors of metabolism in the Italian pediatric population: a national retrospective survey. J. Pediatr. 2002;140:321–327. doi: 10.1067/mpd.2002.122394. [DOI] [PubMed] [Google Scholar]
- 5.Brusilow SW, Maestri NE. Urea cycle disorders: diagnosis, pathophysiology, and therapy. Adv. Pediatr. 1996;43:127–170. [PubMed] [Google Scholar]
- 6.Batshaw ML, Msall M, Beaudet AL, Trojak J. Risk of serious illness in heterozygotes for ornithine transcarbamylase deficiency. J. Pediatr. 1986;108:236–241. doi: 10.1016/s0022-3476(86)80989-1. [DOI] [PubMed] [Google Scholar]
- 7.Christodoulou J, Qureshi IA, McInnes RR, Clarke JT. Ornithine transcarbamylase deficiency presenting with stroke-like episodes. J. Pediatr. 1993;122:423–435. doi: 10.1016/s0022-3476(05)83432-8. [DOI] [PubMed] [Google Scholar]
- 8.Mamourian AC, du Plessis A. Urea cycle defect: a case with MR and CT findings resembling infarct. Pediatr. Radiol. 1991;21:594–595. doi: 10.1007/BF02012608. [DOI] [PubMed] [Google Scholar]
- 9.Pridmore CJ, Clarke JT, Blaser S. Ornithine transcarbamylase deficiency in females: an often overlooked cause of treatable encephalopathy. J. Child. Neurol. 1995;10:339–374. doi: 10.1177/088307389501000506. [DOI] [PubMed] [Google Scholar]
- 10.Yudkoff M, Daikhin Y, Nissim I, Jawad A, Wilson J, Batshaw M. In vivo nitrogen metabolism in ornithine transcarbamylase deficiency. J. Clin. Invest. 1996;98:2167–2173. doi: 10.1172/JCI119023. [DOI] [PMC free article] [PubMed] [Google Scholar]
- 11.Gyato K, Wray J, Huang ZJ, Yudkoff M, Batshaw ML. Metabolic and neuropsychological phenotype in women heterozygous for ornithine transcarbamylase deficiency. Ann. Neurol. 2004;55:80–86. doi: 10.1002/ana.10794. [DOI] [PubMed] [Google Scholar]
- 12.Gropman AL, Batshaw ML. Cognitive outcome in urea cycle disorders. Mol. Genet. Metab. 2004;81:1:S58–1:S62. doi: 10.1016/j.ymgme.2003.11.016. [DOI] [PubMed] [Google Scholar]
- 13.Connelly A, Cross JH, Gadian DG, Hunter JV, Kirkham FJ, Leonard JV. Magnetic resonance spectroscopy shows increased brain glutamine in ornithine carbamoyl transferase deficiency. Pediatr Res. 1993;33:77–81. doi: 10.1203/00006450-199301000-00016. [DOI] [PubMed] [Google Scholar]
- 14.Takanashi J, Kurihara A, Tomita M, Kanazawa M. Distinctly abnormal brain metabolism in late-onset ornithine transcarbamylase deficiency. Neurology. 2002;59:210–214. doi: 10.1212/wnl.59.2.210. [DOI] [PubMed] [Google Scholar]
- 15.Takanashi J, Barkovich AJ, Cheng SF. Brain MR imaging in neonatal hyperammonemic encephalopathy resulting from proximal urea cycle disorders. A.J.N.R. 2003;24:1184–1187. [PMC free article] [PubMed] [Google Scholar]
- 16.Gropman A, Hailu A, Seltzer R, Fricke ST, vanMeter J Urea Cycle Rare Disorders Consortium. Preliminary experience with 1H Magnetic resonance spectroscopy at 3T detects altered brain metabolism in subjects with partial ornithine transcarbamylase deficiency (OTCD) Molec.Genet. Metab. 2007;90:253. [Google Scholar]
- 17.Hata A, Setoyama C, Shimada K, Takeda E, Kuroda Y, Akaboshi I, Matsuda I. Ornithine transcarbamylase deficiency resulting from a C-to-T substitution in exon 5 of the ornithine transcarbamylase gene. Am. J. Hum. Genet. 1989;45:123–127. [PMC free article] [PubMed] [Google Scholar]
- 18.Provencher SW. Estimation of metabolite concentrations from localized in vivo proton NMR spectra. Magn. Reson. Med. 1993;30:672–679. doi: 10.1002/mrm.1910300604. [DOI] [PubMed] [Google Scholar]
- 19.Kreis R, Ernst T, Ross BD. Development of the human brain: in vivo quantification of metabolite and water content with proton magnetic resonance spectroscopy. Magn. Reson. Med. 1993;30:424–437. doi: 10.1002/mrm.1910300405. [DOI] [PubMed] [Google Scholar]
- 20.Kreis R. Issues of spectral quality in clinical 1H-magnetic resonance spectroscopy and a gallery of artifacts. NMR Biomed. 2004;17:361–381. doi: 10.1002/nbm.891. [DOI] [PubMed] [Google Scholar]
- 21.Cavassila S, Deval S, Huegen C, van Ormondt D, Graveron-Demilly D. Cramer-Rao bounds: an evaluation tool for quantitation. NMR. Biomed. 2001;14:278–283. doi: 10.1002/nbm.701. [DOI] [PubMed] [Google Scholar]
- 22.Isaacks RE, Bender AS, Kim CY, Shi YF YF, Norenberg MD. Effect of osmolality and anion channel inhibitors on myo-inositol efflux in cultured astrocytes. J. Neurosci. Res. 1999;57:866–871. [PubMed] [Google Scholar]