

Abstract
A common model for studying Chlamydia trachomatis and growing chlamydial stocks uses Lymphogranuloma venereum serovar L2 and non-polarized HeLa cells. However, recent publications indicate that the growth rate and progeny yields can vary considerably for a particular strain depending on the cell line/type used, and seem to be partially related to cell tropism. In the present study, the growth of invasive serovar L2 was compared in endometrial HEC-1B and endocervical HeLa cells polarized on collagen-coated microcarrier beads, as well as in HeLa cells grown in tissue culture flasks. Microscopy analysis revealed no difference in chlamydial attachment/entry patterns or in inclusion development throughout the developmental cycle between cell lines. Very comparable growth curves in both cell lines were also found using real-time PCR analysis, with increases in chlamydial DNA content of 400–500-fold between 2 and 36 h post-inoculation. Similar progeny yields with comparable infectivity were recovered from HEC-1B and HeLa cell bead cultures, and no difference in chlamydial growth was found in polarized vs. non-polarized HeLa cells. In conclusion, unlike other C. trachomatis strains such as urogenital serovar E, invasive serovar L2 grows equally well in physiologically different endometrial and endocervical environments, regardless of the host cell polarization state.
Keywords: CHLAMYDIA TRACHOMATIS, LGV, BEAD CULTURE, HEC-1B CELLS, HELA CELLS, MICROSCOPY, REAL-TIME PCR
1. Introduction
Chlamydia trachomatis is an obligate intracellular bacterial pathogen responsible for an estimated 3–4 million new cases of sexually transmitted infections every year in the United States [1]. Urogenital serovars D—K are associated with pelvic inflammatory disease, salpingitis, ectopic pregnancy and infertility in women, and with epididymitis and proctitis in men. Strains of Lymphogranuloma venereum (LGV; serovars L1–L3) cause more systemic infections that result in genital ulcers, inguinal lymphadenopathy, and acute proctitis in men. Although LGV cases remain mostly sporadic in the U.S. and other industrialized countries, outbreaks of LGV-associated proctitis were recently reported in Europe [2, 3].
Chlamydiae have a unique developmental cycle that begins with attachment of infectious but metabolically inactive elementary bodies (EB) to host cell surfaces. Following bacterial entry, proposed to occur via several mechanisms [4, 5], the chlamydial vacuole rapidly exits the endocytic pathway and intracellular EB differentiate into metabolically active reticulate bodies (RB). These RB, present in the endocytic vesicle, termed the chlamydial inclusion at that stage, actively replicate by binary fission for several hours and eventually redifferentiate into EB; intermediate bodies that represent transitional forms between EB and RB can also be observed during the differentiation and redifferentiation steps. Completion of the developmental cycle usually occurs after 48 to 72 hours by release of the infectious chlamydial progeny from infected host cells by cell lysis and/or partial or complete inclusion extrusion [6, 7].
As more data become available, it appears that the culture conditions and nature of the host cells used to grow chlamydiae in vitro are important parameters that influence growth and infectivity of the organisms. Indeed, intriguing differences in various aspects of chlamydial biology and pathogenesis were found when eukaryotic cells were cultured in a polarized manner compared to cells grown as flat monolayers in tissue culture flasks or plates (reviewed in 8). For instance, C. trachomatis serovar E EB progeny recovered from McCoy cell fibroblasts grown on collagen-coated microcarrier beads in a 3D culture system were higher in numbers and more infectious on a per particle ratio basis, because of an accelerated developmental cycle, compared to the progeny collected from McCoy cells grown in flasks [9, 10]; in addition, the harvested chlamydiae always exhibited significantly higher infectious titers in more relevant genital epithelial cells than in McCoy cells. An epithelial cell environment appears important for optimal chlamydial growth but the anatomical origin of the cell lines used seems to be critical as well, as emphasized by recent studies [11, 12]. For instance, Miyairi et al. [12] showed that cell lines originating from different anatomical sites, e.g. genital tract vs. conjunctiva, better support the growth of C. trachomatis strains with a tropism for this particular site, i.e. genital vs. ocular strains. Of note, infectious titers obtained by these authors for genital serovar L2 in conjunctival cells were lower than those in endocervical HeLa cells, although the drop in infectivity was not nearly as dramatic as that for serovar D. Also, very recently, using polarized genital epithelial cells grown in 3D bead cultures, our group found that C. trachomatis serovar E grows faster in endometrial HEC-1B than in endocervical HeLa cells, which resulted in the recovery of ca. 4 times more chlamydial progeny in the former cell line upon completion of the developmental cycle [13]; other authors reported a 10-fold difference in the number of serovar E infectious progeny recovered between these two cell lines [14]. These differences in recoverable bacterial yields are potentially important, as collecting sufficient numbers of chlamydiae for downstream applications can sometimes be challenging and time-consuming, particularly when studying urogenital strains. The latter challenges may explain why the more invasive and faster growing C. trachomatis LGV serovar L2 is probably the most commonly used prototype strain in the field, despite a low clinical significance in Western countries and differences in the biology of this organism compared to D—K strains.
In this follow-up study to Guseva et al. [13], the growth of C. trachomatis serovar L2 was compared in endometrial HEC-1B and endocervical HeLa cells polarized on microcarrier beads, as well as in the more commonly used HeLa cells plated in tissue culture flasks; chlamydial progeny yields and infectivity were also determined. The objectives were to assess if, as observed for serovar E, the in vitro growth of this popular LGV strain is influenced by the anatomical origin of the genital epithelial cells used, and/or by the polarization state of these cells.
2. Materials and Methods
2.1. Cell lines and chlamydiae
The transformed endometrial HEC-1B and endocervical HeLa epithelial cell lines were maintained at 37 °C in minimum essential medium (MEM, Gibco, Grand Island, NY) containing Hank’s salts and supplemented with 2 mM L-glutamine and 10% fetal bovine serum. Cell lines were monitored regularly to ensure the absence of mycoplasma contamination.
Chlamydia trachomatis serovar L2 (strain L2/434/Bu) was propagated in HEC-1B cells grown in 150 cm2 tissue culture flasks. Crude chlamydial stocks were collected at 48 h post-infection (hpi) using a standard protocol [15], and were then resuspended in 2-SPG (0.2 M sucrose, 0.02 M phosphate buffer, and 5 mM L-glutamine), aliquoted and stored at −80 °C. Subsequently, the infectious titer of each chlamydial stock was determined in HEC-1B and HeLa cells grown in 24-well tissue culture plates, and expressed as a percent infectivity. Numbers of inclusions were counted in 20 random microscopic grid fields at 400 X magnification on a Leitz Dialux 22 microscope equipped with 495-nm excitation and 520-nm emission filters (Leitz, Inc., Rockleigh, NJ). All titrations were performed in triplicate.
2.2. Bead cultures
Suspension cultures of HEC-1B and HeLa cells grown on Cytodex collagen-coated microcarrier beads (Sigma-Aldrich, Inc., St-Louis, MO) were set up and inoculated with chlamydiae, as recently described by Guseva et al. ([13]; 250-ml spinner bottle size). Briefly, after the beads were allowed to settle down and four-fifths of the medium was removed, the cultures of HEC-1B and HeLa cells were inoculated with C. trachomatis serovar L2 at a multiplicity of infection (MOI) of 1. Following a 2-h adsorption step at 35 °C in a slow gyratory incubator shaker, fresh culture medium containing 0.5 µg/ml cycloheximide and 10 µg/ml gentamicin was added, and the cultures were incubated at 37 °C on a magnetic stir plate. At various times post-infection, bead culture samples were collected for immunofluorescence, transmission electron microscopy (TEM) and real-time PCR (qPCR) analyses.
2.3. Chlamydial growth in HeLa cells seeded on beads or in tissue culture flasks
In a set of experiments, the growth of serovar L2 was compared in HeLa cells seeded either on beads (250 ml spinner bottle; polarized culture) or in more commonly used tissue culture flasks (75 cm2 size or T-75; non-polarized culture). Bead culture bottles and T-75 flasks were inoculated with serovar L2 at a MOI of 1, and subsequently incubated in Hank’s medium containing 0.5 µg/ml cycloheximide and 10 µg/ml gentamicin. In these experiments, a separate T-75 flask was used for each sampling time and was then processed as follows: infected cell monolayers were scraped in the original culture medium and were equally divided between two 15-ml centrifuge tubes. Cells were pelleted at 500 X g for 5 min; one cell pellet was processed for TEM in parallel with bead culture samples from the same time-course experiment; the other cell pellet was used for real-time PCR analysis of the chlamydial infection (see below).
2.4. Immunofluorescence
Bead culture samples were collected at various times post-infection (6–48 hpi) and were stained for chlamydial particles/inclusions. Briefly, the beads were allowed to settle down, were washed once in PBS and then fixed for 30 min at room temperature with ice-cold absolute methanol. After a wash in PBS, ca. 100 µl of FITC-conjugated Pathfinder Chlamydia trachomatis Direct Specimen Monoclonal Antibody (Bio-Rad Laboratories, Redmond, WA) were added, and the samples were incubated for 20 min at 37 °C. The excess antibody solution was subsequently removed and replaced by a few drops of fluorescence mounting medium (DakoCytomation, Dako North America Inc., Carpinteria, CA). Stained samples were then observed using a Zeiss Axiovert S100 microscope equipped with an AxioCam Color digital CCD camera. Images were captured using the Zeiss AxioCam Photoshop software, adjusted in Adobe Photoshop, and analyzed.
2.5. Transmission electron microscopy
After removal of the culture medium, bead culture samples and cell pellets collected from T-75 flasks were rinsed once with PBS and fixed with TEM-Epon fixative (2% glutaraldehyde / 0.5% paraformaldehyde in 0.1M sodium cacodylate buffer, pH 7.2) for 1–2 h at room temperature. Samples were then agar-enrobed, processed for embedding in Epon-Araldite 812 resin [16], and examined in a Phillips Tecnai-10 electron microscope (FEI) operated at 60 kV.
2.6. Real-time PCR analysis
Bead culture samples and cell pellets collected from T-75 flasks were washed 1 X with PBS. The loosened bead or cell pellets were then resuspended in 1 volume of RLT lysis buffer (RNeasy mini kit, Qiagen, Valencia, CA) containing β-mercaptoethanol, homogenized by repeated pipetting through a syringe-needle and stored at −80 °C until all samples were collected. After rapid thawing, bead culture lysates were proteinase K-treated as previously described (13), processed along with the T-75 cell lysates for total RNA and genomic DNA (gDNA) isolation, and finally analyzed by qPCR for host gDNA content, as well as for chlamydial genome and transcript copy numbers. Primer sets used in this study were specific for C. trachomatis CT446/euo and CT443/omcB [17] and for two human genes located on different chromosomes, i.e. myeloperoxidase (MPO) and coagulation factor VIII (F8). In all qPCR assays, performed with a SYBR green detection system, quantitation of the specific target genes in experimental samples was based on the use of a known standard curve, included in each run. A stock solution of gDNA isolated from Percoll-purified serovar L2 EB was used to generate standard curves in all euo and omcB assays, allowing the determination of chlamydial genome and transcript copy numbers in bead culture and T-75 flask samples. Similarly, serial dilutions of uninfected HeLa cell gDNA were used in the MPO- and F8-specific qPCR assays to evaluate the relative host cell gDNA content in each sample. Chlamydial genome as well as euo and omcB transcript levels in experimental samples were finally normalized to host gDNA amounts (averaged MPO and F8 relative amounts), and expressed as copy numbers per ng of host gDNA [13].
2.7. Progeny counts and titration
A 250-ml bead culture of HEC-1B and of HeLa cells were inoculated with serovar L2 (MOI of 1) as described above. A small aliquot of culture was sampled for both cell lines at 2 and 24 hpi, and processed for qPCR analysis of chlamydial genome numbers (normalized to host cells) to ensure that the two bead cultures received a similar inoculum dose, a factor that could otherwise affect the yield of progeny collected. At 48 hpi, the chlamydial progeny were harvested and Percoll-purified as described by Guseva et al (13), and the final EB pellets were resuspended in a fixed volume of 2-SPG and counted by OD reading at 750 nm. For infectious titer determination, chlamydial progeny suspensions collected from all bead cultures were adjusted to 1 × 10⁹ particles/ml and titered in HEC-1B and HeLa cells plated in 24-well plates as described above.
2.8. Statistical analyses
Statistical analyses were performed by using the Student t test; p-values ≤0.05 were considered as significant.
3. Results
3.1. Growth of C. trachomatis serovar L2 in HEC-1B and HeLa cells seeded on beads, as monitored by fluorescence and transmission electron microscopy
Bead cultures of HEC-1B and HeLa cells were inoculated with C. trachomatis serovar L2 and monitored at various times post-infection (6–48 hpi). Fluorescence microscopy analysis of early EB interactions with host cells showed that serovar L2 attachment to/entry into polarized HEC-1B and HeLa cells was evenly distributed throughout the monolayers, as observed at 6 hpi (Fig. 1A and D). Inclusion size and distribution also appeared comparable in both cell lines at 12 hpi (Fig. 1B, E), 24 hpi (Fig. 1C, F) and at later times (data not shown).
Fig. 1.
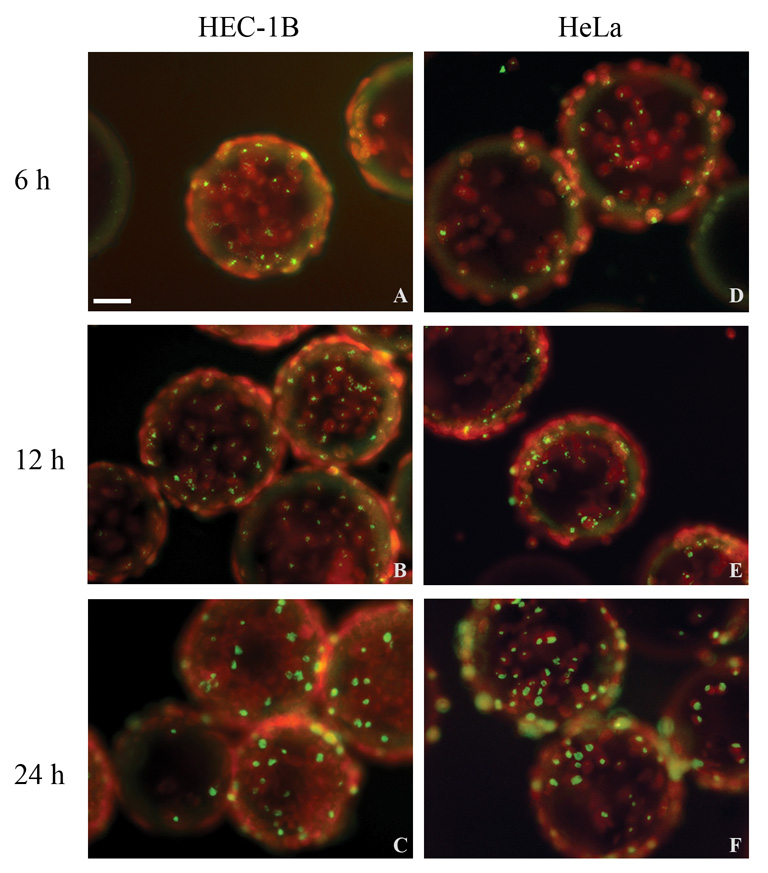
Fluorescence microscopy analysis of C. trachomatis serovar L2-infected HEC-1B and HeLa cells grown on microcarrier beads. Representative fields from bead culture samples of infected HEC-1B (A–C) and HeLa (D–F) cells collected at 6 hpi (A,D), 12 hpi (B,E) and 24 hpi (C,F) are shown. Chlamydiae were stained with FITC-conjugated specific antibodies and appear yellow/green; eukaryotic cells, counterstained with Evans Blue, appear red. Bar = 50 µm.
Transmission electron microscopy examination of L2-infected cells showed that initial EB to RB differentiation was already detected by 6 hpi in both infected HEC-1B (Fig. 2A) and HeLa (Fig. 2D) cells grown on beads and, by 12 hpi, early inclusions contained a few RB (Fig. 2B, E). At later stages, inclusion size and content appeared very similar in both cell lines, as illustrated in Fig. 2C and F, where a mixed population of RB and particles maturing into intermediate bodies or EB were observed at 24 hpi.
Fig. 2.
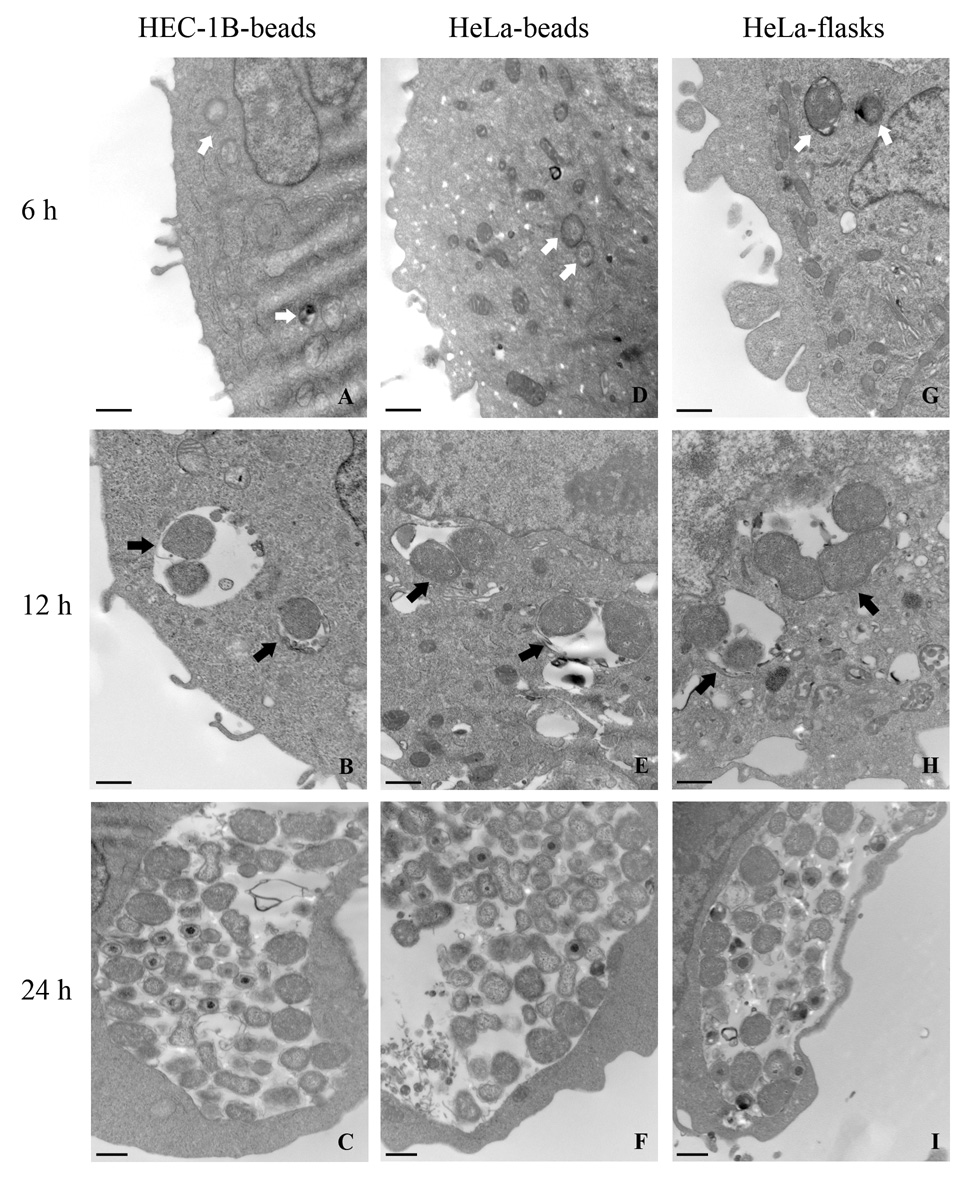
Transmission electron micrographs of C. trachomatis serovar L2 early development in HEC-1B and HeLa cells grown on microcarrier beads and in HeLa cells seeded in tissue culture flasks. The two left panels represent HEC-1B cells (A–C) and HeLa cells (D–F) from infected bead cultures; the right panel (G–I) represents infected HeLa cells collected from tissue culture flasks. The times (6–24 hpi) at which bead culture samples were collected are also indicated. Bar = 500 nm.
3.2. Growth of C. trachomatis serovar L2 in polarized HEC-1B and HeLa cells as monitored by real-time PCR
The number of chlamydial genomes in serovar L2-infected HEC-1B and HeLa cells grown on beads was monitored by qPCR throughout the developmental cycle (2–48 hpi), and normalized to host DNA content as an indirect measurement of the chlamydial growth. As expected, only a very slight increase in the number of chlamydial genomes was detected in the early stages of the infection, i.e. 2–6 hpi, with ca.1.5-2-fold changes in both cell lines (Fig. 3). Between 6 and 24 hpi, a more dramatic increase in the number of normalized chlamydial genomes was found, with ca. a 150-fold increase in both HEC-1B and HeLa cells. From 24 to 48 hpi, no/minimal chlamydial genome replication was observed. The overall fold-increase in serovar L2 normalized genome/particle numbers throughout the developmental cycle was slightly higher in HEC-1B cells compared to HeLa cells grown on beads; however, this difference was not significant (p=0.175), with 514 (±178)- and 401 (±66.5)-fold increases, respectively. The comparable growth of serovar L2 in both endometrial and endocervical cells was further confirmed by real-time PCR analysis of chlamydial euo and omcB transcript levels, which showed no difference in the timing and intensity of expression of these transcripts between cell lines (data not shown).
Fig. 3.
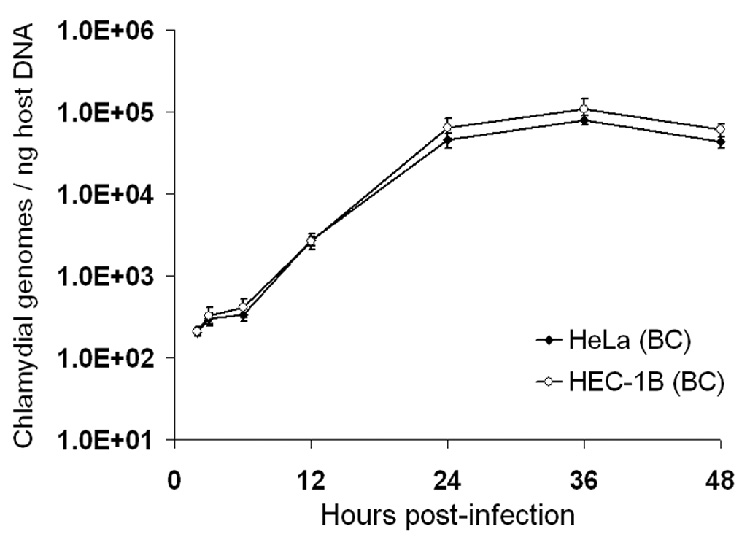
Real-time PCR analysis of C. trachomatis serovar L2 growth in HEC-1B and HeLa cells seeded on microcarrier beads. Chlamydial genomes were quantitated from cultures collected at 2, 3, 6, 12, 24, 36 and 48 hpi using euo- and omcB-specific primers and purified EB gDNA as standards. Host cell gDNA content in each of the samples was also determined, using primer sets for two human independent target genes and purified HeLa cell gDNA standards. The X-axis represents the time post-infection; the Y-axis represents the number of chlamydial genomes, normalized to host gDNA content, and expressed as copy numbers per ng of host DNA. The data shown are from a representative time-course experiment and represent average results from triplicate qPCR wells and two independent runs (± SD).
3.3. Yield and infectivity of serovar L2 progeny recovered from polarized HEC-1B and HeLa cells grown on beads
Bead cultures of HEC-1B and HeLa cells were inoculated with serovar L2 under the same conditions; the chlamydial progeny were then harvested and titered at 48 hpi. As documented in Fig. 4A, real-time PCR analysis confirmed that a similar inoculum dose was used in the two cell line bead cultures, with average chlamydial genome numbers at 2 hpi of 152.04 (± 21.40) and 106.55 (± 25.85) / ng of host gDNA for HEC-1B and HeLa cell cultures, respectively (not significantly different average values, p=0.079); comparable bacterial genome copy numbers were also found at 24 hpi in both bead cultures. The yields of chlamydial progeny from HEC-1B and HeLa bead cultures were very similar and routinely close to 5 × 10¹⁰ particles, e.g. 5.4 × 10¹⁰ for HEC-1B and 4.9-5.6 × 10¹⁰ for HeLa cells.
Fig. 4.
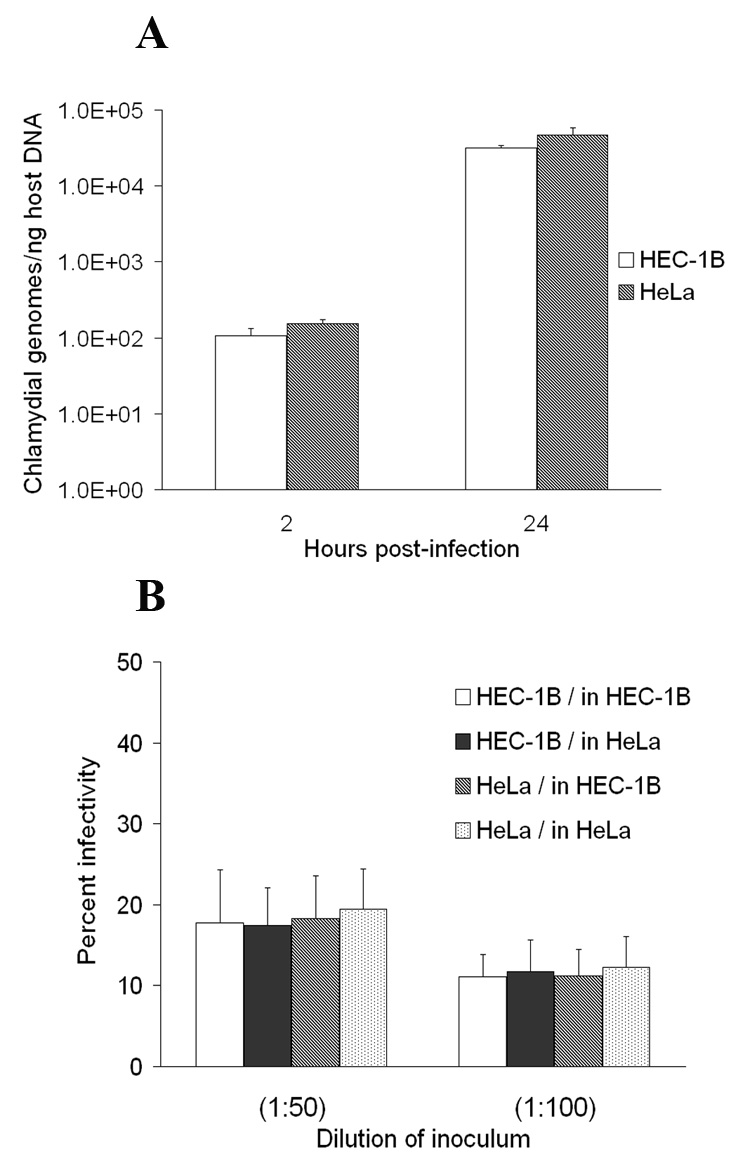
Titration of the C. trachomatis serovar L2 progeny recovered from HEC-1B and HeLa cells grown on microcarrier beads. (A) For each bead culture, aliquots were collected at 2 and 24 hpi and processed for gDNA isolation; chlamydial genome numbers were then quantitated by qPCR using euo- and omcB-specific primers and purified EB gDNA as standards. Host cell gDNA content was also determined using primer sets for two human independent target genes and purified HeLa cell gDNA standards. The X-axis represents the time post-infection; the Y-axis represents the number of chlamydial genomes, normalized to host gDNA content, and expressed as copy numbers per ng of host DNA. The graphs show data from a representative time-course experiment, and average results from triplicate qPCR wells and two independent runs (± SD). (B) Serovar L2 progeny recovered at 48 hpi from HEC-1B and HeLa cell bead cultures were counted by OD reading, adjusted to 1 × 10⁹ particles/ml and titered on both HEC-1B and HeLa cell monolayers on coverslips. The X-axis represents the dilution of the “adjusted” chlamydial stock; the Y-axis represents infectivity titers, expressed as a percent of chlamydiae-infected cells, as determined by fluorescence microscopy. The data shown represent the average percent infectivity (± SD); triplicate wells were used and 20 grid fields/well were counted at a magnification of × 400.
Infectious titers on a per particle basis of serovar L2 progeny harvested from HEC-1B and HeLa cell bead cultures were then compared, after both harvests were adjusted to 1 × 10⁹ particles/ml. Titration on fresh monolayers of non-polarized HEC-1B and HeLa cells revealed no difference in the infectivity levels of the two chlamydial harvests, regardless of the cell line used for the growth of chlamydiae or for the titration (Fig. 4B).
3.4. Growth of serovar L2 in HeLa cells seeded on beads vs. in tissue culture flasks
Many investigators grow their chlamydial stocks in non-polarized HeLa cells plated in tissue culture flasks and use C. trachomatis serovar L2 as their prototype strain. For this reason, we compared the growth of serovar L2 in HeLa cells using our bead culture system to the growth in more commonly used tissue culture flasks. As observed by TEM, no major differences in the morphology and kinetics of serovar L2 early development in HeLa cells were found, regardless of the culture system used (Fig. 2D–I), with an initial differentiation of EB into RB visible by 6 hpi (compare Fig. 2G and 2D), inclusions containing a few dividing RB at 12 hpi (Fig. 2H vs. 2E), and more numerous and mature particles at 24 hpi (Fig. 2I, 2F). Very similar morphological features were also found at later times (up to 48 hpi) in the two cultures (data not shown). These observations were confirmed by qPCR analysis of normalized chlamydial genomes showing comparable growth curves for serovar L2 in flasks and in bead cultures (Fig. 5). Of note, the kinetics and amplitude of chlamydial euo and omcB transcript level changes were also quite comparable in HeLa cells grown on beads and in flasks throughout the developmental cycle (data not shown).
Fig. 5.
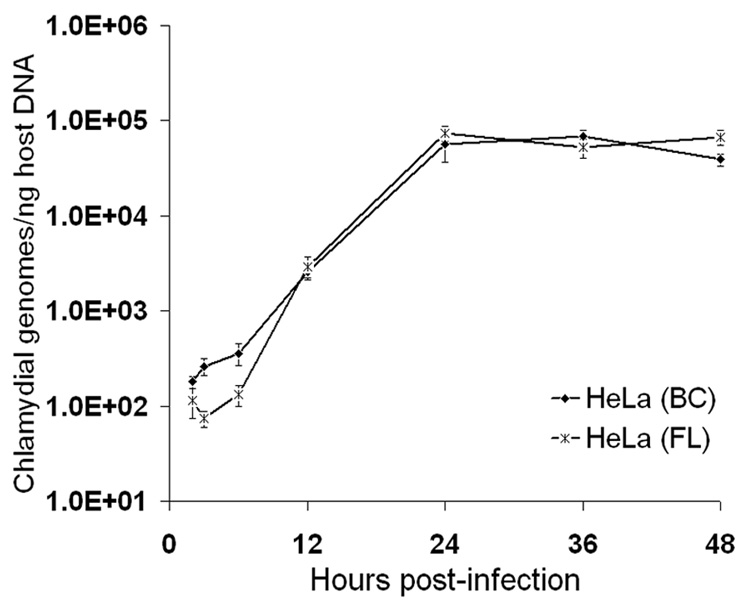
Real-time PCR analysis of C. trachomatis serovar L2 growth in HeLa cells seeded on microcarrier beads or in tissue culture flasks. Chlamydial genomes were quantitated from cultures collected at 2, 3, 6, 12, 24, 36 and 48 hpi using euo- and omcB-specific primers and purified EB gDNA as standards. Host cell gDNA content in each of the samples was also determined, using qPCR primer sets specific for two target genes and purified HeLa cell gDNA standards. The X-axis represents the time post-infection; the Y-axis represents the number of chlamydial genomes, normalized to host gDNA content, and expressed as copy numbers per ng of host DNA. The data shown are from a representative time-course experiment and represent average results from triplicate qPCR wells and two independent runs (± SD).
4. Discussion
As emphasized by several studies, various factors, such as the nature of the host cell used [12] and the cell culture conditions, e.g. polarized vs. non-polarized [8], can dramatically affect in vitro growth characteristics of obligate intracellular chlamydiae. A side-by-side comparison of recently published data from Guseva et al. [13] with this follow-up study, in which bead cultures of HEC-1B and HeLa cells were infected with C. trachomatis non-invasive serovar E and invasive serovar L2, respectively, highlights differences in infection / growth characteristics between these two very different serovars and confirms that different cell lines may support differently the growth of a given chlamydial strain. It is interesting to note that, firstly, serovar L2 attachment to polarized epithelial cell monolayers on beads appeared evenly distributed (Fig. 1A and D) while serovar E EB attachment/entry was rather patchy and clustered throughout both HEC-1B and HeLa cell monolayers [13], a pattern reminiscent of chlamydial attachment to apical surfaces of polarized primary human and pig genital epithelial cells cultured ex vivo [15, 18]. This intriguing difference between strains may possibly be due to the recognition of and binding to different receptor molecules on host cell surfaces that, for serovar E, may be enriched or clustered in some regions or microdomains of polarized epithelial cell apical membranes, such as lipid rafts or caveolae, proposed to be involved in serovar E but not in serovar L2 entry [19, 20]. Although their role in chlamydial entry is still controversial [21–23], it is an interesting possibility, as many pathogens are known to interact with these membrane microdomains and that receptor molecules, such as membrane-associated estrogen receptors that locate to caveolae, have been implicated in serovar E attachment/entry [11, 24]. In contrast, initial interactions of serovar L2 EB with host cell surfaces may occur via recognition of a broader range of host molecules or molecules widely represented throughout cell surfaces, such as heparan sulfate proteoglycans [25], and/or via Tarp-mediated pedestal-like formation [26, 27], a phenomenon shown to be more prevalent for serovar L2 than with serovar D [26] or serovar E [28].
Secondly, the growth of serovar L2 in HEC-1B vs. HeLa cells seeded on beads appeared very comparable when early differentiation and chlamydial progeny number and infectivity were examined. Interestingly, when serovar E was grown in similar conditions and analyzed with the same approach, initial EB-to-RB differentiation was found to occur earlier in endometrial HEC-1B cells compared to endocervical HeLa cells, and higher chlamydial genome and transcript numbers were detected throughout the developmental cycle in the former cell line [13]; these differences were in fact the result of a faster growth of this urogenital strain in the HEC-1B cells, leading to the recovery of ca. 4–10 times more chlamydial progeny compared to HeLa cells [13, 14]. Thus, while physiological differences between endometrial and endocervical cells appear to greatly influence the growth of urogenital serovar E, the more invasive serovar L2 grows equally well in both environments. This finding is quite interesting as these cell lines respond differently to serovar E and L2 infections, in particular in regard to the nature and amount of the cytokines produced [29, 30], which may, in turn, induce different immune responses in the lower vs. upper genital tracts in response to lumenal serovar E vs. invasive LGV infections.
Thirdly, no noticeable differences in the growth curves of serovar L2 in HeLa cells grown on microcarrier beads vs. tissue-culture flasks were detected, as monitored by qPCR, which is somewhat surprising as the polarization state of host cells was previously shown to influence the growth or biology of some chlamydial strains, such as serovar E [8].
In summary, this study, together with previous data obtained using the 3D bead culture model [9, 10, 13], provide an interesting comparison of urogenital serovar E and invasive serovar L2 in vitro infection of genital epithelial cells, and should serve as another reminder that findings reported for LGV strains may not necessarily apply to non-LGV serovars of C. trachomatis. Lastly, adaptation of HeLa cells in vitro to their more relevant low columnar polarized architecture remains problematic and may require a more suitable extracellular matrix for proper signaling [13]. Since luminal serovar E EB exit infected polarized epithelia via the apical domain whereas the invasive, lymphotropic L2 EB exit via the basal domain [16], cytoskeletal organization and trafficking in polarized cells are important and different from that in flattened, 2-dimensional epithelia. Future studies on L2 infection in properly polarized HeLa cells should provide insight into such trafficking patterns and how they affect LGV pathogenesis.
Acknowledgments
The authors would like to thank R.J. Belland (Department of Molecular Sciences, University of Tennessee Health Science Center) who generously provided the sequence for the chlamydiae-specific real-time PCR primers used in this study. We also thank Daniel Phillips for his technical help with inclusion counts. We acknowledge the use of the transmission electron microscope in the Electron Microscopy Core Facility and the use of the Agilent BioAnalyser 2100, robotic workstation Beckman Biomek 2000 and Bio-Rad iCycler in the ETSU Molecular Biology Core Facility.
This work was supported by a Public Health Service grant from the National Institute for Allergy and Infectious Diseases, NIH AI13446 (PBW).
Footnotes
Publisher's Disclaimer: This is a PDF file of an unedited manuscript that has been accepted for publication. As a service to our customers we are providing this early version of the manuscript. The manuscript will undergo copyediting, typesetting, and review of the resulting proof before it is published in its final citable form. Please note that during the production process errors may be discovered which could affect the content, and all legal disclaimers that apply to the journal pertain.
References
- 1.Centers for Disease Control and Prevention. Sexually Transmitted disease Surveillance 2002 Supplement, Chlamydial Prevalence Monitoring Project Annual Report 2002. 2003 [Online] http://www.cdc.gov/std/chlamydia2002/chlamydia2002.pdf.
- 2.Centers for Disease Control and Prevention. Lymphogranuloma venereum among men who have sex with men--Netherlands, 2003–2004. MMWR Morb. Mortal. Wkly Rep. 2004;53:985–988. [PubMed] [Google Scholar]
- 3.Herida M, de Barbeyrac B, Sednaoui P, Scieux C, Lemarchand N, Kreplak G, Clerc M, Timsit J, Goulet V, Desenclos JC, Semaille C. Rectal lymphogranuloma venereum surveillance in France 2004–2005. Euro Surveill. 2006;11:155–156. [PubMed] [Google Scholar]
- 4.Dautry-Varsat A, Subtil A, Hackstadt T. Recent insights into the mechanisms of chlamydia entry. Cell. Microbiol. 2005;7:1714–1722. doi: 10.1111/j.1462-5822.2005.00627.x. [DOI] [PubMed] [Google Scholar]
- 5.Campbell LA, Kuo C-C. In: Chlamydia. Bavoil PM, Wyrick PB, editors. Norfolk, U.K: Genomics and Pathogenesis, Horizon Bioscience; 2006. pp. 505–522. [Google Scholar]
- 6.Todd WJ, Caldwell HD. The interaction of Chlamydia trachomatis with host cells: ultrastructural studies of the mechanism of release of a biovar II strain from HeLa 229 cells. J. Infect. Dis. 1985;151:1037–1044. doi: 10.1093/infdis/151.6.1037. [DOI] [PubMed] [Google Scholar]
- 7.Hybiske K, Stephens R. Mechanisms of host cell exit by the intracellular bacterium Chlamydia. Proc. Natl. Acad. Sci. USA. 104;2007:11430–11435. doi: 10.1073/pnas.0703218104. [DOI] [PMC free article] [PubMed] [Google Scholar]
- 8.Wyrick PB. In: Chlamydia. Bavoil PM, Wyrick PB, editors. Norfolk, U.K: Genomics and Pathogenesis, Horizon Bioscience; 2006. pp. 323–338. [Google Scholar]
- 9.Tam JE, Knight ST, Davis CH, Wyrick PB. Eukaryotic cells grown on microcarrier beads offer a cost-efficient way to propagate Chlamydia trachomatis. Biotechniques. 1992;13:374–378. [PubMed] [Google Scholar]
- 10.Wyrick PB, Gerbig DG, Knight ST, Raulston JE. Accelerated development of genital Chlamydia trachomatis serovar E in McCoy cells grown on microcarrier beads. Microb. Pathog. 1996;20:31–40. doi: 10.1006/mpat.1996.0003. [DOI] [PubMed] [Google Scholar]
- 11.Guseva NV, Dessus-Babus S, Whittimore JD, Moore CG, Wyrick PB. Characterization of estrogen-responsive epithelial cell lines and their infectivity by genital Chlamydia trachomatis. Microbes Infect. 2005;7:1469–1481. doi: 10.1016/j.micinf.2005.05.004. [DOI] [PubMed] [Google Scholar]
- 12.Miyairi I, Mahdi OS, Ouellette SP, Belland RJ, Byrne GI. Different growth rates of Chlamydia trachomatis biovars reflect pathotype. J. Infect. Dis. 2006;194:350–357. doi: 10.1086/505432. [DOI] [PubMed] [Google Scholar]
- 13.Guseva NV, Dessus-Babus S, Moore CG, Whittimore JD, Wyrick PB. Differences in Chlamydia trachomatis serovar E growth rate in polarized endometrial and endocervical epithelial cells grown in three-dimensional culture. Infect. Immun. 2007;75:553–564. doi: 10.1128/IAI.01517-06. [DOI] [PMC free article] [PubMed] [Google Scholar]
- 14.Deka S, Vanover J, Sun J, Kintner J, Whittimore J, Schoborg RV. An early event in the herpes simplex virus type-2 replication cycle is sufficient to induce Chlamydia trachomatis persistence. Cell. Microbiol. 2007;9:725–737. doi: 10.1111/j.1462-5822.2006.00823.x. [DOI] [PubMed] [Google Scholar]
- 15.Moorman DR, Sixbey JW, Wyrick PB. Interaction of Chlamydia trachomatis with human epithelium in culture. J. Gen. Microbiol. 1986;132:1055–1067. doi: 10.1099/00221287-132-4-1055. [DOI] [PubMed] [Google Scholar]
- 16.Wyrick PB, Choong J, Davis CH, Knight ST, Royal MO, Maslow AS, Bagnell CR. Entry of genital Chlamydia trachomatis into polarized human epithelial cells. Infect. Immun. 1989;57:2378–2389. doi: 10.1128/iai.57.8.2378-2389.1989. [DOI] [PMC free article] [PubMed] [Google Scholar]
- 17.Belland RJ, Zhong G, Crane DD, Hogan D, Sturdevant D, Sharma J, Beatty WL, Caldwell HD. Genomic transcriptional profiling of the developmental cycle of Chlamydia trachomatis. Proc. Natl. Acad. Sci. USA. 2003;100:8478–8483. doi: 10.1073/pnas.1331135100. [DOI] [PMC free article] [PubMed] [Google Scholar]
- 18.Guseva NV, Knight ST, Whittimore JD, Wyrick PB. Primary cultures of female swine genital epithelial cells in vitro: a new approach for the study of hormonal modulation of Chlamydia infection. Infect. Immun. 2003;71:4700–4710. doi: 10.1128/IAI.71.8.4700-4710.2003. [DOI] [PMC free article] [PubMed] [Google Scholar]
- 19.Stuart ES, Webley WC, Norkin LC. Lipid rafts, caveolae, caveolin-1, and entry by Chlamydiae into host cells. Exp. Cell Res. 2003;287:67–78. doi: 10.1016/s0014-4827(03)00059-4. [DOI] [PubMed] [Google Scholar]
- 20.Webley WC, Norkin LC, Stuart ES. Caveolin-2 associates with intracellular chlamydial inclusions independently of caveolin-1. BMC Infect. Dis. 2004;4:23–34. doi: 10.1186/1471-2334-4-23. [DOI] [PMC free article] [PubMed] [Google Scholar]
- 21.Jutras I, Abrami L, Dautry-Varsat A. Entry of the Lymphogranuloma venereum strain of Chlamydia trachomatis into host cells involves cholesterol-rich membrane domains. Infect. Immun. 2003;71:260–266. doi: 10.1128/IAI.71.1.260-266.2003. [DOI] [PMC free article] [PubMed] [Google Scholar]
- 22.Gabel BR, Elwell C, van Ijzendoorn SC, Engel JN. Lipid raft-mediated entry is not required for Chlamydia trachomatis infection of cultured epithelial cells. Infect. Immun. 2004;72:7367–7373. doi: 10.1128/IAI.72.12.7367-7373.2004. [DOI] [PMC free article] [PubMed] [Google Scholar]
- 23.Hybiske K, Stephens RS. Entry mechanisms of Chlamydia trachomatis into non-phagocytic cells. Infect. Immun. 2007;75:3925–3934. doi: 10.1128/IAI.00106-07. [DOI] [PMC free article] [PubMed] [Google Scholar]
- 24.Davis CH, Raulston JE, Wyrick PB. Protein disulfide isomerase, a component of the estrogen receptor complex, is associated with Chlamydia trachomatis serovar E attached to human endometrial epithelial cells. Infect. Immun. 2002;70:3413–3418. doi: 10.1128/IAI.70.7.3413-3418.2002. [DOI] [PMC free article] [PubMed] [Google Scholar]
- 25.Zhang JP, Stephens RS. Mechanism of C. trachomatis attachment to eukaryotic host cells. Cell. 1992;69:861–869. doi: 10.1016/0092-8674(92)90296-o. [DOI] [PubMed] [Google Scholar]
- 26.Carabeo RA, Grieshaber SS, Fischer E, Hackstadt T. Chlamydia trachomatis induces remodeling of the actin cytoskeleton during attachment and entry into HeLa cells. Infect. Immun. 2002;70:3793–3803. doi: 10.1128/IAI.70.7.3793-3803.2002. [DOI] [PMC free article] [PubMed] [Google Scholar]
- 27.Clifton DR, Fields KA, Grieshaber SS, Dooley CA, Fischer ER, Mead DJ, Carabeo RA, Hackstadt T. A chlamydial type III translocated protein is tyrosine-phosphorylated at the site of entry and associated with recruitment of actin. Proc. Natl. Acad. Sci. USA. 2004;101:10166–10171. doi: 10.1073/pnas.0402829101. [DOI] [PMC free article] [PubMed] [Google Scholar]
- 28.Dessus-Babus S, Whittimore JD, Wyrick PB. Proceedings of the 11th International Symposium on Human Chlamydial Infections. Niagara-on-the-Lake, Canada: 2006. pp. 145–148. [Google Scholar]
- 29.Dessus-Babus S, Knight ST, Wyrick PB. Chlamydial infection of polarized HeLa cells induces PMN chemotaxis but the cytokine profile varies between disseminating and non-disseminating strains. Cell. Microbiol. 2000;2:317–327. doi: 10.1046/j.1462-5822.2000.00058.x. [DOI] [PubMed] [Google Scholar]
- 30.Wyrick PB, Knight ST, Paul TR, Rank RG, Barbier CS. Persistent chlamydial antigens in antibiotic-exposed infected cells trigger neutrophil chemotaxis. J. Infect. Dis. 1999;179:954–966. doi: 10.1086/314676. [DOI] [PubMed] [Google Scholar]