

Abstract
We analyzed the retinoid levels and gene expression in various tissues after wild type (Wt) and lecithin:retinol acyltransferase knockout (LRAT−/−) mice were fed a high retinol diet (250 IU/gram). As compared to Wt, LRAT−/− mice exhibited a greater and faster increase in serum retinol concentration (mean±S.D., Wt, 1.3±0.2 µM to 1.5±0.3 µM in 48 hours, p>0.05; LRAT−/−, 1.3±0.2 µM to 2.2±0.3 µM in 48 hours, p<0.01) and a higher level of retinol in adipose tissue (17.2±2.4 pmol/mg in Wt vs. 34.6±8.0 pmol/mg in LRAT−/−). In the small intestines of Wt mice higher levels of retinol (96.4±13.0 pmol/mg in Wt vs. 13.7±7.6 pmol/mg in LRAT−/−) and retinyl esters (2493.4±544.8 pmol/mg in Wt vs. 8.2±2.6 pmol/mg in LRAT−/−) were detected. More retinol was detected in the feces of LRAT−/− mice (69.3±32.6 pmol/mg in LRAT−/− vs. 24.1±8.6 pmol/mg in Wt). LRAT mRNA levels increased in the lungs, small intestines, and livers of Wt mice on the high retinol diet, while CYP26A1 mRNA levels increased greatly only in the LRAT−/− mice. After 4 weeks, no significant differences between Wt mice and LRAT−/− mice were observed in either the serum retinol level or in the prevalence of Goblet cells in jejunal crypts. Our data indicate that the LRAT−/− mice maintain the homeostasis of retinol as the dietary retinol increases by increasing the excretion of retinol from the gastrointestinal tract, increasing the distribution of retinol to adipose tissue, and enhancing the catabolism by CYP26A1. We show that LRAT plays a role in maintaining a stable serum retinol concentration when dietary retinol concentration fluctuates.
Keywords: LRAT, gene knockout mice, retinol, retinyl ester, retinol absorption, metabolism, Cytochrome P450
2. INTRODUCTION
All-trans retinoic acid (RA) is a metabolite of retinol (vitamin A) which regulates cell proliferation and differentiation [1]. RA acts via binding and activating its nuclear receptors, which are transcription factors that directly regulate the transcription of certain "target" genes [2]. Mammals acquire retinol either as the provitamin carotenoids, such as β-carotene, or as preformed vitamin A from the diet [3]. β-Carotene enters enterocytes intact and is converted to retinol in the enterocytes [4, 5], while the preformed retinyl esters are first hydrolyzed to retinol in the intestinal lumen, and the free retinol is then taken up by the mucosal cells [6]. Within enterocytes, retinol is re-esterified and then packed into the nascent chylomicrons [3, 7]. Two enzymes, lecithin:retinol acyltransferase (LRAT) and acyl-coenzyme A:retinol acyltransferase (ARAT), are involved in the re-esterification of retinol [7]. The cellular retinol-binding protein type II (CRBP-II), complexed with retinol, facilitates the reaction catalyzed by LRAT [8]. Retinol not bound to CRBP-II is thought to participate in the reaction catalyzed by ARAT, but the physiological significance of this reaction catalyzed by ARAT is unclear [3]. The chylomicron retinyl esters are hydrolyzed to retinol, taken up primarily by the hepatocytes, and then transferred and stored as retinyl esters in the perisinusoidal stellate cells [9–11]. In liver, the CRBP-I is responsible for delivery of retinol to LRAT [12]. The stored retinyl esters can be hydrolyzed to retinol and released into the circulation as needed. Retinol circulates in the blood as a complex with the serum retinol binding protein (RBP4). STRA6, a membrane receptor for RBP4, mediates the cellular uptake of retinol [13].
LRAT not only catalyzes esterification of retinol in the enterocytes, but also esterifies retinol for storage as retinyl esters in a variety of tissues. LRAT activity has been found in many tissues in which metabolism of retinol actively occurs, including the liver [14–17], lung [18, 19], eye [20–22], testis [23], small intestine [24, 25], skin [26–28], mammary gland [27, 29], and prostate epithelium [30]. In certain tissue types, such as adipose tissue, the esterification of retinol may be independent of LRAT activity [19, 31].
The liver is the most important organ for retinyl ester storage. Since disruption of the LRAT gene in mice eliminates the retinyl esters in the liver, LRAT knockout mice are more susceptible to vitamin A deficiency upon removal of retinol from the diet [19, 31, 32]. As a result, a constant supply of retinol from the diet is essential for the maintenance of the appropriate physiological levels of retinol in the serum and tissues of LRAT−/− mice [19, 31, 32]. Because LRAT−/− mice cannot convert retinol to retinyl esters in most tissues, it is important to determine what happens to the LRAT−/− mice when retinol is provided in excessive amounts. The goal of the experiments performed here was to determine how the LRAT−/− mice responded to dietary retinol when it was present at a level higher than the normal level.
3. MATERIALS AND METHODS
3.1 High retinol diet
The LRAT gene knockout mice were produced as previously described and bred into a C57BL/6 background [19]. All studies were performed with the approval of Research Animal Resource Center (RARC) of Weill Cornell Medical College. The pups were weaned at three-weeks postpartum and the genotypes were determined by PCR [19]. At six-weeks of age female wild type and LRAT−/− mice were divided randomly into two groups. One group was fed the normal, retinol-sufficient diet (control diet, Harlan TD05214, supplies 25 IU of retinol as retinyl palmitate per gram), while the other group was fed the same formula but with 10-fold higher retinol as retinyl palmitate (Harlan TD96008 supplies 250 IU of retinol as retinyl palmitate per gram). All mouse diets, including the control diet, were designed and customized exclusively for this study. The amount of retinol in the control diet was consistent with the formula used routinely in our animal facility at Weill Cornell. The chow pellets and drinking water were freely accessible at all times. Blood samples were obtained via the mouse tails on days 0, 2, 4, 7, 14, 28 and 42, approximately 100 µl each. The blood samples were allowed to clot at 4°C for 2 hours at dark. The serum was collected after centrifugation in a microfuge at 5,000 rpm at 4°C for 15 min. The feces (20 to 50 mg, wet weight) and urine samples (50 to 150 µl) were collected at the designated time during the experiment. We did not monitor whether the wild type and LRAT−/− mice generated the same amounts of feces per day, but we closely monitored the body weights during this study and we did not find any statistically significant differences in the body weights between wild type and LRAT−/− mice. On day 42 mice were sacrificed and the samples of liver, adipose tissue, small intestine, lung and kidney were harvested in the dark. All samples were stored at −70°C until the retinoids were extracted for assays.
3.2 Analyses of retinoids
The analyses were performed by the high-performance liquid chromatography (HPLC) as previously reported [19]. Briefly, frozen tissue samples from liver, adipose tissue, small intestine, lung and kidney were weighed and homogenized in cold phosphate buffered saline (PBS) (100 µl PBS per 100 mg tissue). For the fecal analyses, feces were homogenized in cold PBS. The volumes of both homogenized tissue and fecal samples were adjusted to 500 µl with cold PBS. The retinoids were extracted into 350 µl of organic solution (acetonitrile/butanol, 50/50, v/v) in the dark as previously described [33, 34]. The HPLC was performed using a Waters Millennium system (Waters Corp., Milford, MA). Each sample (100 µl of the 350 µl) was loaded onto an analytical 5-µm reverse phase C18 column (Vydac, Hesperia, CA) and eluted at a flow rate of 1.5 ml/min. The concentrations of retinoids were calculated from the areas under the peaks detected at a wavelength of 340 nm. The levels of retinol and retinyl esters were normalized to the wet weight (tissues and feces) or the volume (serum and urine).
3.3 Semi-quantitative RT-PCR and quantitative real time PCR
The tissues from the lung, small intestine, and liver were dissected and stored in RNA later (Ambion, Austin, TX) at −70 °C. Total RNA was extracted using the mini RNAeasy columns (Qiagen, Valencia, CA). Total RNA (1 µg each) was used for reverse transcription in a 20 µl reaction using SuperScript™ II Reverse Transcriptase (RT) from Invitrogen (Carlsbad, CA). The synthesized cDNA was diluted to 100 µl with water, and 1 µl of each diluted cDNA sample was used in the PCR. The PCR was performed using the following conditions: 94 °C for 30 s, 58 °C for 30 s, and 72 °C for 80 s, with a final extension at 72 °C for 10 min. Taq polymerase was from Invitrogen (catalog number 18038–042). The PCR products were subjected to 1.2% agarose gel electrophoresis. The gel images, stained with ethidium bromide, were recorded with a FluorChem 8800 system (Alpha Innotech, San Leandro, CA). The gene-specific primers for PCR are listed as follows: for LRAT (GenBank™ accession number AF255061), the 5'-primer 5-CTGACCAATGACAAGGAACGCACTC-3 and 3'-primer 5-CTAATCCCAAGACAGCCGAAGCAAGAC-3 were used, and a 370 bp product was expected; for CYP26A1 (GenBank™ accession number NM_007811), the 5'-primer 5-GCAGATGAAGCGCAGGAAATACG-3 and 3'-primer 5-CCCACGAGTGCTCAATCAGGA-3 were used, and a 635 bp product was expected. The LRAT and CYP26A1 primers were designed around introns to avoid detection of any genomic DNA contamination (if existed). GAPDH (upstream primer, 5-ACCACAGTCCATGCCATCAC-3; downstream primer, 5-TCCACCACCCTGTTGCTGTA-3, 22 cycles, expected product size 451 bp) was used as a control for the semi-quantitative RT-PCR. Various dilutions of the PCR products were analyzed to show that the PCR was in the linear range (not shown).
For quantitative real-time RT-PCR, the reactions were performed in 20 µl using a BioRad thermal cycler (MyiQ™ Single-Color Real-Time PCR Detection System). Samples were denatured initially at 95°C for 3 min, and then 46 cycles were performed using the following conditions: 94°C for 30 sec, 58°C for 30 sec, and 72°C for 45 sec. The SYBR Green (IQ™ SYBR Green Supermix were from BioRad) fluorescence emissions were recorded at 80°C after each cycle. The PCRs were performed in triplicate. The quantitative results were calculated using MyIQ software (BioRad) and normalized to 36B4 (upstream primer 5-AGAACAACCCAGCTCTGGAGAAA-3 an downstream primer 5-ACACCCTCCAGAAAGCGAGAGT-3) [35]. The means of the triplicates along with the standard deviations are presented.
3.4 Histology
Histochemical staining of Goblet cells in the jejunum samples was performed by using Alcian blue (AB) followed by periodic acid-Schiffs reagent (PAS) on paraffin sections of tissue [36, 37]. The Goblet cells were counted in the crypts, which were sectioned longitudinally [38].
3.5 Statistical methods
The means ± S.D. were calculated using Graphpad Prism Program (version 4.0a). Dunnett’s test was used to compare the changes in serum retinol concentrations to the basal serum retinol levels. The unpaired t test was used to determine the differences between two groups of the tissue or fecal samples. Differences with a p value of <0.05 were considered to be statistically significant. Dr. Kathy Zhou at the Weill Cornell Biostatistics Division was consulted for assistance in the statistical analyses of these data.
4. RESULTS
4.1 Retinol levels in the serum
We monitored the serum retinol concentration for up to six weeks after the high retinol diet (250 IU per gram) was initiated. On day 0, when the mice were still fed the control, retinol sufficient diet (25 IU per gram), the concentration of serum retinol was 1.3 ± 0.2 µM (mean ± S.D.) in wild type mice and 1.3 ± 0.2 µM in LRAT−/− mice. No significant differences between wild type (Wt) and LRAT−/− mice could be detected. In response to the high retinol diet, the concentration of serum retinol in the wild type mice slowly increased, and peaked at 1.8 ± 0.3 µM on day 14. The serum retinol level in Wt mice then decreased to 1.6 ± 0.3 µM on day 28, and further decreased to 1.5 ± 0.3 µM on day 42 (Table 1). In contrast, the serum retinol concentration in the LRAT−/− mice increased at a faster rate upon initiation of the high retinol diet (Table 1). On day 2, the serum retinol level was 2.2 ± 0.3 µM, which was significantly higher than the serum retinol level on day 0 (p<0.01, Dunnett’s test). The higher serum retinol concentration was maintained in the LRAT−/− mice for at least two weeks. On day 14, the retinol serum level in the LRAT−/− mice was 2.2 ± 0.5 µM. The retinol level in the serum of the LRAT−/− mice decreased to 1.6 ± 0.2 µM on day 28, and further decreased to 1.5 ± 0.3 µM on day 42. In the wild type and LRAT−/− mice the serum retinol concentrations on day 28 and day 42 were not significantly higher than the concentrations on day 0 (p>0.05, Dunnett’s test). In the control Wt and LRAT−/− mice that were maintained on the normal, retinol sufficient (25 IU per gram) diet, the serum retinol levels were stable through out the experimental period, ranging from 1.2 to 1.5 µM in wild type mice and 1.2 to 1.3 µM in LRAT−/− mice.
TABLE 1. Retinol Concentration in Serum.
The amount of retinol in the serum was measured by HPLC. The values are presented as mean ± S.D. After the samples were taken on day 0, the mice were placed on a high retinol (250 IU per gram) diet for six weeks. In the control Wt and LRAT−/− mice that were maintained on the normal retinol (25 IU per gram) diet, the serum retinol levels were stable through out the experimental period, ranging from 1.17 to 1.52 µM in wild type mice and 1.22 to 1.33 µM in LRAT−/− mice.
| Retinol in serum | |||||||
|---|---|---|---|---|---|---|---|
| Day 0 | Day 2 | Day 4 | Day 7 | Day 14 | Day 28 | Day 42 | |
| µM | µM | µM | µM | µM | µM | µM | |
| Wild type mice (n=6) | 1.3 ± 0.2 | 1.5 ± 0.3 | 1.5 ± 0.2 | 1.6 ± 0.4 | 1.8 ± 0.3 | 1.6 ± 0.3 | 1.5 ± 0.3 |
| LRAT−/− mice (n=7) | 1.3 ± 0.2 | 2.2 ± 0.3** | 2.1 ± 0.1** | 2.0 ± 0.5** | 2.2 ± 0.5** | 1.6 ± 0.2 | 1.5 ± 0.3 |
indicate a statistically significant difference from the wild type mice on day 0, as determined by the Dunnett’s test, and the p value was <0.01.
4.2 Retinoids in the liver, adipose tissue, lung and kidney
We next determined whether the high vitamin A diet could increase the storage of retinol in the tissues. We first analyzed the retinol and retinyl esters in the liver. In the wild type mice that were fed the high retinol diet for 6 weeks, as compared to the wild type mice maintained on the normal retinol diet, there was a 5-fold increase in the retinol level (310.0 ± 66.9 pmol/mg vs. 61.6 ± 13.8 pmol/mg) (mean ± S.D.) and a 2-fold increase in the retinyl ester level (7911.5 ± 984.1 pmol/mg vs. 3606.3 ± 1358.6 pmol/mg) in the liver. In the LRAT−/− mice the high retinol diet also caused an increase in the hepatic retinol levels (8.6 ± 1.2 pmol/mg on the high retinol diet vs. 3.0 ± 0.7 pmol/mg on the normal retinol sufficient diet) and retinyl ester levels (4.6 ± 1.2 pmol/mg on high retinol diet vs. 2.8 ± 2.2 pmol/mg on normal retinol sufficient diet), but these levels of retinoids were extremely low as compared to those in the wild type mice. The retinol and retinyl ester levels in the livers of the LRAT−/− mice on the high retinol diet were approximately 2.78% and 0.06%, respectively, of the retinol and retinyl ester levels detected in the livers of the wild type mice on the same high retinol diet (Figure 1 and Table 2).
Figure 1. All-trans-retinol and retinyl esters in liver and small intestine from wild type (LRAT+/+) versus knock-out (LRAT−/−) mice.
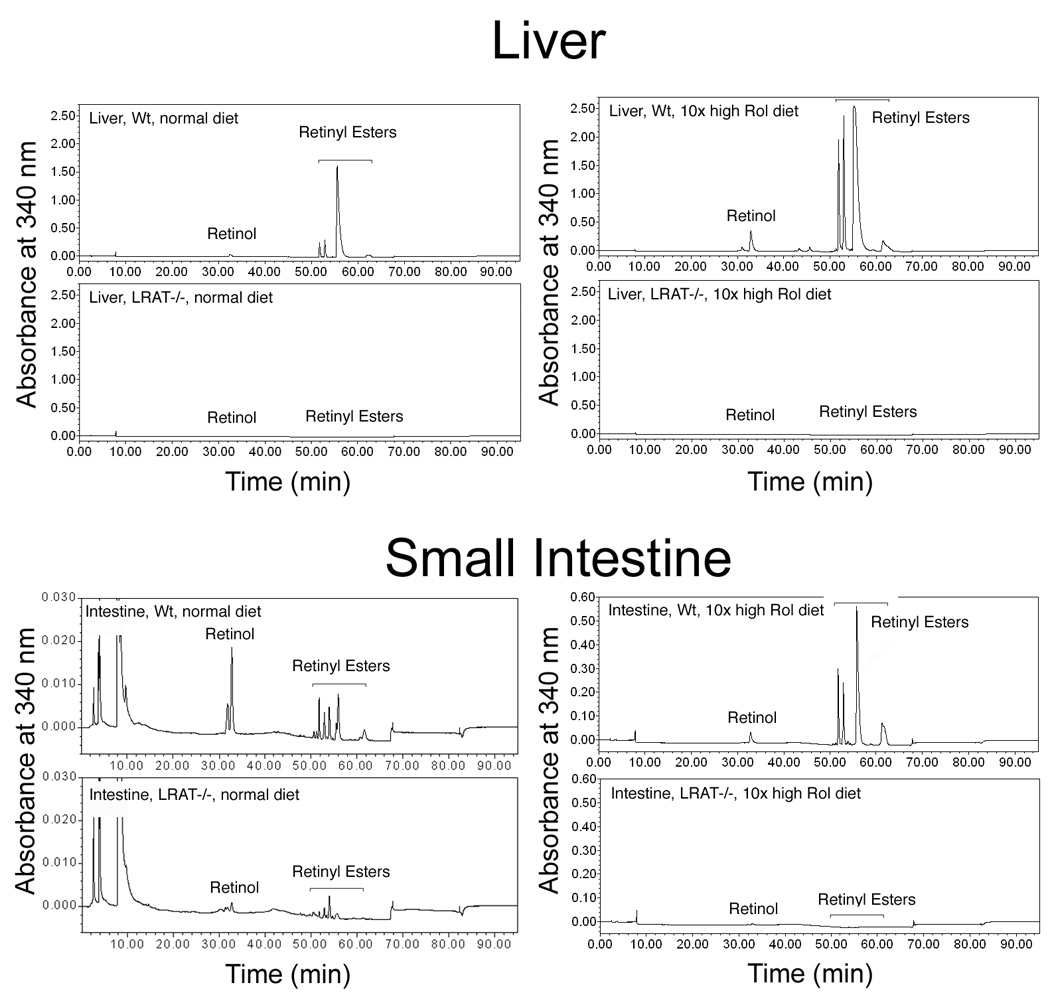
The results from one representative HPLC experiment are shown. A, retinol and retinyl esters in livers from wild type and LRAT−/− mice, either on the normal retinol sufficient diet or on the 10-fold higher retinol diet for 42 days. Tissue sample weight: wt, normal diet, 43.4 mg; LRAT−/−, normal diet, 52.9 mg; wt, high retinol diet, 56.0 mg; LRAT−/−, high retinol diet, 69.1 mg. B, retinol and retinyl esters in cell extracts from small intestine from wild type and LRAT−/− mice on the normal retinol sufficient diet or on the high retinol diet for 42 days. Tissue sample weight: wt, normal diet, 125.7 mg; LRAT−/−, normal diet, 105.5 mg; wt, high retinol diet, 17.4 mg; LRAT−/−, high retinol diet, 17.4 mg. For convenience in comparisons, the same scale range was applied to the HPLC tracings for the wild type mice and LRAT−/− mice. On this scale the retinol and retinyl ester peaks were undetectable in most LRAT−/− samples from the group on the 10-fold higher retinol diet. Wt: wild-type mice; LRAT−/−: LRAT−/− mice; Rol: retinol.
TABLE 2. Retinol and Retinyl Esters in Tissues.
The levels of retinol and retinyl esters were measured by HPLC. Data are presented as mean ± S.D. Asterisks indicate statistically significant differences from mice fed the control diet, as determined by the unpaired t test.
| Retinol (pmol/mg tissue wet weight) | Retinyl Esters (pmol/mg tissue wet weight) | |||||||
|---|---|---|---|---|---|---|---|---|
| Wild type Mice (n=4) | LRAT−/− Mice (n=3) | Wild type Mice (n=4) | LRAT−/− Mice (n=3) | |||||
| Ctrl Diet | HV Diet | Ctrl Diet | HV Diet | Ctrl Diet | HV Diet | Ctrl Diet | HV Diet | |
| Liver | 61.6±13.8 | 310.0±66.9*** | 3.0±0.7 | 8.6±1.2** | 3606.3±1358.6 | 7911.5±984.1** | 2.8±2.2 | 4.6±1.2 |
| Adipose | 1.4±1.3 | 17.2±2.4*** | 5.0±1.9 | 34.6±8.0** | 2.8±2.2 | 7.0±1.8* | 8.1±0.7 | 8.5±2.2 |
| Intestine | 9.1±5.8 | 96.4±13.0*** | 2.8±1.7 | 13.7±7.6 | 21.3±13.5 | 2493.4±544.8*** | 4.1±1.0 | 8.2±2.6* |
| Lung | 40.8±9.7 | 65.5±14.6* | 1.2±0.3 | 4.9±0.9** | 1610.1±876.4 | 10998.2±835.6*** | 0.9±0.2 | 3.5±1.0* |
| Kidney | 2.1±0.4 | 5.7±0.4*** | 2.5±0.7 | 7.4±2.1* | 5.7±1.0 | 16.9±2.1*** | 7.0±4.7 | 11.7±2.2 |
indicates that the p value was <0.05
indicate that the p value was <0.01
indicate that the p value was <0.001.
Ctrl Diet: retinol sufficient, control diet; HV Diet: 10x higher retinol diet.
We then examined the retinol and retinyl esters in adipose tissue. Adipose tissue was taken from dorsal region between the scapulae. As compared to the mice maintained on the normal retinol sufficient diet, the high retinol diet resulted in a 13-fold increase in retinol levels in adipose tissue (17.2 ± 2.4 pmol/mg vs. 1.4 ± 1.3 pmol/mg) and a 2.5-fold increase in retinyl ester levels (7.0 ± 1.8 pmol/mg vs. 2.8 ± 2.2 pmol/mg) in the wild type mice. In the LRAT−/− mice the high retinol diet resulted in a 7-fold increase in retinol levels in adipose tissue (34.6 ± 8.0 pmol/mg vs. 5.0 ± 1.9 pmol/mg), but the change in the retinyl esters was not significant (8.5 ± 2.2 pmol/mg vs. 8.1 ± 0.7 pmol/mg, p>0.05, unpaired t test). The retinol levels in the adipose tissue of LRAT−/− mice maintained on a high retinol diet were approximately 2-fold higher than the retinol levels in the adipose tissue of the wild type mice (p<0.01, unpaired t test), but the differences in the levels of retinyl esters between the wild type mice and LRAT−/− mice were not statistically significant (p>0.05, unpaired t test) (Table 2).
We measured the levels of retinol and retinyl esters in the lung and kidney because of the importance of these organs for retinol storage in wild type mice. In the LRAT−/− mice maintained on the high retinol diet the retinol levels in lung were 4.9 ± 0.9 pmol/mg, which was 7.50% of the retinol levels (65.5 ± 14.6 pmol/mg) in the lung of the wild type mice maintained on the same high retinol diet; the retinyl ester level was 3.5 ± 1.0 pmol/mg, which was 0.03% of the retinyl ester level in the lungs of wild type mice (10998.2 ± 835.6 pmol/mg). Among the tissue types examined, the lungs of wild type mice showed the greatest increase in the retinyl ester levels after the mice were placed on the high retinol diet.
In the kidneys of the animals maintained on the high retinol diet the retinol concentration was 5.7 ± 0.4 pmol/mg in the wild type mice and 7.4 ± 2.1 pmol/mg in the LRAT−/− mice. There was no significant difference between the wild type mice and LRAT−/− mice (p>0.05, unpaired t test). The renal retinyl ester level was 11.7 ± 2.2 pmol/mg in LRAT−/− mice, lower than the renal retinyl ester level in wild type mice maintained on a high retinol diet (16.9 ± 2.1 pmol/mg) (p<0.05, unpaired t test).
4.3 Retinoids in the small intestine, urine, and feces
In cell extracts from the small intestine retinol and multiple retinyl esters were identified in both the wild type and LRAT−/− mice (Figure 1). In wild type mice the high retinol diet resulted in more than a ten-fold increase in retinol level (96.4 ± 13.0 pmol/mg on the high retinol diet vs. 9.1 ± 5.8 pmol/mg on the normal control diet) and more than a one hundred-fold increase in retinyl ester level (2493.4 ± 544.8 pmol/mg on the high retinol diet vs. 21.3 ± 13.5 pmol/mg on the normal control diet) in the small intestine (Table 2). In contrast, in the LRAT−/− mice the high retinol diet resulted in a five-fold increase in the retinol level (13.7 ± 7.6 pmol/mg on the high retinol diet vs. 2.8 ± 1.7 pmol/mg on the normal control diet) and a two-fold increase in retinyl esters (8.2 ± 2.6 pmol/mg on the high retinol diet vs. 4.1 ± 1.0 pmol/mg on the normal control diet) in the small intestine (Table 2).
To evaluate the efficiency of retinol absorption by the gastrointestinal tract we quantitatively analyzed the retinoids extracted from the feces. No retinol was detected in the feces from either wild type mice or LRAT−/− mice which had been fed a diet containing a 10-fold lower retinol level (Harlan Teklad, TD05212, 2.5 IU retinol per gram) than the normal diet for 7 days. In wild type mice which were maintained on the normal retinol sufficient diet (Harlan Teklad, TD05214, 25 IU retinol per gram) retinol was detected in the feces at 2.6 ± 1.7 pmol/mg, and in LRAT−/− mice retinol was detected at 4.1 ± 2.9 pmol/mg in the feces. The difference between the wild type and LRAT−/− mice was not statistically significant (p>0.05, unpaired t test).
Fecal retinoids were analyzed on day 3 and day 7 after the high retinol diet (Harlan Teklad, TD96008, 250 IU retinol per gram) was initiated. On day 3 the amount of retinol in the feces of LRAT−/− mice was 2.0-fold higher than the amount of retinol in the feces of the wild type mice (45.2 ± 14.9 pmol/mg vs. 22.7 ± 9.9 pmol/mg, p<0.05, unpaired t test); on day 7, the amount of retinol in the feces of LRAT−/− mice was 2.9-fold higher than the amount of retinol in the feces of the wild type mice (69.3 ± 32.6 pmol/mg vs. 24.1 ± 8.6 pmol/mg, p<0.01, unpaired t test) (Figure 2 and Table 3). Only trace amounts of retinyl esters were found in all fecal samples. The fecal retinol content was followed for four months while the mice were maintained on the high retinol diet, and the three-fold higher level of retinol in the feces of LRAT−/− mice was maintained over this time period.
Figure 2. All-trans-retinol in feces from the wild type (LRAT+/+) and knock-out (LRAT−/−) mice.
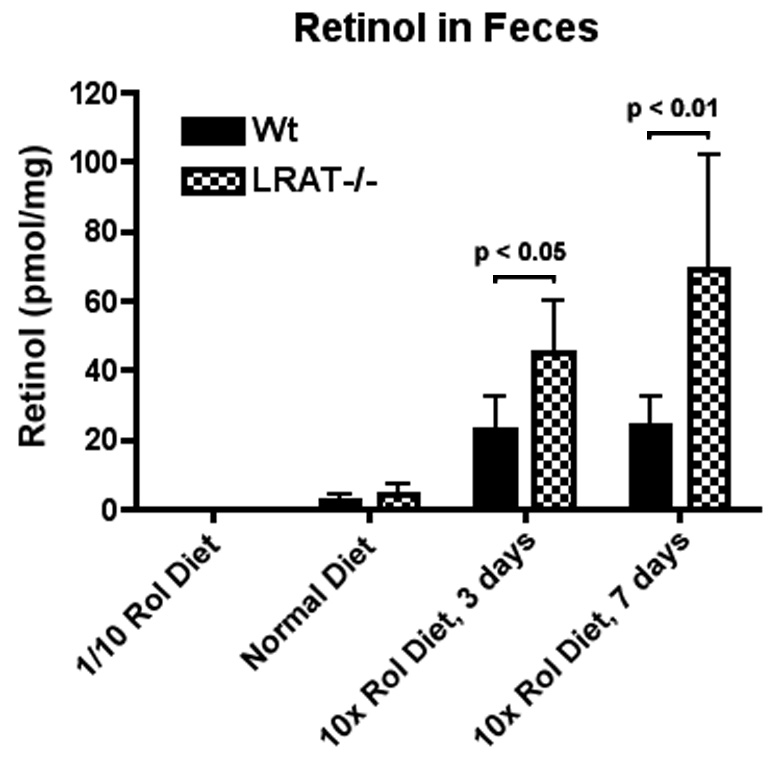
Feces were collected from individual mice. Fecal retinoids were extracted and analyzed by HPLC. The values shown in the figure correspond to mean ± S.D. A (*) indicates a statistically significant difference (p<0.05, unpaired t test) from the Wt mice. Rol: retinol.
TABLE 3. Levels of Retinol in the Feces.
The level of retinol in the feces was measured by HPLC and normalized to the fecal wet weight. The values are presented as means ± S.D. Asterisks indicate values which are statistically significantly higher than in the wild type mice, as determined by unpaired t test.
| 1/10 Rol Diet(Day 7) | 1x Normal Diet | 10x Rol Diet (Day 3) | 10x Rol Diet (Day 7) | |
|---|---|---|---|---|
| pmol/mg | pmol/mg | pmol/mg | pmol/mg | |
| Wild type (n=7) | undetectable | 2.6 ± 1.7 | 22.7 ± 9.9 | 24.1 ± 8.6 |
| LRAT−/− (n=5) | undetectable | 4.1 ± 2.9 | 45.2 ± 14.9* | 69.3 ± 32.6** |
indicates that the p value was <0.05
indicate that the p value was <0.01.
1/10 Rol diet: containing retinol reduced to 1/10 of the normal retinol sufficient control diet; 1x Normal diet: normal retinol sufficient control diet; 10x Rol Diet: 10-fold higher retinol diet.
We also analyzed the retinoids in the urine samples which were collected after the wild type and LRAT−/− mice had been fed the high retinol diet for two weeks. In one sample from one LRAT−/− mouse, a trace amount of retinol was detected by HPLC. In other urine samples, including seven samples from wild type mice and three samples from LRAT−/− mice, the retinol concentration was below the detectable level (<0.015 pmol/µl).
4.4 Expression of LRAT and CYP26A1 mRNA
In previous studies we found that CYP26A1 mRNA levels were higher in some tissues in the LRAT−/− mice [19]. To assess how dietary retinol affects CYP26A1 mRNA levels in the presence versus the absence of LRAT, we examined the levels of LRAT and CYP26A1 mRNAs in the lungs, small intestines and livers from six Wt and six LRAT−/− mice fed the 10-fold higher retinol diet, and five Wt and five LRAT−/− mice maintained on the normal retinol sufficient diet. By semi-quantitative RT-PCR, LRAT mRNA was observed in all samples from wild type mice, and higher levels of LRAT mRNA were also observed in response to the 10-fold higher retinol. No LRAT mRNA was detected in the LRAT−/− mice, as expected (Figure 3A, B). In the Wt mice maintained on the normal retinol diet, CYP26A1 mRNA was not detected in the lungs, small intestines, or livers, but CYP26A1 transcripts were detected in lung and liver samples from the LRAT−/− mice. The CYP26A1 mRNA levels were increased in both wild type and LRAT−/− mice on the 10-fold higher retinol diet, but higher levels of CYP26A1 mRNA were observed in the lung, small intestine and livers of LRAT−/− mice as compared to Wt mice (Figure 3A, B). The results from two representative mice of each group are shown (Figure 3A). For quantitative comparison of the changes in gene expression, the CYP26A1 and LRAT mRNA levels in the liver were examined by real time PCR and the results are shown (Figure 3B). The CYP26A1 mRNA levels in other tissues were not examined in this study.
Figure 3. LRAT and CYP26A1 mRNA in tissues.
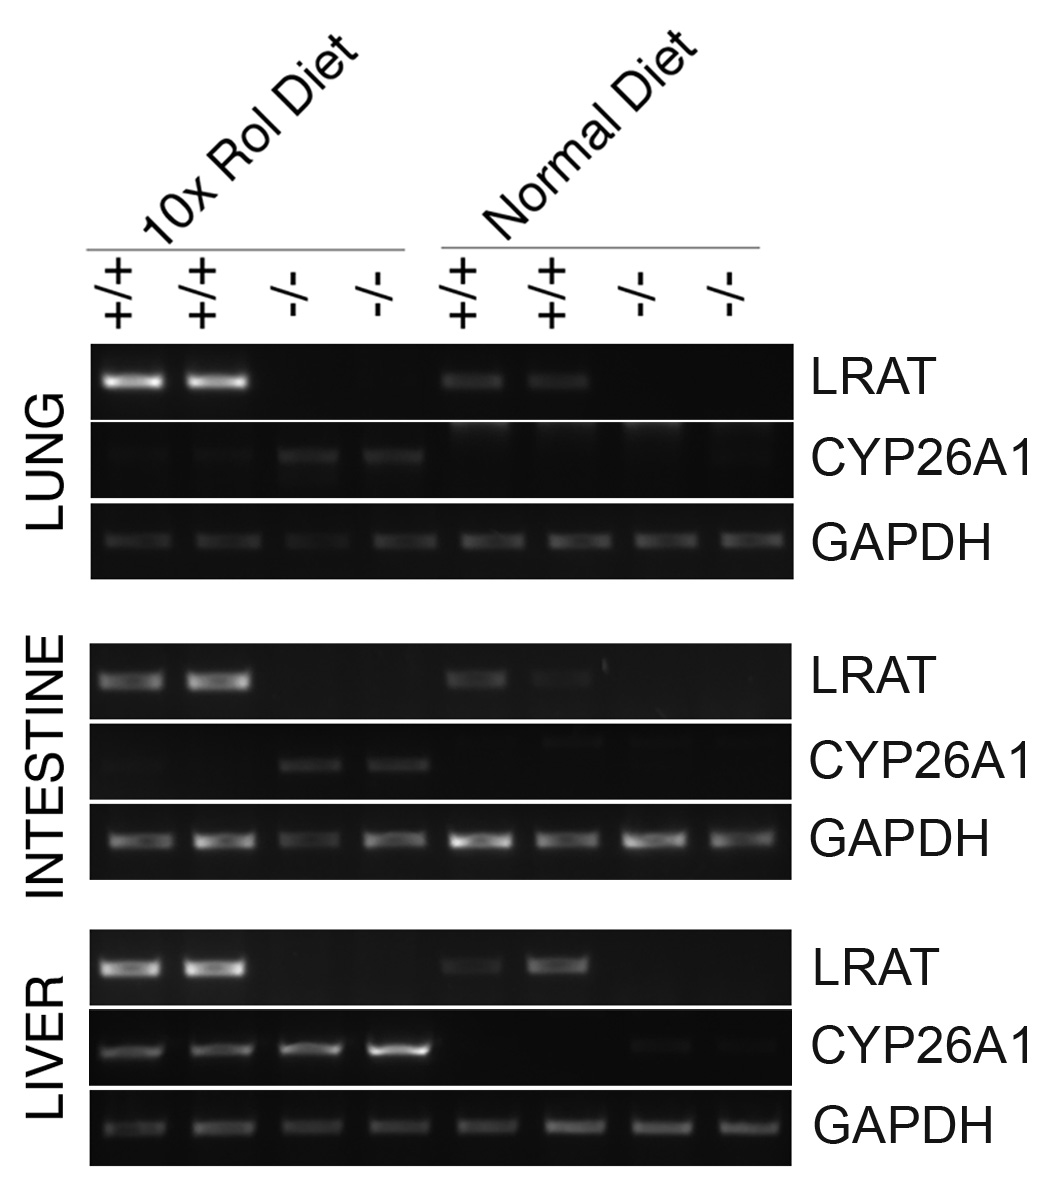

A. The mRNA expression in the lung, small intestine, and liver was examined by semi-quantitative RT-PCR. The tissues were from wild type mice and LRAT−/− mice maintained on the control retinol sufficient diet or the 10-fold higher retinol diet. Each type of tissue was from two individual mice. Number of PCR cycles: LRAT, 32 for lung, intestine and liver; CYP26A1, 40 for lung, 39 for intestine and 32 for liver. GAPDH (22 cycles) was used as a control for RNA quality and loading. +/+: Wild type mice; −/−: LRAT−/− mice; Rol: retinol. B. Examination of CYP26A1 mRNA expression in liver by real time PCR. The means ± S.D. were calculated from triplicate reactions. 10x Rol: 10x higher retinol diet; normal Rol: normal retinol control diet.
We also examined the mRNA levels of CRBP-II, Stra6 and several RA responsive genes, including RARβ2, IGFBP2 and IGFBP5 in the lung, small intestine and liver. The transcript levels of these genes were similar in the wild type mice and LRAT−/− mice maintained on the same type of diet (not shown).
4.5 Number of Goblet cells in the jejunum
The number of Goblet cells in the small intestine is sensitive to the vitamin A status [38, 39]. To evaluate whether the LRAT gene disruption affected the differentiation of the intestinal stem cells into Goblet cells, we stained the slides of jejunum samples, and the Goblet cells in each crypt, cut longitudinally, were counted. After 16 weeks on the high retinol diet, the numbers of Goblet cells in the jejunal crypt increased from 11.6 ± 1.5 cells per crypt (n=8) to 18.7 ± 1.2 cells per crypt (n=12) in wild type mice (p<0.01, unpaired t test). The prevalence of Goblet cells also increased in the jejunal crypts in LRAT−/− mice, from 12.8 ± 1.2 cells per crypt (n=13) to 17.1 ± 0.9 cells per crypt (n=11) for mice on the high retinol diet for 16 weeks (p<0.05, unpaired t test). However, no significant difference was observed between wild type mice and LRAT−/− mice that were fed the same type of diet (p>0.05, unpaired t test) (Figure 4).
Figure 4. Number of Goblet cells in the jejunal crypts.
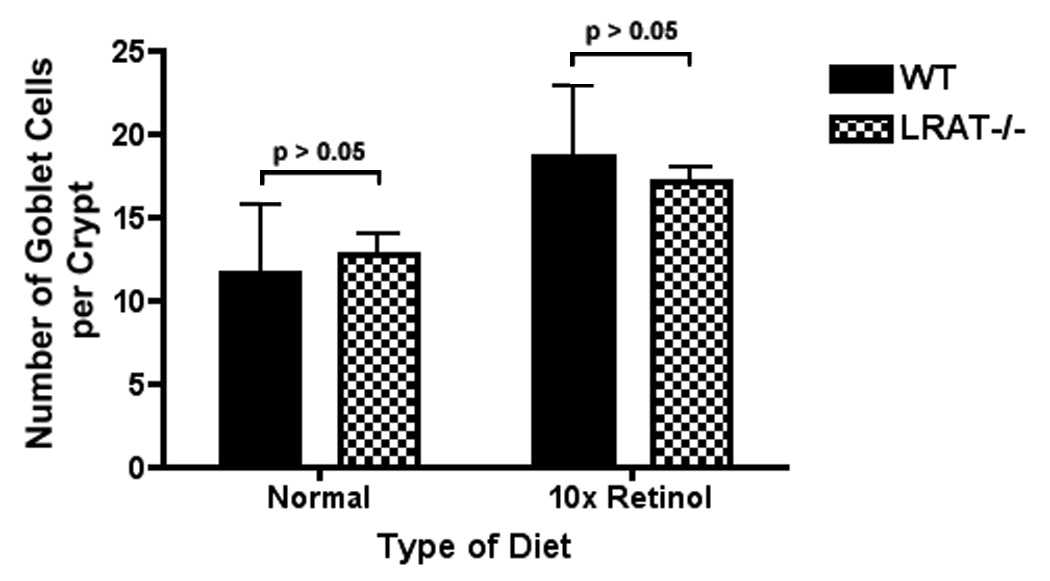
The Goblet cells were stained by using Alcian blue (AB) followed by periodic acid-Schiffs reagent (PAS). Data are presented as mean ± S.D.. Wt, control diet: 11.6 ± 4.2 (n=8); LRAT−/−, control diet: 12.8 ± 4.3 (n=13); Wt, 10x Rol diet: 18.7 ± 4.2 (n=12); LRAT−/−, 10x Rol diet: 17.1 ± 3.0 (n=11). The comparisons between Wt and LRAT−/− mice under each condition were not statistically significant.
5. DISCUSSION
In response to the 10-fold higher retinol diet we observed a rapid increase in serum retinol concentration in the LRAT−/− mice, and the serum retinol concentration remained high for at least two weeks (Table 1). In accord with previous studies showing that the LRAT−/− mice easily become vitamin A deficient upon removal of retinol from the diet [19, 31], our data suggest that lecithin:retinol acyltransferase (LRAT) is not only important for storing retinol as retinyl esters in the liver, but is also involved in maintaining a stable retinol concentration in the serum of adult mice when the dietary retinol fluctuates.
We show that the LRAT−/− mice maintain retinol homeostasis by three compensatory mechanisms, i.e., increased gastrointestinal excretion, re-distribution of retinol to adipose tissue, and enhanced catabolism of retinoids. Unlike wild type mice, the LRAT−/− mice are unable to metabolize retinol to retinyl esters in most tissues. Our data show that increased excretion of retinol by the gastrointestinal tract is one of the mechanisms by which the LRAT−/− mice regulate the retinol concentration in the serum (Figure 2). It was reported that the LRAT−/− mice exhibited a lower efficiency of dietary retinol absorption after they were given a gavage dose of retinol that was equivalent to the amount of retinol consumed in one day by mice receiving a standard diet [31]. Our data reported here show that gastrointestinal excretion of retinol by the LRAT−/− mice is related to the amount of retinol in the diet. When the dietary retinol was low (e.g., 2.5 IU per gram in our experiments), the uptake of retinol by both the wild type and LRAT−/− mice was complete. However, when the dietary retinol level was high, the LRAT−/− mice excreted more retinol from the gastrointestinal tract, and furthermore, the amount of retinol detected in feces showed an increase over time that was not seen in the wild type mice (Figure 2). These data suggest that the excretion of retinol by LRAT−/− mice from the gastrointestinal tract is precisely regulated and correlated with the dietary retinol level.
In addition to increased excretion by the gastrointestinal tract, a dynamic re-distribution of retinol between blood and adipose tissue may contribute to the regulation of serum retinol concentration in the LRAT−/− mice. The high retinol level in the adipose tissue of LRAT−/− mice (Table 2) suggests that adipose tissue is an important tissue type which contains free retinol in LRAT−/− mice. Although esterification of retinol occurs in the adipose tissue of LRAT−/− mice [19, 31], the synthesis of retinyl esters in the adipose tissue of LRAT−/− mice was not further increased by the high retinol diet (Table 2).
The expression of the catabolic enzyme CYP26A1 mRNA in the lung, small intestine, and liver of the LRAT−/− mice was higher than in Wt mice (Figure 3), suggesting that the enhanced catabolism of retinoic acid plays a role in the maintenance of normal retinoid signaling in tissues. In the absence of LRAT, retinol cannot be efficiently converted to retinyl esters in many types of tissues. If more RA is synthesized from the free retinol in these tissues, the CYP26A1 protein can catalyze the enzymatic reaction that leads to the production of polar retinoids such as 4-hydroxy-RA and 4-oxo-RA. Thus, CYP26A1 can maintain normal retinoid signaling in tissues by enhancing the catabolism of all-trans RA [40]. A recent study indicates that this regulation also occurs in mouse embryos [41]. The prevalence of mucin-secreting Goblet cells in the crypts of small intestines is a sensitive indicator of the retinoid status [38, 39]. The similar responses from wild type and LRAT−/− mice to the 10-fold higher retinol diet imply that the LRAT gene disruption does not result in a permanent disturbance in retinol homeostasis when a higher level of retinol is present in the diet (Figure 4). These results pertaining to Goblet cells, along with our results on the RA responsive genes (not shown), suggest that RA signaling in the LRAT−/− mice is maintained at the same level as in wild type mice. These results are consistent with the previous report that the wild type mice and LRAT−/− mice contained the same levels of all-trans retinoic acid in tissues when on a normal retinol diet [31].
In summary, our results indicate that the wild type mice and LRAT−/− mice employ different mechanisms to regulate retinol levels when placed on a 10-fold higher retinol diet. By increasing LRAT mRNA levels (Figure 3), the wild type mice convert more retinol to retinyl esters in retinol storage organs such as liver and lung (Figure 1 and Table 2). In contrast, the LRAT−/− mice regain normal retinol serum levels by increasing the excretion of retinol by the gastrointestinal tract (Figure 2 and Table 3), enlarging the pool of free retinol in the adipose tissue (Table 2), and enhancing the further metabolism of retinoids (Figure 3).
6. ACKNOWLEDGMENTS
The authors are grateful for the insightful scientific input provided by the members of the Gudas laboratory, to Dr. Kathy Zhou for assistance in the statistical analyses of the data, and to Christopher Kelly for editorial assistance. This research was made possible by NIH training grant 5T32CA062948 for Limin Liu, and NIH grants 5R01DE10389 and 5R01CA097543 to Lorraine Gudas.
Abbreviations
- GAPDH
glyceraldehyde-3-phosphate dehydrogenase
- GI
gastrointestinal
- HPLC
high-performance liquid chromatography
- IU
International Unit
- LRAT
lecithin:retinol acyltransferase
- PBS
phosphate buffered saline
- RA
all-trans retinoic acid
- RARs
retinoic acid receptors
- RBP4
retinol binding protein 4
- Rol
retinol
- REs
retinyl esters
- Wt
wild type
Footnotes
Publisher's Disclaimer: This is a PDF file of an unedited manuscript that has been accepted for publication. As a service to our customers we are providing this early version of the manuscript. The manuscript will undergo copyediting, typesetting, and review of the resulting proof before it is published in its final citable form. Please note that during the production process errors may be discovered which could affect the content, and all legal disclaimers that apply to the journal pertain.
7. REFERENCES
- 1.Gudas LJ, Sporn MB, Roberts A. Cellular biology and biochemistry of retinoids. In: Sporn MB, Roberts AB, Goodman DS, editors. The Retinoids: Biology, Chemistry, and Medicine. New York: Raven Press; 1994. pp. 443–520. [Google Scholar]
- 2.Chambon P. A decade of molecular biology of retinoic acid receptors. Faseb J. 1996;10(9):940–954. [PubMed] [Google Scholar]
- 3.Harrison EH. Mechanisms of digestion and absorption of dietary vitamin A. Annu Rev Nutr. 2005;25:87–103. doi: 10.1146/annurev.nutr.25.050304.092614. [DOI] [PubMed] [Google Scholar]
- 4.Quick TC, Ong DE. Vitamin A metabolism in the human intestinal Caco-2 cell line. Biochemistry. 1990;29(50):11116–11123. doi: 10.1021/bi00502a015. [DOI] [PubMed] [Google Scholar]
- 5.Paik J, During A, Harrison EH, Mendelsohn CL, Lai K, Blaner WS. Expression and characterization of a murine enzyme able to cleave beta-carotene. The formation of retinoids. J Biol Chem. 2001;276(34):32160–32168. doi: 10.1074/jbc.M010086200. [DOI] [PubMed] [Google Scholar]
- 6.Dew SE, Ong DE. Specificity of the retinol transporter of the rat small intestine brush border. Biochemistry. 1994;33(40):12340–12345. doi: 10.1021/bi00206a042. [DOI] [PubMed] [Google Scholar]
- 7.Blomhoff R, Green MH, Green JB, Berg T, Norum KR. Vitamin A metabolism: new perspectives on absorption, transport, and storage. Physiol Rev. 1991;71(4):951–990. doi: 10.1152/physrev.1991.71.4.951. [DOI] [PubMed] [Google Scholar]
- 8.Ong DE, Kakkad B, MacDonald PN. Acyl-CoA-independent esterification of retinol bound to cellular retinol-binding protein (type II) by microsomes from rat small intestine. J Biol Chem. 1987;262(6):2729–2736. [PubMed] [Google Scholar]
- 9.Harrison EH, Gad MZ, Ross AC. Hepatic uptake and metabolism of chylomicron retinyl esters: probable role of plasma membrane/endosomal retinyl ester hydrolases. J Lipid Res. 1995;36(7):1498–1506. [PubMed] [Google Scholar]
- 10.Harrison EH. Lipases and carboxylesterases: possible roles in the hepatic metabolism of retinol. Annu Rev Nutr. 1998;18:259–276. doi: 10.1146/annurev.nutr.18.1.259. [DOI] [PubMed] [Google Scholar]
- 11.Blomhoff R, Helgerud P, Rasmussen M, Berg T, Norum KR. In vivo uptake of chylomicron [3H]retinyl ester by rat liver: evidence for retinol transfer from parenchymal to nonparenchymal cells. Proc Natl Acad Sci U S A. 1982;79(23):7326–7330. doi: 10.1073/pnas.79.23.7326. [DOI] [PMC free article] [PubMed] [Google Scholar]
- 12.Ghyselinck NB, Bavik C, Sapin V, Mark M, Bonnier D, Hindelang C, Dierich A, Nilsson CB, Hakansson H, Sauvant P, Azais-Braesco V, Frasson M, Picaud S, Chambon P. Cellular retinol-binding protein I is essential for vitamin A homeostasis. Embo J. 1999;18(18):4903–4914. doi: 10.1093/emboj/18.18.4903. [DOI] [PMC free article] [PubMed] [Google Scholar]
- 13.Kawaguchi R, Yu J, Honda J, Hu J, Whitelegge J, Ping P, Wiita P, Bok D, Sun H. A membrane receptor for retinol binding protein mediates cellular uptake of vitamin A. Science. 2007;315(5813):820–825. doi: 10.1126/science.1136244. [DOI] [PubMed] [Google Scholar]
- 14.Ross AC, Zolfaghari R. Regulation of hepatic retinol metabolism: perspectives from studies on vitamin A status. J Nutr. 2004;134(1):269S–275S. doi: 10.1093/jn/134.1.269S. [DOI] [PubMed] [Google Scholar]
- 15.Matsuura T, Gad MZ, Harrison EH, Ross AC. Lecithin:retinol acyltransferase and retinyl ester hydrolase activities are differentially regulated by retinoids and have distinct distributions between hepatocyte and nonparenchymal cell fractions of rat liver. J Nutr. 1997;127(2):218–224. doi: 10.1093/jn/127.2.218. [DOI] [PubMed] [Google Scholar]
- 16.Blomhoff R, Rasmussen M, Nilsson A, Norum KR, Berg T, Blaner WS, Kato M, Mertz JR, Goodman DS, Eriksson U, et al. Hepatic retinol metabolism. Distribution of retinoids, enzymes, and binding proteins in isolated rat liver cells. J Biol Chem. 1985;260(25):13560–13565. [PubMed] [Google Scholar]
- 17.Ong DE, MacDonald PN, Gubitosi AM. Esterification of retinol in rat liver. Possible participation by cellular retinol-binding protein and cellular retinol-binding protein II. J Biol Chem. 1988;263(12):5789–5796. [PubMed] [Google Scholar]
- 18.Zolfaghari R, Ross AC. Lecithin:retinol acyltransferase expression is regulated by dietary vitamin A and exogenous retinoic acid in the lung of adult rats. J Nutr. 2002;132(6):1160–1164. doi: 10.1093/jn/132.6.1160. [DOI] [PubMed] [Google Scholar]
- 19.Liu L, Gudas LJ. Disruption of the lecithin:retinol acyltransferase gene makes mice more susceptible to vitamin A deficiency. J Biol Chem. 2005;280(48):40226–40234. doi: 10.1074/jbc.M509643200. [DOI] [PubMed] [Google Scholar]
- 20.Saari JC, Bredberg DL, Farrell DF. Retinol esterification in bovine retinal pigment epithelium: reversibility of lecithin:retinol acyltransferase. Biochem J. 1993;291(Pt 3):697–700. doi: 10.1042/bj2910697. [DOI] [PMC free article] [PubMed] [Google Scholar]
- 21.Gollapalli DR, Rando RR. All-trans-retinyl esters are the substrates for isomerization in the vertebrate visual cycle. Biochemistry. 2003;42(19):5809–5818. doi: 10.1021/bi0341004. [DOI] [PubMed] [Google Scholar]
- 22.Saari JC, Bredberg DL. Lecithin:retinol acyltransferase in retinal pigment epithelial microsomes. J Biol Chem. 1989;264(15):8636–8640. [PubMed] [Google Scholar]
- 23.Shingleton JL, Skinner MK, Ong DE. Retinol esterification in Sertoli cells by lecithin-retinol acyltransferase. Biochemistry. 1989;28(25):9647–9653. doi: 10.1021/bi00451a016. [DOI] [PubMed] [Google Scholar]
- 24.Herr FM, Wardlaw SA, Kakkad B, Albrecht A, Quick TC, Ong DE. Intestinal vitamin A metabolism: coordinate distribution of enzymes and CRBP(II) J Lipid Res. 1993;34(9):1545–1554. [PubMed] [Google Scholar]
- 25.MacDonald PN, Ong DE. Evidence for a lecithin-retinol acyltransferase activity in the rat small intestine. J Biol Chem. 1988;263(25):12478–12488. [PubMed] [Google Scholar]
- 26.Kurlandsky SB, Gamble MV, Ramakrishnan R, Blaner WS. Plasma delivery of retinoic acid to tissues in the rat. J Biol Chem. 1995;270(30):17850–17857. doi: 10.1074/jbc.270.30.17850. [DOI] [PubMed] [Google Scholar]
- 27.Guo X, Ruiz A, Rando RR, Bok D, Gudas LJ. Esterification of all-trans-retinol in normal human epithelial cell strains and carcinoma lines from oral cavity, skin and breast: reduced expression of lecithin:retinol acyltransferase in carcinoma lines. Carcinogenesis. 2000;21(11):1925–1933. doi: 10.1093/carcin/21.11.1925. [DOI] [PubMed] [Google Scholar]
- 28.Kurlandsky SB, Duell EA, Kang S, Voorhees JJ, Fisher GJ. Auto-regulation of retinoic acid biosynthesis through regulation of retinol esterification in human keratinocytes. J Biol Chem. 1996;271(26):15346–15352. doi: 10.1074/jbc.271.26.15346. [DOI] [PubMed] [Google Scholar]
- 29.Randolph RK, Winkler KE, Ross AC. Fatty acyl CoA-dependent and - independent retinol esterification by rat liver and lactating mammary gland microsomes. Arch Biochem Biophys. 1991;288(2):500–508. doi: 10.1016/0003-9861(91)90227-a. [DOI] [PubMed] [Google Scholar]
- 30.Guo X, Knudsen BS, Peehl DM, Ruiz A, Bok D, Rando RR, Rhim JS, Nanus DM, Gudas LJ. Retinol metabolism and lecithin:retinol acyltransferase levels are reduced in cultured human prostate cancer cells and tissue specimens. Cancer Res. 2002;62(6):1654–1661. [PubMed] [Google Scholar]
- 31.O'Byrne SM, Wongsiriroj N, Libien J, Vogel S, Goldberg IJ, Baehr W, Palczewski K, Blaner WS. Retinoid absorption and storage is impaired in mice lacking lecithin:retinol acyltransferase (LRAT) J Biol Chem. 2005;280(42):35647–35657. doi: 10.1074/jbc.M507924200. [DOI] [PMC free article] [PubMed] [Google Scholar]
- 32.Batten ML, Imanishi Y, Maeda T, Tu DC, Moise AR, Bronson D, Possin D, Van Gelder RN, Baehr W, Palczewski K. Lecithin-retinol acyltransferase is essential for accumulation of all-trans-retinyl esters in the eye and in the liver. J Biol Chem. 2004;279(11):10422–10432. doi: 10.1074/jbc.M312410200. [DOI] [PMC free article] [PubMed] [Google Scholar]
- 33.Chen AC, Guo X, Derguini F, Gudas LJ. Human breast cancer cells and normal mammary epithelial cells: retinol metabolism and growth inhibition by the retinol metabolite 4-oxoretinol. Cancer Res. 1997;57(20):4642–4651. [PubMed] [Google Scholar]
- 34.Guo X, Gudas LJ. Metabolism of all-trans-retinol in normal human cell strains and squamous cell carcinoma (SCC) lines from the oral cavity and skin: reduced esterification of retinol in SCC lines. Cancer Res. 1998;58(1):166–176. [PubMed] [Google Scholar]
- 35.Gillespie RF, Gudas LJ. Retinoid regulated association of transcriptional co-regulators and the polycomb group protein SUZ12 with the retinoic acid response elements of Hoxa1, RARbeta(2), and Cyp26A1 in F9 embryonal carcinoma cells. J Mol Biol. 2007;372(2):298–316. doi: 10.1016/j.jmb.2007.06.079. [DOI] [PMC free article] [PubMed] [Google Scholar]
- 36.Makkink MK, Schwerbrock NM, Mahler M, Boshuizen JA, Renes IB, Cornberg M, Hedrich HJ, Einerhand AW, Buller HA, Wagner S, Enss ML, Dekker J. Fate of goblet cells in experimental colitis. Dig Dis Sci. 2002;47(10):2286–2297. doi: 10.1023/a:1020147630032. [DOI] [PubMed] [Google Scholar]
- 37.Boshuizen JA, Reimerink JH, Korteland-van Male AM, van Ham VJ, Bouma J, Gerwig GJ, Koopmans MP, Buller HA, Dekker J, Einerhand AW. Homeostasis and function of goblet cells during rotavirus infection in mice. Virology. 2005;337(2):210–221. doi: 10.1016/j.virol.2005.03.039. [DOI] [PubMed] [Google Scholar]
- 38.Rojanapo W, Lamb AJ, Olson JA. The prevalence, metabolism and migration of goblet cells in rat intestine following the induction of rapid, synchronous vitamin A deficiency. J Nutr. 1980;110(1):178–188. doi: 10.1093/jn/110.1.178. [DOI] [PubMed] [Google Scholar]
- 39.De Luca L, Little EP, Wolf G. Vitamin A and protein synthesis by rat intestinal mucosa. J Biol Chem. 1969;244(4):701–708. [PubMed] [Google Scholar]
- 40.White JA, Beckett-Jones B, Guo YD, Dilworth FJ, Bonasoro J, Jones G, Petkovich M. cDNA cloning of human retinoic acid-metabolizing enzyme (hP450RAI) identifies a novel family of cytochromes P450. J Biol Chem. 1997;272(30):18538–18541. doi: 10.1074/jbc.272.30.18538. [DOI] [PubMed] [Google Scholar]
- 41.Kim YK, Wassef L, Hamberger L, Piantedosi R, Palczewski K, Blaner WS, Quadro L. Retinyl ester formation by lecithin:retinol acyltransferase is a key regulator of retinoid homeostasis in mouse embryogenesis. J Biol Chem. 2008;283(9):5611–5621. doi: 10.1074/jbc.M708885200. [DOI] [PMC free article] [PubMed] [Google Scholar]