Abstract
Zebrafish has been in the forefront of developmental biology and genetics, but only recently has interest in their behavior increased. Zebrafish are small and prolific, which lends this species to high throughput screening applications. A typical feature of zebrafish is its propensity to aggregate in groups, a behavior known as shoaling. Thus zebrafish has been proposed as a possible model organism appropriate for the analysis of the genetics of vertebrate social behavior. However, shoaling behavior is not well characterized in zebrafish. Here, using a recently developed software application, we first investigate how zebrafish respond to conspecific and heterospecific fish species that differ in coloration and/or shoaling tendencies. We found that zebrafish shoaled with their own species but not with two heterospecific species, one of which was a shoaling the other a non-shoaling species. In addition, we have started the analysis of visual stimuli that zebrafish may utilize to determine whether to shoal with a fish or not. We systematically modified the color, the location, the pattern, and the body shape of computer animated zebrafish images and presented them to experimental zebrafish. The subjects responded differentially to some of these stimuli showing preference for yellow and avoidance of elongated zebrafish images. Our results suggest that computerized stimulus presentation and automated behavioral quantification of zebrafish responses are feasible, which in turn implies that high throughput forward genetic mutation or drug screening will be possible in the analysis of social behavior with this model organism.
Keywords: behavioral phenotyping, Danio rerio, shoaling, social behavior, zebrafish
INTRODUCTION
Zebrafish has enjoyed much success in developmental biology for the past three decades and is now utilized as a model organism in the analysis of a number of human diseases [26]. An impressive arsenal of genetic tools has been developed for this species [19]. Given the prolific nature of zebrafish (one may obtain 200–400 eggs from a single female every other day), and the well developed genetic tools, zebrafish has been successfully used in forward genetic studies in which induced random genetic mutations are screened on the basis of the phenotypical change they caused [3]. As a result of the strong genetics and the successful use of zebrafish in screening applications, this species has now been considered for a number of other disciplines. One of these disciplines is behavioral genetics [16]. As we and others have argued before, behavioral analysis can be a comprehensive and unbiased way with which functional changes of the brain may be detected [for review see 15, 13]. Indeed behavioral screening has allowed the identification of zebrafish mutants too, for example, in the area of drug addiction related research [7]. However, behavioral screening tools are rare and zebrafish behavior is relatively understudied [38]. This represents a significant mismatch compared to the sophisticated genetics developed for this species. Briefly, the bottle-neck in forward genetic analysis of brain related mechanisms in zebrafish is the behavioral screening tools. The goal of the current paper is to investigate aspects of social behavior of zebrafish and to explore certain behavioral tests and quantification methods so that future automation and increased throughput of testing may be achieved.
Our rationale to focus on social behavior is twofold. First, zebrafish is a highly social species that prefers swimming in groups, an aggregation behavior termed shoaling [32] and described in a number of fish species [e.g. 37, or for more recent examples see 45]. Other traditional laboratory organisms including the mouse and the rat, or simpler organisms such as drosophila or the nematode, do not exhibit the degree of social cohesion and group preference displayed by zebrafish. Thus in addition to the genetics tools developed for zebrafish, its behavioral characteristics make this species particularly appropriate for the proposed analysis. Second, the mechanisms of social behavior of vertebrates including our own species are not clearly understood and as a result diseases associated with abnormal social behaviors in humans (including social phobias and, e.g., the autism spectrum disorders) have been difficult to treat [e.g. 39, 12, 10, 21]. Given the high nucleotide and amino acid sequence homologies found at the DNA and protein levels between zebrafish and mammals including humans [4] and the similarities of the basic layout of the brain of these species [40], it is not unlikely that the analysis of genetic mechanisms of social behavior of zebrafish will yield results that generalize and translate to other vertebrate species including our own [40, 28].
In the current paper we first investigate how experimental zebrafish respond to live stimulus fish during an encounter in which five fish of each group (experimental and stimulus) are able to freely swim with each other. We compare how experimental zebrafish respond to four different types of stimulus fish: their own conspecifics that look similar to them, their conspecifics whose color is slightly different (a color variant), heterospecific fish that show shoaling tendencies similar to those of zebrafish, and heterospecific species that does not shoal. Greater similarity among group members has been found to reduce predation under natural conditions by minimizing phenotypic oddity [27]. We therefore hypothesize that experimental zebrafish will shoal with stimulus fish most similar to them but not with those whose behavior (non-shoaling vs. shoaling) and/or appearance (color, pattern, and shape) is different.
Previously, preference of zebrafish for certain stimulus fish was investigated in choice paradigms [9]. The results demonstrated that zebrafish were sensitive to certain characteristics of the stimulus fish and the preference was strongly influenced by early experience during development. However, systematic analysis of these cues may not be performed using live stimulus fish. In the second experiment of the current paper, we investigate certain visual characteristics of stimulus fish that experimental zebrafish may prefer or avoid. We utilize a simple software application developed in-house that allowed us to present animated, i.e. moving, images of stimulus fish whose appearance and movement characteristics could be precisely controlled. We explore the effect of modifying the color, the stripe pattern, the body shape, or the location of swimming of the animated stimulus fish and quantify how experimental zebrafish respond to these modifications in comparison to normal unmodified images. We conduct these studies in the hope that in the future our experimental procedures and behavioral quantification methods will help us develop automated and high throughput test paradigms with which the biological mechanisms of social behavior of zebrafish could be studied, a goal that will ultimately lead to better understanding of the genetics of social behavior in other vertebrates including humans.
METHODS
Animals and housing
Zebrafish (Danio rerio), or zebra danio, were obtained (50% males and females) from a local aquarium store (Big Al’s Aquarium Warehouse Services, Mississauga, ON, Canada). At the time of purchase, the fish were 3 cm long and approximately 3 months old. The fish were acclimatized in our zebrafish vivarium for a minimum of 3 months and at their approximate age of 6–8 months (when 4 cm long) were behavioral tested. Zebrafish reach sexual maturity by their age of 3–4 months, live for about 3–5 years, and maintain fertility throughout their lifespan [43]. The fish used in the current experiments are considered fully mature young adults. The fish showed the characteristics of wild caught fish exhibiting the natural short fin and wild color and stripe pattern as opposed to the features of ornamental zebrafish sometimes found in the pet trade, e.g. elongated fin and altered color or pattern. Our experimental fish are expected to have high genetic heterogeneity and, as they originate from a breeding facility in Singapore close to the current geographical location of the species, the population is expected to possess characteristics that resemble those found in the natural population [5].
Fish were housed in groups of five in 2.8 liter Plexi-glass aquaria that were part of a recirculating filtration aquaculture rack system designed and built by Aquaneering Inc (San Diego, CA, USA) specifically for zebrafish. The tank water was reverse osmosis purified and was supplemented with 60 mg/liter Instant Ocean Sea Salt (system water). Water temperature was kept at 26 °C and a 12 hour light and dark cycle was maintained with lights on at 7 am and off at 7 pm. All fish were fed four times daily, twice with TetraMin Tropical fish flake food (Tetra Co, Melle, Germany) and twice with live nauplii of brine shrimp (Artemia salina, San Francisco Bay Brand, San Francisco CA USA). In the first experiment, live stimulus fish were also used to which experimental zebrafish were expected to respond. Four different types of stimulus fish were employed: wild type zebrafish, gold variety (a color variant) of zebrafish, white cloud (Tanichthys albonubes), and platy (Xiphophorus maculates). All fish were of the same length (4 cm) as the experimental zebrafish and they were obtained from a local pet store and were maintained under the same conditions (water quality, feeding regimen, light cycle, temperature and population density) as the experimental zebrafish. The stimulus fish and the experimental zebrafish were not exposed to each other before the experiments.
In order for the experimental zebrafish and the stimulus zebrafish to be distinguishable, each stimulus zebrafish was marked as follows: the fish were gently placed in a Petri dish and using a scalpel the top 1.5 mm portion of their caudal fin was removed. The marked fish were returned to their home tanks and were allowed to recover for a week before testing begun. No infections or mortality were observed among these fish. All of them remained healthy and active, ate well, and showed no signs of discomfort or alterations in behavior.
Experiment 1
The purpose of this experiment was to investigate how zebrafish respond to different stimulus fish species. Zebrafish have been found to shoal mainly with its own species in nature [8]. Under experimental conditions too zebrafish have been found to exhibit strong social preference towards other zebrafish that look like them but this preference was found to depend upon early experience during development [9]. However, shoaling per se has not been evaluated directly under experimental conditions in zebrafish. For example, in the latter study a preference exhibited by single experimental fish in a choice paradigm was studied. In the current paper we quantify the distribution of experimental fish forming a free swimming shoal in relation to a group of stimulus fish also allowed to swim freely and thus aim to obtain a more direct measure of shoaling tendencies. We studied whether zebrafish shoal only with other zebrafish identical in appearance to them, whether they shoal with other zebrafish whose color is different from theirs, whether they shoal with another shoaling species, or whether they shoal with another species that does not exhibit shoaling tendencies respectively.
Apparatus
A 40 liter glass tank, measuring 51 cm × 30 cm × 25 cm (length × width × depth) served as the experimental tank. The back side and bottom of the tank was covered with white corrugated plastic sheet from the outside to enhance contrast for video-analysis. A divider, also made of white corrugated plastic (1 cm × 23 cm × 28 cm), was inserted into the middle of the tank during habituation. The tank was filled with system water that was identical in salt concentration, pH, and temperature to the water used for the home aquaria of the fish.
Procedure
Five experimental fish (a shoal of mixed sexes, on average 50-50% females and males) were placed on one side of the central divider and five stimulus fish (or no fish) were placed on the other side. The fish were left separated in the experimental tank for 10 min (habituation period). Subsequently, the divider was removed and a 10 min experimental session was video-recorded during which all fish were allowed to freely swim in the tank. Experimental zebrafish had one recording session each day for a total of five consecutive days. In four test sessions the behavior of the five experimental fish and the five stimulus fish was monitored and in one session (control) the experimental zebrafish shoal was recorded without the presence of any stimulus fish. Each experimental zebrafish shoal was exposed to one stimulus condition a day until all experimental shoals encountered all stimulus conditions, a repeated measure, i.e. within individual design. The order of presentation of stimulus conditions was randomized.
Quantification of Behavior
Experimental sessions were recorded from above using a Sony DCR-HC20 miniDV camcorder and the recordings were transferred to windows media files via Microsoft Windows Movie Maker. Still images were obtained for every 10 sec of each recording session. From each image, the average distance among all members of the experimental zebrafish shoal, the average distance among all members of the stimulus group, and the average distance between all experimental and stimulus fish was quantified and computed using a custom made software application previously developed in our laboratory and described in detail elsewhere [28]. The distance values obtained were then averaged and analyzed for three separate 30 sec intervals of the recording session: T1 = 60–90 sec, T2 = 300 – 330 sec, T3 = 570 – 600 sec (where the numbers represent the elapsed time from the start of the recording session).
Statistical analysis
No significant gender effects were found and thus genders are pooled for all analyses. Two-factorial repeated measures analysis of variance (ANOVA) was employed to investigate the effect of stimulus condition on the behavior of the experimental zebrafish (within subject factor 1 with five levels: wild type zebrafish, gold zebrafish, white cloud, platy, no stimulus control) and time interval (within subject factor 2 with three levels: T1, T2 and T3). Where no time interval or time interval × stimulus condition interaction effect was found, the time factor was collapsed by averaging the three intervals, and the statistical analysis was conducted on the interval average. Where significant main effects or interaction terms were found, post hoc comparisons were conducted. Note that multiple post hoc comparison tests including the often employed Tukey Honestly Significant Distance test is not appropriate for repeated measure designs. Although it yielded similar results, here we report the findings of paired multiple T-tests with Holm type-1 error correction, a method deemed more appropriate according to Aickin & Gensler [1]. Univariate ANOVA was conducted to analyze differences among stimulus fish (between subject factor) and the effect of time (time interval, a repeated measure factor). As no significant time interval or time interval × stimulus species interaction effect was found, the time factor was collapsed by averaging the three intervals, and the statistical analysis was conducted on the interval average. After a significant main effect was found for stimulus fish species, post hoc Tukey HSD test was conducted to reveal which stimulus species differed from which. All statistical analyses were performed using SPSS 14 for the PC.
Experiment 2
The purpose of the second experiment was to systematically manipulate some visual cues we assumed would be important for zebrafish to make decisions about whether to shoal or not to shoal with a group of fish. We employed computer animations in which we presented images of a group of slowly moving zebrafish to experimental zebrafish. Many fish species preferentially associate with conspecific shoal mates [for review see ref 23] but individuals may also accept familiar heterospecific fish or those that are not substantially different from them [42]. Thus in our current paradigm we wanted to evaluate how systematic changes in the visual characteristics of animated zebrafish images vs. unaltered images may affect experimental zebrafish. On one side of the tank the experimental fish could view modified and on the other side unmodified (normal short fin wild type) images of zebrafish, a set up that allowed us to see the effect of the modifications relative to the effect of unmodified images and one which facilitated evaluation of shoaling preferences. Similar simple choice paradigms have been utilized in a range of species including the house mouse [34] and zebrafish (e.g. [9, 5, 35]. The side on which the unmodified or modified images was shown remained constant for each session but changed randomly across experimental fish. The image modifications we employed were as follows: body coloration (red vs. unmodified, yellow vs. unmodified), location of stimulus (bottom vs. top), stripe pattern (stripless vs. unaltered, vertical striped vs. unaltered), body shape (stretched vs. unaltered, compressed vs. unaltered).
Stimulus Construction
A custom software application developed in our laboratory was used to present the animated images. All images were generated from the photograph of the same zebrafish subject (Figure 5, panel A). The subject was a female wild type (short fin) zebrafish obtained from a local pet store (Big Al’s) belonging to the same population of fish we used as experimental zebrafish. The rationale for using images of a single female fish to present the animated “shoal” is as follows. Gender composition of the zebrafish shoal has been found to influence shoal preference in zebrafish [36]. For example, in some choice tests all-male shoals were less preferred by males, but all-female shoals were treated the same manner by both genders and appeared neutral in all choice tests [36].
Figure 5.
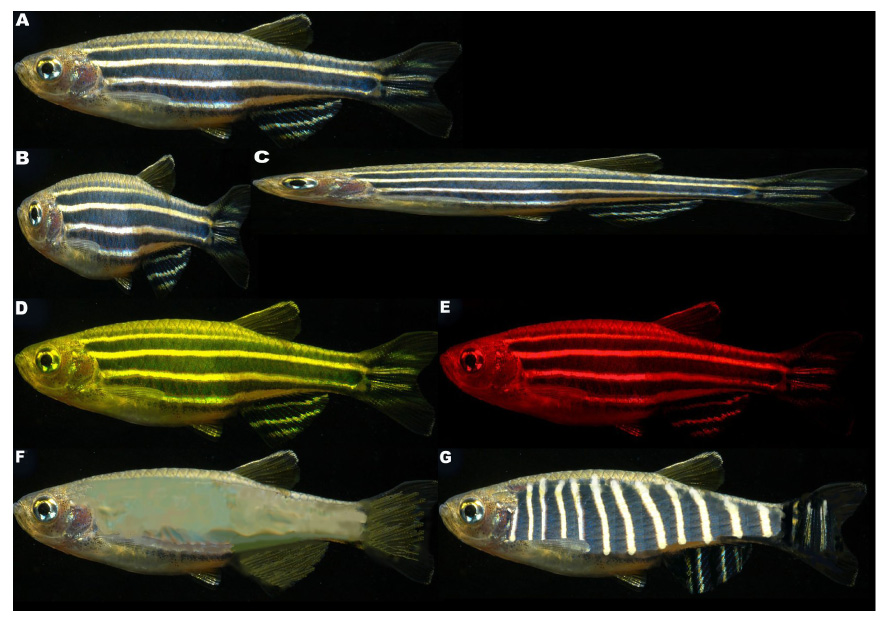
The photograph of an adult wild type zebrafish (A) was electronically modified to generate altered images in which body proportions (compressed (B) or stretched (C)), color (yellow (D) or red hue (E)), or stripe pattern (lack of stripes (F) or vertical stripes (G)) was manipulated. In each experiment animated (moving) images of five identically altered zebrafish were shown on one side of the experimental tank and moving images of five unaltered (wild type) zebrafish on the other. In addition, a set of five unaltered zebrafish images were also presented near the surface vs. near the bottom. For additional experimental details see Methods section.
Shoal size may also affect shoaling decisions [36]. In large shoals competition may increase among shoal mates. And although a particular individual may be protected in a large shoal from predators due to the dilution effect, larger shoals generally attract predators, more than smaller ones [for a review and examples see 45]. On the other hand, very small shoals may not offer protection against predators. Thus there may be an optimal shoal size [reviewed in 45]. Based on these considerations and our own preliminary studies, we decided to present a total of 5 stimulus fish in all of our animations. The size of the animated fish was identical to that of the experimental fish (4 cm), except for those images for which the alteration of body shape was required. The direction and speed of swimming (maximum speed 9 cm/sec, average speed 1.5 cm/sec) and starting location of the animated fish were random but corresponded to the usual swimming characteristics of live zebrafish. The background of the computer-screens was black during all animation sessions.
Using Adobe Photoshop CS2 (Adobe Systems Inc., San Francisco, CA, USA) specific modifications were made to the original image as follows. Color changes: The original zebrafish image was altered to produce a yellow (Figure 5D) and a red (Figure 5E) zebrafish image. The stripe pattern and shading of the original image was maintained. Location of animated fish images: the animated shoal swam either within the 9 cm region from the water line (top) or within the 9 cm region from the bottom (bottom). Pattern: Stripeless and vertically striped zebra fish images were created. To produce a stripeless zebra fish (Figure 5F), dark blue stripes were removed and filled with light green body color. To produce a vertically striped zebrafish image, the original zebra fish image had sections of its horizontal stripes cut out and rotated 90 degrees (Figure 5G). Body shape: Two images were produced by either compressing (Figure 5B) or stretching (Figure 5C) the original image. The compressed (“fat”) image was made to be thicker by 5 mm and shorter by 10 mm than the original image, whereas, the stretched (“skinny”) image was made to be thinner by 5mm and longer by 10 mm than the original image.
Apparatus
The test tank used for this set-up was identical to that of Experiment 1. A ViewSonic (Graphic series G771) monitor (diagonal screen size of 32.5 cm) connected to a Toshiba Satellite A100/Pro A100 Series computer was positioned at each side of the test tank.
Procedure
Each experimental zebrafish received one test session. A test session consisted of a 10 min habituation period followed by a 5 min behavioral recording period. During habituation both monitors displayed a monochromatic black screen, whereas after habituation, monitors displayed the appropriate computer animation. One monitor displayed the unaltered zebrafish images and the other the altered images. In case of the study of the effects of the location of zebrafish images, one monitor showed the zebrafish shoal swimming on top and the other on the bottom. The location of the unaltered vs. altered images (and the top vs. bottom shoal) varied randomly from session to session.
Quantification of behavior
The experimental tank was divided into three equal imaginary sections: left and right (choice section) and center (each 17 cm in length). The percentage of time fish spent in each section of the tank was recorded using the Observer ColorPro Event Recording software (Noldus Information Technology, Wageningen, The Netherlands). In addition, three motor patterns were also quantified: percent of time swimming (locomotion in any direction without touching the glass walls), freezing (completely motionless state while only the opercula and occasionally the eyes may move) and thrashing (moving back and forth against the aquarium glass while physically in contact with the glass).
Statistical Analysis
One sample T-tests with Holm type-1 error correction [1] were conducted to analyze whether experimental fish spent time below or above chance (chance = 33%) in each of the three sections of the experimental tank, an approach similar to that of Ruhl & McRobert [36]. In addition, bivariate Pearson Product Moment correlation coefficients were computed to examine the correlation between time of testing and the motor patterns, the correlation between center dwell time and the motor patterns, and the correlation between Thrashing and left vs. right section dwell time respectively (for rationale of these calculations see Results section). All statistical analyses were performed using SPSS 14 for the PC.
RESULTS
Experiment 1
The distance among experimental zebrafish was found to be dependent upon the stimulus treatment employed (figure 1). Repeated measure ANOVA revealed no significant time interval or time × stimulus treatment interaction effects, but the analysis of the time interval averaged data confirmed a significant stimulus treatment effect (repeated measure ANOVA F(4, 36) = 7.004, p < 0.001). Comparison of the groups (t-test with Holm Type I error correction) showed that experimental zebrafish had the largest distance (p < 0.05) among them when encountering their own kind (wild type zebrafish stimulus treatment) as compared to when receiving other stimulus treatments. Experimental zebrafish also exhibited a significantly (p < 0.05) larger distance among them when encountering the gold color variety of zebrafish as stimulus treatment as compared to when receiving the non-zebrafish stimulus treatments. When presented with no stimulus fish the experimental zebrafish exhibited the smallest shoal distance, a value that was significantly (p < 0.05) smaller compared to when they encountered all but the white cloud stimulus treatment.
Figure 1.
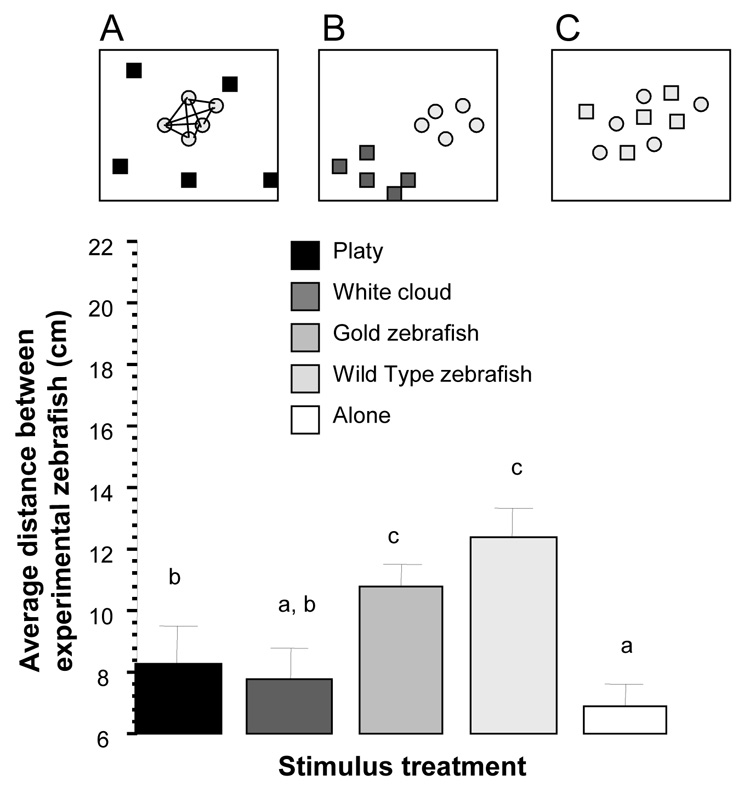
Average distance between experimental zebrafish is significantly affected by stimulus condition. Mean ± S.E.M. are shown. Bars that share a letter designation are not significantly (p > 0.05) different. Panel A illustrates what was measured: the distances (straight lines connecting the light grey circles) between all pairs of experimental zebrafish (light grey circles). Panels A, B, and C are representative examples of distribution of fish: Experimental zebrafish (light grey circles, n=10) encountering (A) platys (black squares, n=10), (B) white cloud (dark grey squares, n=10), or (C) other wild type zebrafish (light grey squares, n=10, where ‘n’ represents the number of 5-fish shoals). Note the scattering of the platys on panel A. Also note the separate shoals the white cloud and experimental zebrafish formed shown on panel B. Last, note that the distances among experimental zebrafish were largest (panel C) when the stimulus fish they encountered were their conspecifics (wild type zebrafish or “gold” zebrafish). This was because experimental zebrafish distributed themselves among, i.e. shoaled with, the stimulus fish. For details of results of the statistical analysis, see Results section.
Analysis of the distance among stimulus fish (figure 2) again revealed no time and time × stimulus fish interaction effects and thus data are shown and analyzed as collapsed (averaged) across time intervals. Comparison of stimulus fish represents analysis of differences among independent groups, a between individual design. Non-repeated measure univariate ANOVA revealed a significant stimulus group difference (F(3, 27) = 18.622, p < 0.001) and Tukey post hoc HSD test confirmed what we have known about the studied species: Being a non-shoaling species, platy showed a distance significantly (p < 0.05) larger than the other three stimulus fish, which, being shoaling fish, showed small distance values among shoal members that did not significantly differ across these three stimulus fish types.
Figure 2.
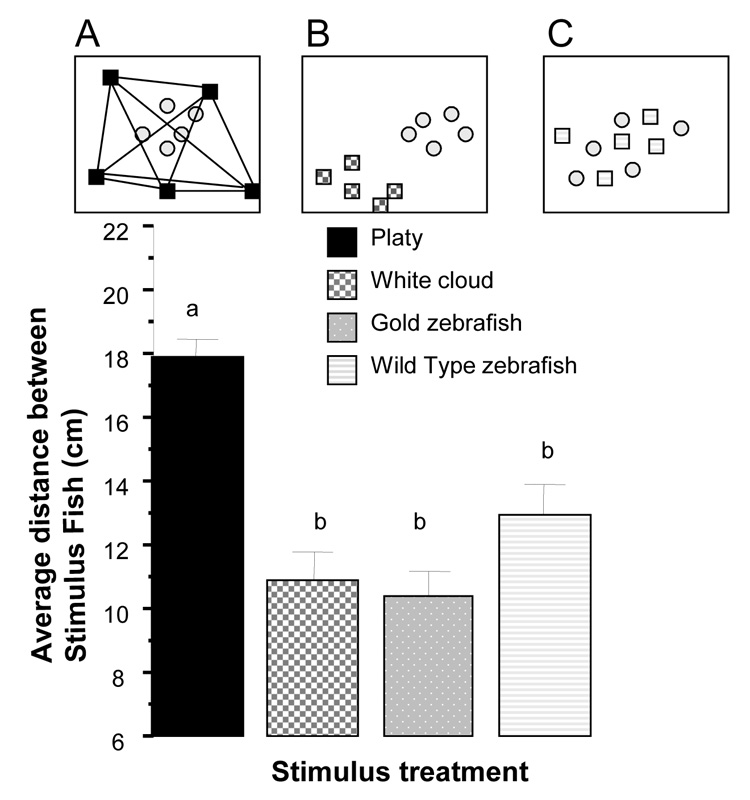
Average distance between stimulus fish significantly depends upon the species of stimulus fish. Mean ± S.E.M. are shown. Sample sizes are as in figure 1. Bars that share a letter designation are not significantly (p > 0.05) different. Panel A illustrates what was measured: the distances (straight lines connecting the black squares) between stimulus fish (black squares representing the platy in this case). Panels A, B, and C are the same representative examples of distribution of fish given on figure 1: Experimental zebrafish (light grey circles) encountering (A) platys (black squares), (B) white cloud (dark grey hatched squares), or (C) other wild type zebrafish (light grey striped squares). Note that platys showed a significantly increased distance among them compared to all other stimulus fish. For details of results of the statistical analysis, see Results section.
Perhaps the most important results concern the distance between stimulus and experimental fish. Repeated measure ANOVA revealed a significant time interval effect (F(2, 18) = 3.851, p < 0.05) and significant stimulus treatment effect (F(3, 27) = 22.658, p < 0.001) but the time interval × stimulus treatment interaction was found non-significant (F(6, 54) = 0.522, p > 0.75). Given that the time interval × stimulus treatment interaction term was non-significant we depict the differences among stimulus treatment groups pooled for the three time intervals on figure 3. To illustrate the significant time effect Figure 4 presents the data separately for the three intervals. Post hoc comparison of the groups (t-test with Holm Type I error correction) showed that the distance between experimental zebrafish and platy was the largest, the distance between the experimental zebrafish and white cloud was significantly (p < 0.05) smaller, and the distance between experimental zebrafish and either the gold zebrafish or the wild type zebrafish was the smallest, both significantly (p < 0.05) differing from the other stimulus conditions but not from each other. In summary, zebrafish shoaled least with a non-shoaling heterospecific fish, shoaled somewhat with a heterospecific shoaling species, and shoal best (closest) with their own species.
Figure 3.
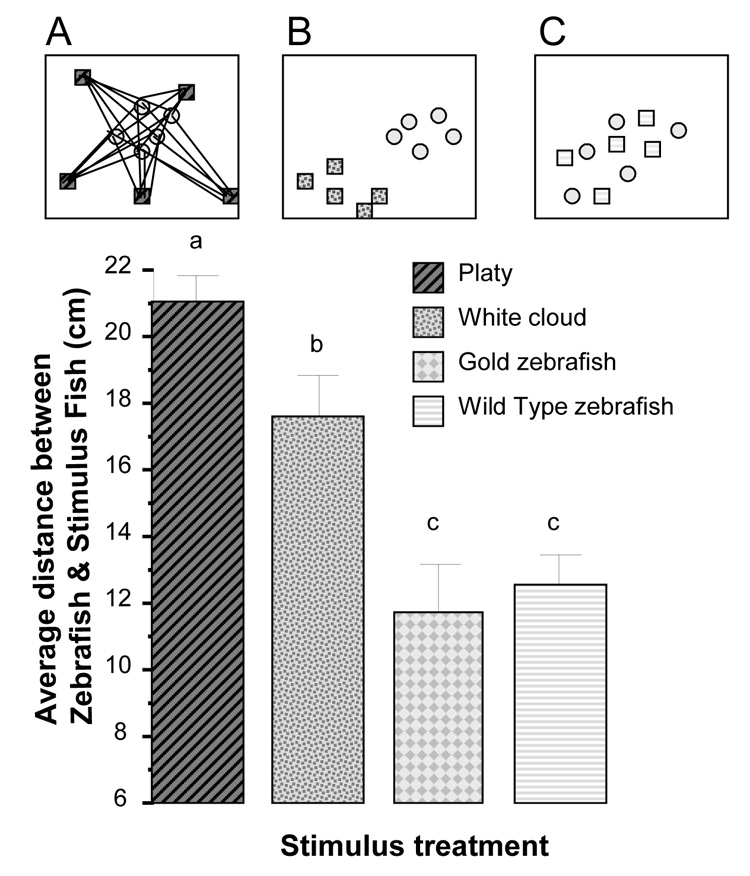
Average distance between stimulus fish and experimental zebrafish significantly depends upon the species of stimulus fish. Mean ± S.E.M. are shown. Sample sizes are as in figure 1. Bars that share a letter designation are not significantly (p > 0.05) different. Panel A illustrates what was measured: the distances (straight lines) between stimulus fish (black striped squares) and experimental zebrafish (grey circles). Panels A, B, and C are the same representative examples of distribution of fish given on figure 1: Experimental zebrafish (light grey circles) encountering (A) platys (black striped squares), (B) white cloud (dark grey hatched squares), or (C) other wild type zebrafish (light grey striped squares). Note that experimental zebrafish stayed farthest from platys less far from white cloud and least far from their own conspecifics (wild type or gold zebrafish). For details of results of the statistical analysis, see Results section.
Figure 4.
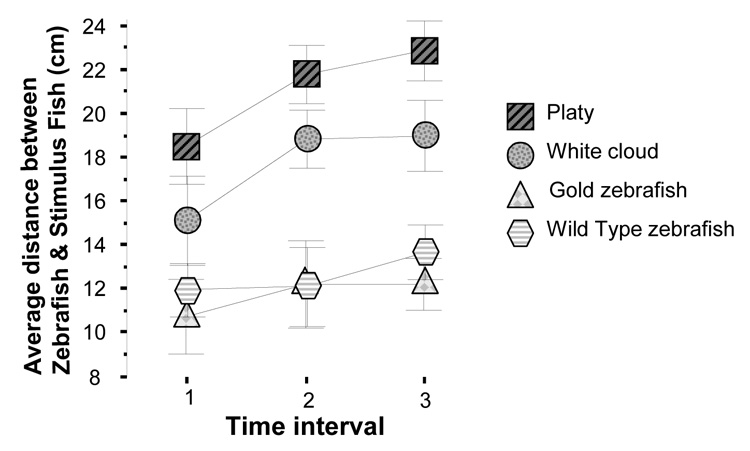
Average distance between stimulus fish and experimental zebrafish across three intervals. Mean ± S.E.M. are shown for three time intervals: T1 = 60–90 sec, T2 = 300 – 330 sec, T3 = 570 – 600 sec (where 0 sec is the start of the recording session). Sample sizes are as in figure 1. Note that although a significant time effect was found suggesting an overall increase of distance, the time × stimulus treatment interaction was non-significant, i.e. the effect of stimulus treatment was independent of the time. For details of results of the statistical analysis, see Results section.
Experiment 2
The first experiment confirmed that zebrafish did not shoal indiscriminately with other fish. It is possible that the stimulus fish treatment effects were due to the preference exhibited by the stimulus fish. However, it is likely that zebrafish themselves have preferences for certain features and will shoal with fish exhibiting these features. As a proof of concept analysis, therefore, we decided to expose experimental zebrafish to unaltered and altered zebrafish images and quantify their choice. Choice is defined operationally and is quantified by measuring the amount of time zebrafish spent near a particular stimulus, and by statistically analyzing whether the values were above (preference) or below chance (avoidance).
When experimental fish were presented with a choice between unaltered and red colored zebrafish images (figure 6), they showed a significant (above chance) preference for the unaltered zebrafish side (t = 2.25 df = 9, p < 0.05). Also, they were in the third of the tank close to the altered image at chance level (t = 0.27, df = 9, p > 0.50), but they spent significantly below chance proportion of time in the middle section of the tank (t = −9.75, df = 9, p < 0.001). These results suggest that red coloration is not aversive but normal appearance of shoal-mates is preferred.
Figure 6.
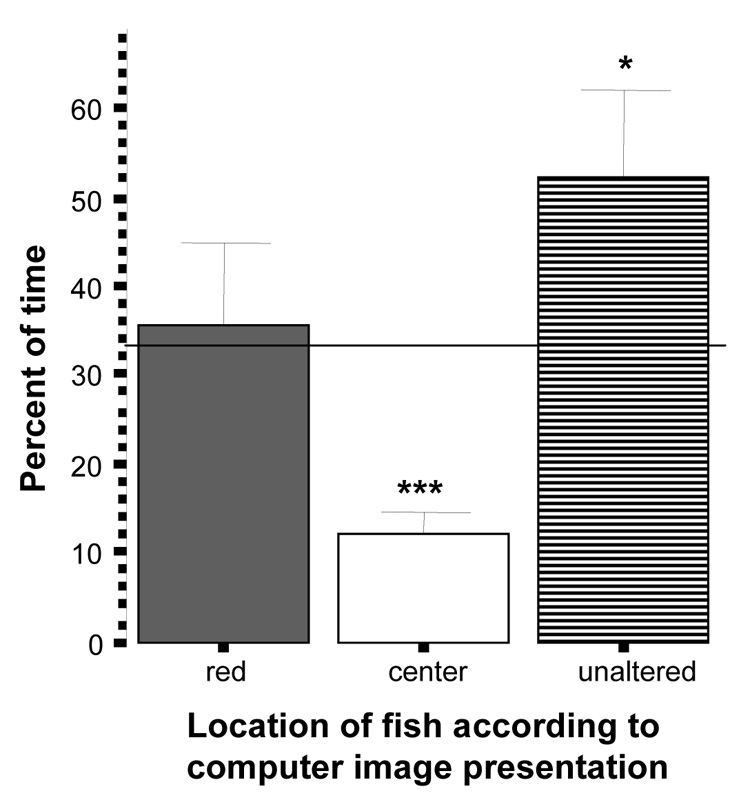
Percent of time zebrafish spent near the red images side, the unaltered images side or the center of the tank. Mean ± S.E.M. are shown (n=10). Random chance (33%) is indicated by the horizontal line. Significant deviation from random chance is indicated by asterisks (*p < 0.05, **p<0.01, ***p<0.001). Note that although zebrafish did not avoid the red images, they showed a significant preference for the unaltered ones.
Interestingly, the results in case of the yellow vs. unaltered images choice were different (figure 7). Experimental zebrafish spent time at chance level in the section of the tank near the unaltered images (t = −1.00, df = 9, p > 0.05) but showed a significant (above chance) preference for the yellow colored altered zebrafish images (t = 3.22, df = 9 , p < 0.01), and again appeared to spend less than 33% time (chance) in the middle (t = −7.73, df = 9, p < 0.001).
Figure 7.
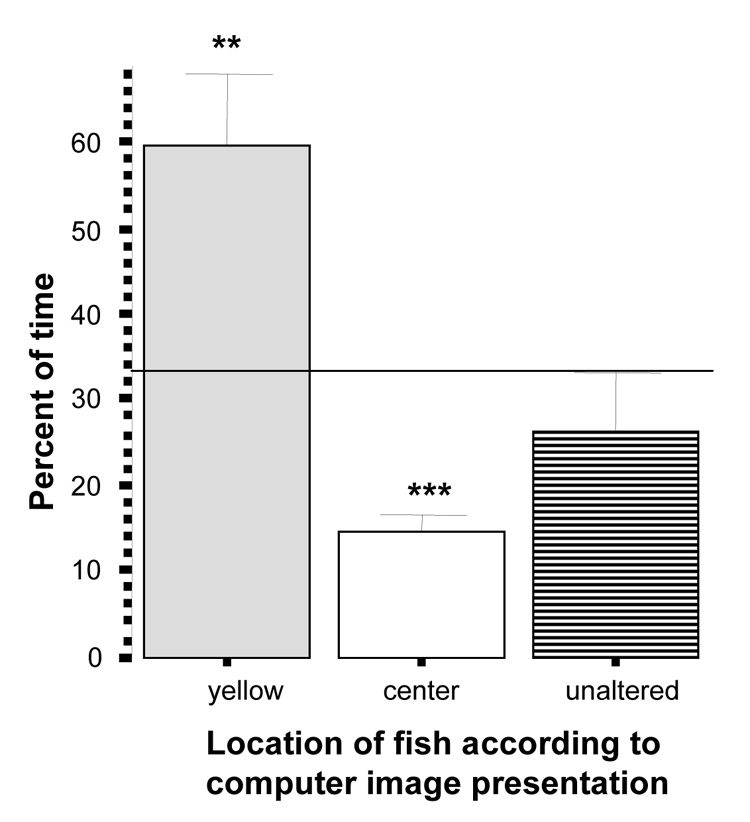
Percent of time zebrafish spent near the yellow images side, the unaltered images side or the center of the tank. Mean ± S.E.M. are shown (n=10). Random chance (33%) is indicated by the horizontal line. Significant deviation from random chance is indicated by asterisks (*p < 0.05, **p<0.01, ***p<0.001). Note that zebrafish showed a significant preference for the yellow images.
Zebrafish spent a similar percentage of time near the top swimming images and the bottom swimming images (figure 8) and neither time was different from random chance (top t = 0.98, df = 19, p > 0.05; bottom t = 1.63, df = 19, p > 0.05). The percent of time in the middle was again significantly below chance (t = −9.75, df = 19, p < 0.001).
Figure 8.
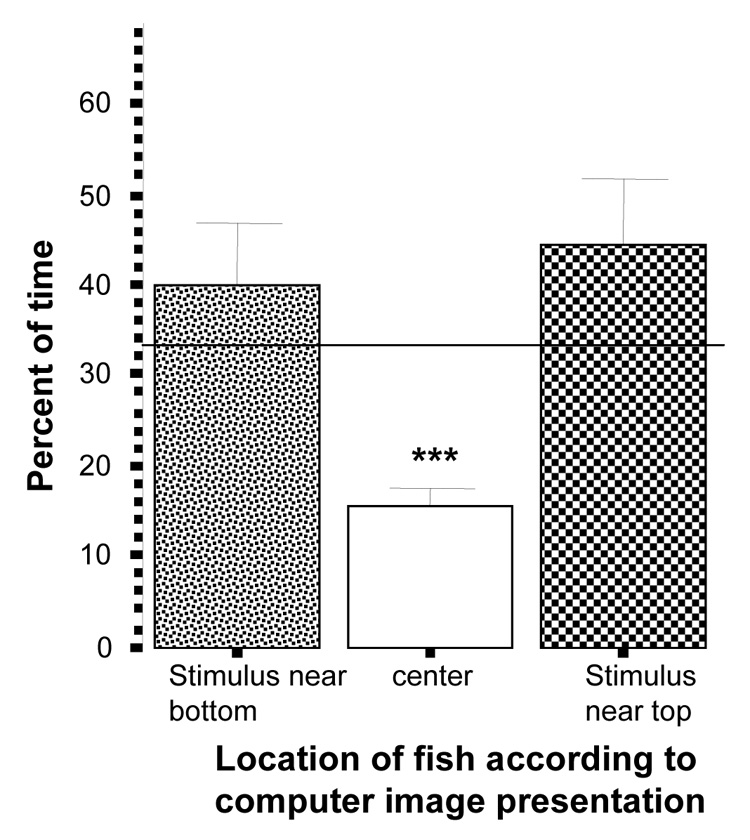
Percent of time zebrafish spent near the side where images were presented on the bottom, the side where the images were presented near the surface, or the center of the tank. Mean ± S.E.M. are shown (n=20). Random chance (33%) is indicated by the horizontal line. Significant deviation from random chance is indicated by asterisks (*p < 0.05, **p<0.01, ***p<0.001). Note that zebrafish showed neither preference for nor avoidance of either image side.
The results for the test in which experimental zebrafish were given a choice between stripeless and unaltered zebrafish images are similar to the above (figure 9). The percent of time zebrafish spent near the altered and unaltered images was not different from random chance (t unaltered = 0.89, df = 9, p > 0.05; t stripeless = 0.81, df = 9, p > 0.05) but the proportion of time they spent in the middle of the tank was significantly below chance (t = −3.56, df = 9, p < 0.01).
Figure 9.
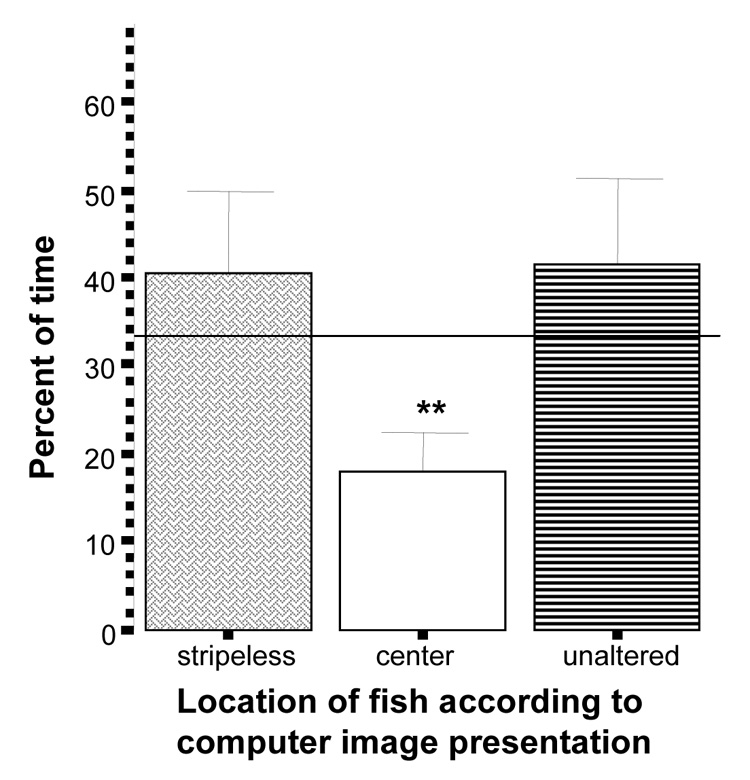
Percent of time zebrafishspent near the stripeless images side, the unaltered images side, or the center of the tank. Mean ± S.E.M. are shown (n=10). Random chance (33%) is indicated by the horizontal line. Significant deviation from random chance is indicated by asterisks (*p < 0.05, **p<0.01, ***p<0.001). Note that zebrafish showed neither preference for nor avoidance of either image side.
Zebrafish also showed no preference towards or avoidance of the vertically striped vs. unaltered zebrafish images (figure 10) and spent time at chance level on both stimulus presentation sides (t unaltered = 0.32, df = 9, p > 0.05; t vertically striped = 0.61, df = 9, p > 0.05). In this test the experimental fish were also at random chance in the middle of the tank (t = −1.52, df = 9, p > 0.05).
Figure 10.
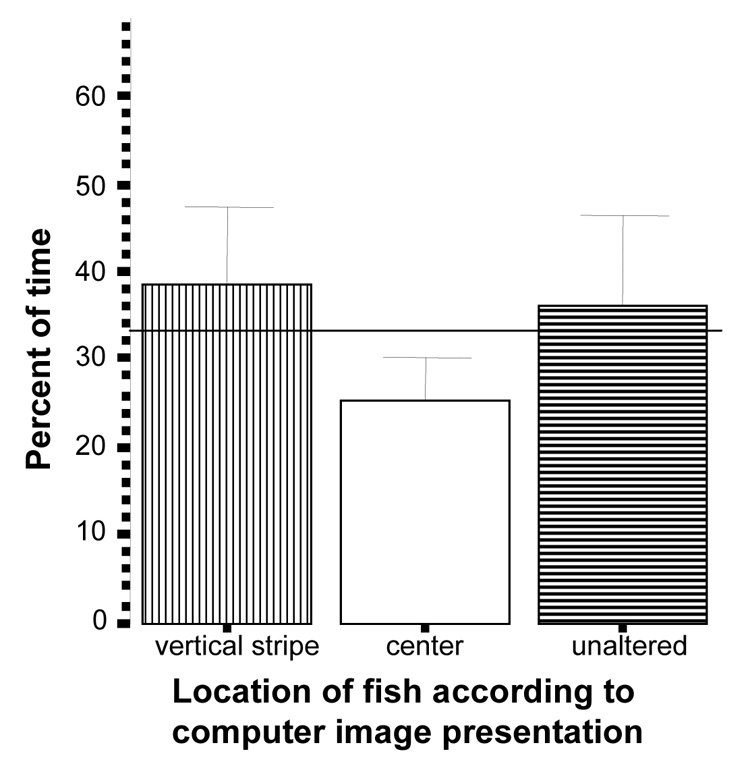
Percent of time zebrafish spent near the vertically striped images side, the unaltered images side, or the center of the tank. Mean ± S.E.M. are shown (n=10). Random chance (33%) is indicated by the horizontal line. Significant deviation from random chance is indicated by asterisks (*p < 0.05, **p<0.01, ***p<0.001). Note that zebrafish showed neither preference for nor avoidance of either image side.
Although in the compressed vs. unaltered choice task it appears that zebrafish spent more time relative to chance near the unaltered zebrafish images (figure 11), the p value did not reach significance (t = 1.39, df = 9, p > 0.05). The proportion of time spent by experimental zebrafish near the altered image was also at chance (t = −0.44, df = 9, p > 0.05) but the percent of time in the middle of the tank was below chance (t = −3.22, df = 9, p < 0.05).
Figure 11.
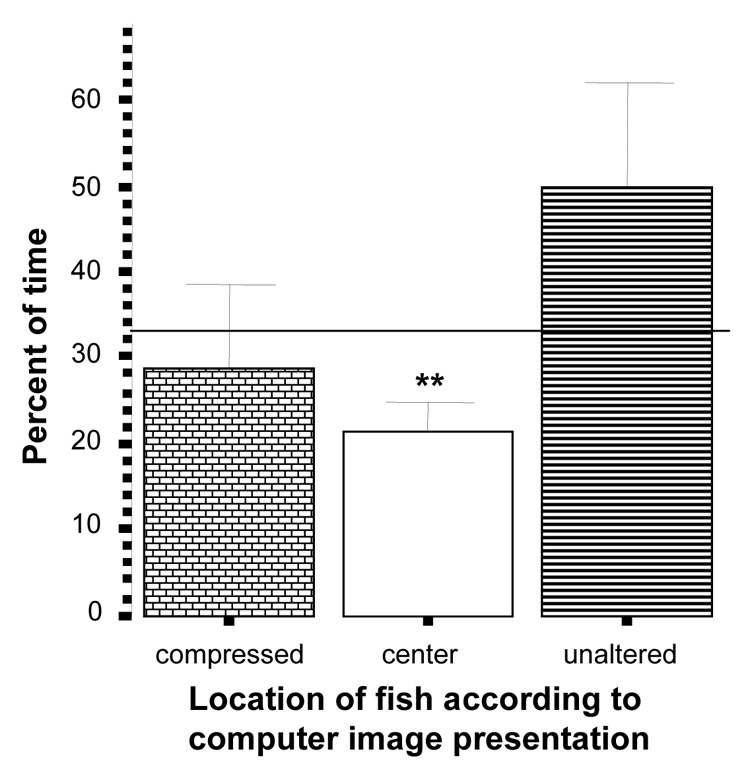
Percent of time zebrafish spent near the compressed (“fat”) images side, the unaltered images side, or the center of the tank. Mean ± S.E.M. are shown (n=10). Random chance (33%) is indicated by the horizontal line. Significant deviation from random chance is indicated by asterisks (*p < 0.05, **p<0.01, ***p<0.001). Note that although the percent of time spent near the unalaterd side appears larger, zebrafish showed neither significant preference for nor avoidance of either image side.
Perhaps the most dramatic effect was found in the test where the stretched zebrafish image vs. unaltered image were presented (figure 12). In this test zebrafish showed a significant preference for the unaltered image, i.e. spent their time in the third of the tank near the unaltered image significantly above chance (t = 4.36, df = 9, p < 0.01). Furthermore, they spent a significantly smaller than chance percent of time near the altered image (avoidance) (t = −4.97, df = 9, p < 0.001). Zebrafish also spent less than chance percent of time in the middle of the tank (t = −2.56, df = 9, p < 0.05).
Figure 12.
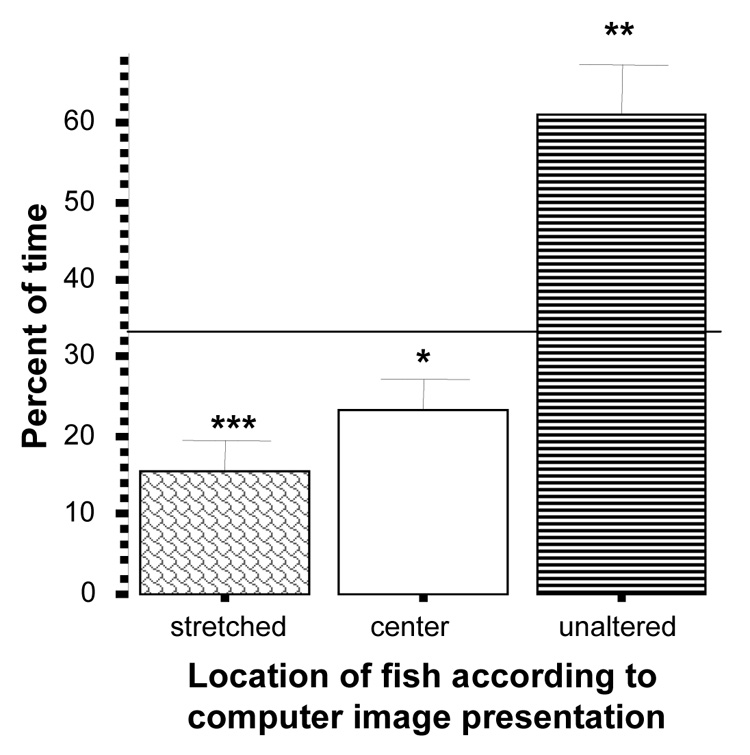
Percent of time zebrafish spent near the stretched (“long skinny”) images side, the unaltered images side, or the center of the tank. Mean ± S.E.M. are shown (n=10). Random chance (33%) is indicated by the horizontal line. Significant deviation from random chance is indicated by asterisks (*p < 0.05, **p<0.01, ***p<0.001). Note that zebrafish spent significantly below chance proportion of time near the altered image and above chance proportion of time near the unaltered one.
In addition to the percent of time spent by the experimental zebrafish in the three sections of the test tank, we also quantified the percent of time the fish exhibited three motor patterns: swimming, thrashing, and freezing (figure 13). We examined these motor patterns because we wanted to ascertain that the “choice” we recorded was not due to abnormal swim patterns, e.g. a zebrafish freezing in one side of the tank. We differentiated swimming and thrashing as described in the Methods section because the latter is a more directed type swimming compared to the former allowing one to conclude about the direction of movement and perhaps hypothesize about the underlying motivation of zebrafish. Stimulus image choice had no significant effect on any of these behaviors (ANOVA: swimming F(6, 73) = 0.849, p > 0.05; thrashing F(6, 73) = 1.026, p > 0.05; freezing F(6, 73) = 0.612, p > 0.05). The latter results suggest that experimental fish moved actively during all stimulus choice tasks.
Figure 13.
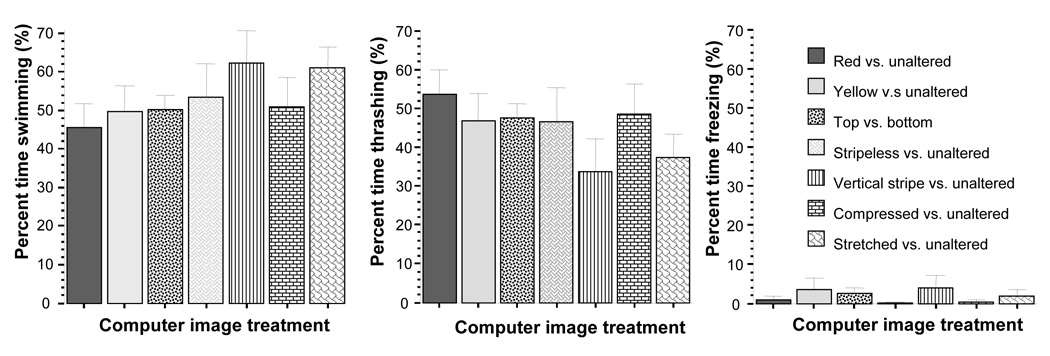
Stimulus treatment had no significant effect on motor patterns Swimming, Thrashing, and Freezing. Mean ± S.E.M. are shown (n=10). Note that fish froze very little and spent most of their time actively swimming or thrashing (attempting to swim through the glass wall of their tank). Significant deviation from random chance is indicated by asterisks (*p < 0.05, **p<0.01, ***p<0.001)
To further investigate the behavioral responses elicited by the stimulus presentations we analyzed correlation coefficients. First, we noted that in one condition, (the top vs. bottom location of zebrafish images) the behavioral responses of the experimental fish appeared to be dependent upon the time of day. To confirm this observation we analyzed the correlation between where the zebrafish were and the time of the test session. The correlation was positive (r = 0.64, p < 0.01) between the percent of time near the top shoal and the time of day, i.e., as time went by experimental zebrafish exhibited an increasing preference for the shoal that was swimming near the top. The correlation was negative (r = − 0.60, p < 0.01) between the percent of time near the bottom shoal and the time of day, confirming that as time progressed experimental zebrafish preferred spending less time with the shoal presented on the bottom, a pattern suggesting a circadian change in behavior.
Next we analyzed the correlation coefficients between behavioral elements (swimming and thrashing) and the percent of time in the middle of the experimental tank (Table 1 panel A). The rationale for this was that Thrashing is expected to represent a directional, “goal oriented” aspect of Swimming. Indeed, we noticed thrashing to occur mainly on the sides and swimming in the middle. The correlation coefficients confirmed this impression. Swimming correlated positively and thrashing correlated negatively with center dwell time in all stimulus conditions (Table 1, panel A). This result is noteworthy as it generally confirms that experimental zebrafish attempted to swim through the glass of the tank (the definition of thrashing) on the sides but not in the middle section of the experimental tank. Thus it is likely this behavior reflects an attempt to move closer to certain stimulus images or perhaps away from others. The latter question, i.e. whether Thrashing represented moving closer to one stimulus or moving away from the other, is studied by the analyses of the correlation coefficients calculated between percent of time Thrashing and percent of time on the unaltered stimulus side or on the altered image side (Table 1 Panel B). We found a significant and positive correlation between thrashing and the altered side when this side showed the yellow colored zebrafish images, suggesting that indeed experimental zebrafish preferred these images to the unaltered ones and attempted to join the computer animated zebrafish shoal with yellow fish. Another notable finding concerns the test in which zebrafish were presented with the stretched and the unaltered images. In this task the correlation between the time spent near the unaltered image and time spent thrashing is significant and positive, whereas the correlation between the time spent near the stretched image and thrashing is significantly negative; confirming that experimental zebrafish were attempting to swim away from the altered image and tried to join the shoal of the unaltered animated zebrafish.
Table 1.
Pearson Product Moment Correlation Coefficients calculated for (A) motor patterns Swimming, Thrashing and location parameter Center Dwell Time, or (B) motor pattern Thrashing and location parameters Altered Side and Unaltered Side Dwell Time. Results are shown separately for the stimulus conditions. Asterisks indicate significance levels. Note that Thrashing negatively correlated with Center Dwell Time and Swimming positively correlated with Center Dwell Time across all stimulus conditions. Also note that Thrashing positively correlated with Dwell Time near the yellow images and negatively with Dwell Time near the stretched images.
| Pearson Product Moment Correlation Coefficients | ||||||
|---|---|---|---|---|---|---|
| A | Center Dwell Time | B | Dwell time: Unaltered side Altered side | |||
| Red vs. unaltered | Swimming Duration | 0.97** | Thrashing Duration | 0.40 | −0.20 | |
| Thrashing Duration | −0.94** | |||||
| Yellow vs. unaltered | Swimming Duration | 0.89** | Thrashing Duration | −0.71* | 0.80** | |
| Thrashing Duration | −0.71* | |||||
| Top vs. bottom | Swimming Duration | 0.87** | Thrashing Duration | 0.42 | −0.21 | |
| Thrashing Duration | −0.86** | |||||
| Stripeless vs. unaltered | Swimming Duration | 0.85** | Thrashing Duration | 0.48 | −0.10 | |
| Thrashing Duration | −0.85** | |||||
| Vertical stripe vs. unaltered | Swimming Duration | 0.88** | Thrashing Duration | 0.58 | −0.21 | |
| Thrashing Duration | −0.78** | |||||
| Compressed vs. unaltered | Swimming Duration | 0.81** | Thrashing Duration | 0.54 | −0.37 | |
| Thrashing Duration | −0.82** | |||||
| Stretched vs. unaltered | Swimming Duration | 0.68* | Thrashing Duration | 0.65* | −0.50 | |
| Thrashing Duration | −0.65* | |||||
p < 0.05
p<0.01
p<0.001
DISCUSSION
The results presented in this paper confirm that zebrafish are not indifferent to the fish around them. They prefer individuals that exhibit characteristics similar to their own, i.e. they show preference towards their own conspecifics. This feature is not unique to zebrafish as other shoaling fish species have also been found to exhibit preference towards conspecifics [44, 24; for adaptive significance of this behavior also see 2]. The preference manifests as mixing with the stimulus fish and swimming closer to them than to heterospecific fish. The shoaling response to the conspecific stimulus fish (the gold or the wild type zebrafish stimulus fish) is unlikely to be due to individual familiarity, as experimental zebrafish were equally unfamiliar with all stimulus fish, conspecific and heterospecific alike. Importantly, in this study the preference, i.e. the shoaling response, has now been demonstrated with experimental fish freely swimming with the stimulus fish. In addition, this study has also begun the analysis of what stimuli may be important for zebrafish in their decision whether to swim close to, i.e. to shoal with other fish. Although pilot in nature, the results of this second experiment also suggest that certain features of the stimulus fish are preferred while other features are avoided by zebrafish.
Experimental zebrafish swimming freely with stimulus fish exhibited the largest average distance among them when they encountered conspecifics exhibiting either the same coloration as their own or a slightly different one, the gold phenotype. The increased values arose as a result of experimental zebrafish distributing themselves among the stimulus fish and thus swimming further apart from other experimental zebrafish. When presented with a group of platy or white cloud, experimental zebrafish did not mix with the stimulus fish, i.e. stayed close to each other but not to the stimulus fish, and as a result the average distance among experimental zebrafish became small. In fact the distance values under these latter two stimulus conditions were either not significantly different (white cloud vs. alone, Fig. 1) or only slightly larger (platy vs. alone, Fig. 1) than the value obtained when the experimental zebrafish were not given any stimulus fish (alone). Therefore, it appears that zebrafish largely ignored the presence of heterospecific fish and swam in a manner as if these fish were not there. This finding is supported by the analysis of the distance between experimental zebrafish and stimulus fish. It showed that the distance was smallest when the stimulus fish were conspecific and largest when the stimulus fish were the non-shoaling heterospecific species, the platy. Briefly, zebrafish liked to shoal with zebrafish. The absence of time × stimulus treatment interaction is also noteworthy. It suggests that zebrafish, at least within the period of the test session, did not get habituated or sensitized to the heterospecific species, i.e. shoaling preference was maintained across the experimental session.
The adaptive function of shoaling and why it is performed mainly with conspecifics in zebrafish is speculative at this point as the current study has not experimentally studied these questions. Nevertheless, others have shown that shoaling allows for earlier predator detection through increased vigilance [17], facilitates coordinated anti-predator behavior [33], and divides the attention of the predator [30]. It is also known that greater similarity among group members reduces predation by minimizing phenotypic oddity [25, 27, 44]. Thus it is possible that the preference for shoaling with its own kind allows zebrafish to minimize predation. Alternatively, or in addition, forming a shoal with conspecifics can increase reproductive success [18] and may also facilitate foraging [29]. Irrespective of the evolutionary reasons, zebrafish appear to shoal best with its own kind.
There may be two fundamentally different reasons why this result was obtained in our study: one, zebrafish prefers its own kind; two, heterospecific fish avoid zebrafish. These two possibilities could not be clearly distinguished in the first set of experiments given that there the interaction between live stimulus and experimental fish was allowed and the behavior of both groups could influence the outcome of the test. In the second set of experiments, however, zebrafish encountered computer animated images and thus only the preferences of experimental zebrafish could influence the outcome of the test. What is the perceptual basis of zebarfish’s shoaling decisions, i.e. what are the criteria the preferred shoal-mate must meet? These questions require more thorough analyses in the future, e.g. systematic modification of the cues, including visual and auditory stimuli, as well as the behavioral characteristics (movements) of the preferred animated shoal companion. Our current pilot studies have already revealed some specific features zebrafish may ignore and some to which they may be sensitive.
The stripe orientation, and in fact the presence or absence of stripes, did not seem to matter to our experimental zebrafish. They spent the same amount of time near the altered and the unaltered images. This finding may seem surprising given that visual stimuli, including pattern and coloration, are thought to be important in diurnal fish species aiding correct conspecific identification (right or wrong species for reproduction) as well as in gathering information about the status of conspecifics (dominance, reproductive and health status) [22]. Also notable that in a previous study, stripe orientation was found to have an effect on preference in zebrafish [35]. However, in the latter study the experimental zebrafish had no access to visual cues at all times as the stimulus fish were often shown in the frontal view and not from the side. This semi-three-dimensional (3D images on a flat computer screen) image presentation and the fact that the presentation used recurring movement sequences instead of a properly randomized swim pattern makes the comparison of results of this study with our own difficult. Nevertheless, it is noteworthy that zebrafish may have co-evolved in its natural habitat with phenotypic variants whose color and pattern may slightly vary. A zebrafish variant, previously thought to be a subspecies of zebrafish, has been known in the pet trade as the leopard danio. It exhibits no stripes on its body but a more homogeneous color pattern, small dots, hence the name “leopard”. This fish readily breeds with zebrafish producing fertile offspring suggesting lack of post-zygotic (biological/physiological) as well as pre-zygotic (behavioral) reproductive isolation. Although its separate species status is debated, the leopard danio was first described as a species sympatric with zebrafish [20]. It is thus possible that zebrafish in its natural habitat do not distinguish its own species from others solely on the basis of stripe pattern and does not use this trait to identify conspecifics with which it will shoal and mate. Furthermore, zebrafish were found to co-occur naturally with several other danio and closely related devario species according to a recent field study [8]. Some of these species exhibit no stripes, e.g. Devario aequipinnatus, and others show vertical stripes, e.g. Devario shanensis. Given that all these species are shoaling fish, their body length is approximately 4 cm, their body proportions are also similar to those of zebrafish, and that their general coloration overall is greenish-yellow with some iridescence just like in zebrafish, it is possible that the phenotypic oddity effect did not represent a major predatory selection pressure, which would explain both why such species are found to form mixed shoals in nature [8] and why in our current study the experimental zebrafish did not prefer their own natural stripe pattern to others.
Color has been found to be an important factor affecting choice behavior in fish [27]. Our results are in accordance with this. Color alterations of the original zebrafish image did make a difference in the way our experimental zebrafish responded to the images. For example, although red colored images were not avoided, the unaltered images were significantly preferred. Red colored variants of zebrafish do not exist in nature and red colored species do not co-inhabit locations where zebrafish is naturally found [8]. Thus the red-colored image may have been treated by our experimental zebrafish as heterospecific fish not appropriate for shoaling or at least one to which zebrafish are not evolutionarily prepared to respond with preference.
Interestingly, yellow colored images elicited a strong preference from zebrafish. The experimental zebrafish spent significantly higher than chance time near these altered images at the expense of staying with the unaltered images. The explanation for this preference is speculative at this point. Zebrafish possess yellow xantophores [31]. Similarly to other fish species [for review see 11], zebrafish are capable of rapid color change, and for example, show their most vivid coloration during courtship and spawning. Interestingly, zebrafish exposed to alcohol (EtOH) also show the vivid colors [14]. Conversely, fish that are in fear inducing situations or those that are not healthy show pale coloration [e.g. 14, 6, and Gerlai personal observation]. Vividly colored zebrafish exhibit more yellow coloration and thus it is possible that our yellow colored computer image exhibited a trait that was interpreted by the experimental zebrafish as signaling health or reproductive maturity and therefore elicited preference.
Perhaps the most dramatic change observed in response to an altered image was when the body shape of the image was altered. While the compressed (more “fat” looking) image did not elicit any differential response from zebrafish as compared to the unaltered image, the stretched image (fish appearing longer and narrower) induced a robust avoidance reaction. It is notable that this is the only stimulus condition under which experimental zebrafish spent so little time near the altered image that the value was significantly (p < 0.001) below chance. In fact the time the zebrafish spent near the altered image was even smaller than the time they spent in the center (repeated measure ANOVA F(1, 9) = 5.37, p < 0.05), an area of the tank that was not preferred by zebrafish throughout the different stimulus conditions. Why did zebrafish avoid the stretched image? Our experiments did not address this question but a recent publication in which the fish fauna of the natural habitat of zebrafish was surveyed [8] identifies a predatory species that has an elongated body shape similar to our stretched zebrafish image. Xenentodon cancila, the needle fish, is a piscivore that preys upon small cyprinids and has been found in the same habitat where zebrafish occurs [8]. Based on its body and mouth structure it appears to be adapted to occupy the upper water column, the same microhabitat where zebrafish are usually found foraging during the day. It is thus possible that zebrafish is genetically predisposed to responding with avoidance to the elongated body shape typical of a sympatric zebrafish predator, a working hypothesis to be tested in the future. Genetic predisposition, i.e. avoidance reaction without prior exposure to the stimulus, has been demonstrated in zebrafish towards another sympatric predator, Nandus nandus, the Indian leaf fish [5].
Turnell et al. [41] also studied choice behavior in zebrafish although in a mate choice context. It is noteworthy that these authors found complex responses that showed an interaction with body shape, stripe pattern, and gender. Findings of a mate choice study may not be directly applicable to our current analysis of shoaling behavior as the mechanisms as well as the adaptive aspects of the choice in courtship and reproduction vs. in shoaling may be different. Nevertheless, it appears that further analysis in which combinations of features including body shape, stripe pattern, gender, shoaling (multiple fish images) vs. mate choice context (image of a single fish of the opposite or the same gender) as well as the movements of the image may have to be considered and systematically manipulated to reveal the full complexity of shoaling decisions in zebrafish.
The location of images, i.e. whether they were close to the surface or to the bottom, did not make a difference for the experimental zebrafish. They spent nearly identical amount of time near these two types of images. This finding was unexpected as zebrafish are believed to prefer swimming close to the surface where they can catch small insects falling into the water. It is possible that the experimental tank was not deep enough and thus the difference between surface and bottom was negligible to zebrafish. Nevertheless, we noted a significant positive correlation between time of recording and time spent near the animated fish images positioned close to the surface. Zebrafish showed increasing preference toward the “top shoal” vs. the “bottom shoal” as time went by. The factors driving this circadian change are not known but numerous possibilities will be considered and investigated in the future. These include changes in hunger level (fish may be less hungry close to the morning feeding time and hungrier fish may try to forage more near the water surface than near the bottom), changes in temperature gradients in the experimental tank (the upper layers of the experimental tank may become warmer with time due to lack of mixing of water and the heat emitted by fluorescent light tube and fish may prefer the warmer layers), or naturally occurring circadian activity patterns independent of the environmental factors unique to the experimental set up.
Analysis of correlations revealed other notable findings. For example, the correlation coefficients of motor patterns Swimming and Thrashing with Center dwell time were significant across all stimulus conditions and showed a consistent pattern: Swimming was positively and Thrashing was negatively correlated with Center dwell time. This finding supports our own observation: swimming mostly occurred in the center and thrashing was performed mainly on the sides of the tank. Thrashing on the two opposite sides of the experimental tank could be due to zebrafish trying to get closer to the preferred images (thrashing is when the fish are swimming against the glass apparently trying to swim through the glass) or to get away from non-preferred ones. Although at the time of recording we strictly focused on the physical form of behavior and not what it may mean or where it was performed, analysis of correlations provided some answers to the above questions.
The pattern of correlations was consistent. Under stimulus treatment conditions when experimental zebrafish were found to prefer a particular image, the correlation between Thrashing and the amount of time spent on the side of the tank close to the image was found to be positive. Conversely, the correlation was negative between Thrashing and the amount of time spent near the non-preferred image. For example, a significant positive correlation was found between Thrashing and time spent near the yellow images suggesting that the attempt to swim through the glass occurred mainly on the side where the yellow (altered) zebrafish images were shown and not on the other side where the unaltered images were presented. Briefly, it appears that experimental zebrafish were indeed attempting to join the group of, i.e. shoal with, the yellow colored animated zebrafish images. However, when the altered images were the stretched ones, the correlations reversed: a significant positive correlation was found between Thrashing and dwell time on the unaltered image side, while the correlation between Thrashing and dwell time on the altered image side was negative. Briefly, it appears that Thrashing on the unaltered side was associated with moving away from the stretched images, an escape reaction we suggested may be an antipredatory response.
The last point we would like to consider are the practical and technical aspects of our work. Our study suggests that controlled delivery of the stimuli as well as the precise quantification of the behavioral responses elicited by them can be conducted using a computer. The precision with which the speed of movement, the shape, size, color and pattern of the images one may present to zebrafish will not only allow a systematic and detailed analysis of how zebrafish responds to certain cues in the context of social or other (e.g. predatory) encounters, but is also a prerequisite for high throughput behavioral screening. Similarly, computer aided quantification of behavior, e.g. measuring the location and swim path characteristics of zebrafish using video-tracking (e.g. see [ref 6]) will allow automated quantification of behavioral responses. Given that the experimenter is not required to control the image presentations or to be present throughout the experimental session to quantify behavior one can run multiple apparati at a time and thus decrease the amount of time required to test a set number of zebrafish. Briefly, our current and previous results [6] suggest that fast efficient behavioral testing paradigms are feasible in the analysis of social behavior of zebrafish and thus high throughput applications required for mutagenesis or drug screening will be possible in the future.
ACKNOWLEDGEMENTS
We would like to thank R. Khrishnan Nair for his technical help, and N. Miller for software development. Supported by NSERC (#311637 - 06) and NIH/NIAAA (#1R01AA015325-01A2) grants to RG.
Footnotes
Publisher's Disclaimer: This is a PDF file of an unedited manuscript that has been accepted for publication. As a service to our customers we are providing this early version of the manuscript. The manuscript will undergo copyediting, typesetting, and review of the resulting proof before it is published in its final citable form. Please note that during the production process errors may be discovered which could affect the content, and all legal disclaimers that apply to the journal pertain.
REFERENCES
- 1.Aickin M, Gensler H. Adjusting for multiple testing when reporting research results: The Bonferroni vs. Holm methods. American Journal of Public Health. 1996;86:726–728. doi: 10.2105/ajph.86.5.726. [DOI] [PMC free article] [PubMed] [Google Scholar]
- 2.Allan JR, Pitcher TJ. Species segregation during predator evasion in cyprinid fish shoals. Freshwater Biology. 1986;16:653–659. [Google Scholar]
- 3.Amsterdam A, Hopkins N. Mutagenesis strategies in zebrafish for identifying genes involved in development and disease. Trends Genet. 2006;22:473–478. doi: 10.1016/j.tig.2006.06.011. [DOI] [PubMed] [Google Scholar]
- 4.Barut BA, Zon LI. Realizing the potential of zebrafish as a model for human disease. Physiol Genomics. 2000;2:49–51. doi: 10.1152/physiolgenomics.2000.2.2.49. [DOI] [PubMed] [Google Scholar]
- 5.Bass SLS, Gerlai R. Zebrafish (Danio rerio) responds differentially to stimulus fish: The effects of sympatric and allopatric predators and harmless fish. Behav Brain Res. 2007;186:107–117. doi: 10.1016/j.bbr.2007.07.037. [DOI] [PubMed] [Google Scholar]
- 6.Blaser R, Gerlai R. Behavioral phenotyping in zebrafish: comparison of three behavioral quantification methods. Behav Res Methods. 2006;38:456–469. doi: 10.3758/bf03192800. [DOI] [PubMed] [Google Scholar]
- 7.Darland T, Dowling JE. Behavioral screening for cocaine sensitivity in mutagenized zebrafish. Proc Natl Acad Sci USA. 2001;98:11691–11696. doi: 10.1073/pnas.191380698. [DOI] [PMC free article] [PubMed] [Google Scholar]
- 8.Engeszer RE, Patterson LB, Rao AA, Parichy DM. Zebrafish in the Wild: A review of natural history and new notes from the field. Zebrafish. 2007;4:21–40. doi: 10.1089/zeb.2006.9997. [DOI] [PubMed] [Google Scholar]
- 9.Engeszer RE, Ryan MJ, Parichy DM. Learned social preference in zebrafish. Curr Biol. 2004;14:881–884. doi: 10.1016/j.cub.2004.04.042. [DOI] [PubMed] [Google Scholar]
- 10.Feinstein C, Singh S. Social phenotypes in neurogenetic syndromes. Child Adolesc Psychiatr Clin N Am. 2007;16:631–647. doi: 10.1016/j.chc.2007.03.006. [DOI] [PubMed] [Google Scholar]
- 11.Fujii R. The regulation of motile activity in fish chromatophores. Pigment Cell Res. 2000;13:300–319. doi: 10.1034/j.1600-0749.2000.130502.x. [DOI] [PubMed] [Google Scholar]
- 12.Gerlai J, Gerlai R. Autism: A large unmet medical need and a complex research problem. Physiol Behav. 2003;79:461–470. doi: 10.1016/s0031-9384(03)00165-3. [DOI] [PubMed] [Google Scholar]
- 13.Gerlai R, Clayton NS. Analysing hippocampal function in transgenic mice: An ethological perspective. Trends Neurosci. 1999;22:47–51. doi: 10.1016/s0166-2236(98)01346-0. [DOI] [PubMed] [Google Scholar]
- 14.Gerlai R, Lahav S, Guo, Rosenthal A. Drinks like a fish: zebra fish (Danio rerio) as a behavior genetic model to study alcohol effects. Pharmacol Biochem Behav. 2000;67:773–782. doi: 10.1016/s0091-3057(00)00422-6. [DOI] [PubMed] [Google Scholar]
- 15.Gerlai R. Phenomics: Fiction or the future? Trends Neurosci. 2002;25:506–509. doi: 10.1016/s0166-2236(02)02250-6. [DOI] [PubMed] [Google Scholar]
- 16.Gerlai R. Zebra fish: An uncharted behavior genetic model. Behav Genet. 2003;33:461–468. doi: 10.1023/a:1025762314250. [DOI] [PubMed] [Google Scholar]
- 17.Griffiths SW, Brockmark S, Hojesjo J, Johnsson JI. Coping with divided attention: The advantage of familiarity. Biological Sciences. 2004;271(1540):695–699. doi: 10.1098/rspb.2003.2648. [DOI] [PMC free article] [PubMed] [Google Scholar]
- 18.Griffiths SW, Magurran AE. Sex and schooling behaviour in the Trinidadian guppy. Anim Behav. 1998;56:689–693. doi: 10.1006/anbe.1998.0767. [DOI] [PubMed] [Google Scholar]
- 19.Grunwald DJ, Eisen JS. Timeline: Headwaters of the zebrafish—emergence of a new model vertebrate. Nat Rev Genet. 2002;3:717–724. doi: 10.1038/nrg892. [DOI] [PubMed] [Google Scholar]
- 20.Hamilton F. An account of the fishes found in the river Ganges and its branches i–vii. Vol. 1822. Edinburgh & London: Fishes Ganges; pp. 1–405. [Google Scholar]
- 21.Klauck SM. Genetics of autism spectrum disorder. Eur J Hum Genet. 2006;14:714–720. doi: 10.1038/sj.ejhg.5201610. [DOI] [PubMed] [Google Scholar]
- 22.Knight ME, Turner GF. Reproductive isolation among closely related Lake Malawi cichlids: Can males recognize conspecific females by visual cues? Anim Behav. 1999;58:761–768. doi: 10.1006/anbe.1999.1206. [DOI] [PubMed] [Google Scholar]
- 23.Krause J, Butlin RK, Peuhkuri N, Pritchard VL. The social organization of fish shoals: A test of the predictive power of laboratory experiments for the field. Biol Rev Camb Philos Soc. 2000;75:477–501. doi: 10.1111/j.1469-185x.2000.tb00052.x. [DOI] [PubMed] [Google Scholar]
- 24.Krause J, Godin J-GJ, Brown D. Size-assortiveness in multi-species fish shoals. Journal of Fish Biology. 1996;49:221–225. [Google Scholar]
- 25.Landeau L, Terborgh J. Oddity and the 'confusion effect' in predation. Anim. Behav. 1986;34:1372–1380. [Google Scholar]
- 26.Lieschke GJ, Currie PD. Animal models of human disease: zebrafish swim into view. Nat Rev Genet. 2007;8:353–367. doi: 10.1038/nrg2091. [DOI] [PubMed] [Google Scholar]
- 27.McRobert SP, Bradner J. The influence of body coloration on shoaling preferences in fish. Animal Behaviour. 1998;56:611–615. doi: 10.1006/anbe.1998.0846. [DOI] [PubMed] [Google Scholar]
- 28.Miller N, Gerlai R. Quantification of shoaling behaviour in zebrafish (Danio rerio) Behav Brain Res. 2007;184:157–166. doi: 10.1016/j.bbr.2007.07.007. [DOI] [PubMed] [Google Scholar]
- 29.Milne SW, Shuter BJ, Sprules WG. The schooling and foraging ecology of lake herring (coregonus artedi) in lake Opeongo, Ontario, Canada. Canadian Journal of Fisheries and Aquatic Sciences. 2005;62(6):1210–1218. [Google Scholar]
- 30.Morgan MJ, Colgan PW. The effects of predator presence and shoal size on foraging in bluntnose minnows, pimephales notatus. Environmental Biology of Fishes. 1987;20(2):105–111. [Google Scholar]
- 31.Parichy DM. Evolution of Danio pigment pattern development. Heredity. 2006;97:200–210. doi: 10.1038/sj.hdy.6800867. [DOI] [PubMed] [Google Scholar]
- 32.Pitcher TJ. Heuristic definitions of fish shoaling behavior. Anim Behav. 1983;31:611–612. [Google Scholar]
- 33.Pollock MS, Pollock RJ, Chivers DP. Social context influences the antipredator behaviour of fathead minnows to chemical alarm cues. Ethology. 2006;112(8):801–806. [Google Scholar]
- 34.Roder JK, Roder JC, Gerlai R. Conspecific exploration in the T-maze: Abnormalities in S100β transgenic mice. Physiol. & Behav. 1996;60:31–36. doi: 10.1016/0031-9384(95)02247-3. [DOI] [PubMed] [Google Scholar]
- 35.Rosenthal GG, Ryan MJ. Assortative preferences for stripes in danios. Animal Behaviour. 2005;70:1063–1066. [Google Scholar]
- 36.Ruhl N, McRobert SP. The effect of sex and shoal size on shoaling behaviour in Danio rerio. Journal of Fish Biology. 2005;67:1318–1326. [Google Scholar]
- 37.Shaw E. The development of schooling behaviour in fishes. Physiol Zool. 1960;3:79–86. [Google Scholar]
- 38.Sison M, Cawker J, Buske C, Gerlai R. Fishing for genes influencing vertebrate behavior: zebrafish making headway. Lab Anim. 2006;35:33–39. doi: 10.1038/laban0506-33. [DOI] [PubMed] [Google Scholar]
- 39.Stein MB, Chavira DA, Jang KL. Bringing up bashful baby. Developmental pathways to social phobia. Psychiatr Clin North Am. 2001;24:661–675. doi: 10.1016/s0193-953x(05)70256-2. [DOI] [PubMed] [Google Scholar]
- 40.Tropepe V, Sive HL. Can zebrafish be used as a model to study the neurodevelopmental causes of autism? Genes Brain Behav. 2003;2:268–281. doi: 10.1034/j.1601-183x.2003.00038.x. [DOI] [PubMed] [Google Scholar]
- 41.Turnell ER, Mann KD, Rosenthal GG, Gerlach G. Mate choice in zebrafish (Danio rerio) analyzed with video-stimulus techniques. Biol Bull. 2003;205:225–226. doi: 10.2307/1543265. [DOI] [PubMed] [Google Scholar]
- 42.Ward AJ, Axford S, Krause J. Cross-species familiarity in shoaling fishes. Proc Biol Sci. 2003;270:1157–1161. doi: 10.1098/rspb.2003.2337. [DOI] [PMC free article] [PubMed] [Google Scholar]
- 43.Westerfield M. The zebrafish book. A guide for the laboratory use of zebrafish (Danio rerio) 4th ed. Eugene: Univ. of Oregon Press; 2000. [Google Scholar]
- 44.Wolf N. Odd fish abandon mixed-species groups when threatened. Behavioral Ecology and Sociobiology. 1985;17:47–52. [Google Scholar]
- 45.Wright D, Ward AJW, Croft DP, Krause J. Social organization, grouping, and domestication in fish. Zebrafish. 2006;3:141–155. doi: 10.1089/zeb.2006.3.141. [DOI] [PubMed] [Google Scholar]


