Abstract
Most work on wheat breeding for salt tolerance has focused mainly on excluding Na+ from uptake and transport to the shoot. However, some recent findings have reported no apparent correlation between leaf Na+ content and wheat salt tolerance. Thus, it appears that excluding Na+ by itself is not always sufficient to increase plant salt tolerance and other physiological traits should also be considered. In this work, it was investigated whether a root's ability to retain K+ may be such a trait, and whether our previous findings for barley can be extrapolated to species following a ‘salt exclusion’ strategy. NaCl-induced kinetics of K+ flux from roots of two bread and two durum wheat genotypes, contrasting in their salt tolerance, were measured under laboratory conditions using non-invasive ion flux measuring (the MIFE) technique. These measurements were compared with whole-plant physiological characteristics and yield responses from plants grown under greenhouse conditions. The results show that K+ flux from the root surface of 6-d-old wheat seedlings in response to salt treatment was highly correlated with major plant physiological characteristics and yield of greenhouse-grown plants. This emphasizes the critical role of K+ homeostasis in plant salt tolerance and suggests that using NaCl-induced K+ flux measurements as a physiological ‘marker’ for salt tolerance may benefit wheat-breeding programmes.
Keywords: Microelectrode ion flux, potassium, salinity, screening, sodium, wheat
Introduction
Wheat is a classical ‘salt excluder’, characterized by low rates of Na+ transport to the shoot, thus keeping mesophyll cells as Na+-free as possible (Munns and James, 2003; Colmer et al., 2005; James et al., 2006). Indeed, bread wheat (Triticum aestivum) is generally more salt-tolerant than durum wheat (Triticum turgidum ssp. durum) and this is thought to be due to a lower rate of Na+ accumulation in the former (Joshi et al., 1982; Francois et al., 1986; Gorham et al., 1987; Rawson et al., 1988; Maas and Greive, 1990; Colmer et al., 2006). Accordingly, most work on improving salt tolerance in wheat has focused on increasing Na+ exclusion (Ashraf and Khanum, 1997; Tester and Davenport, 2003; Garthwaite et al., 2005), although no commercial varieties based on this approach have been released (Flowers, 2004; Munns et al., 2006).
However, the relationship between salt exclusion and salt tolerance appears not always to be straightforward (Ashraf and McNeilly, 1988; Hollington, 2000; Munns and James, 2003; El-Hendawy et al., 2005). A recent analysis of 51 wheat genotypes for example, reported no apparent correlation between leaf Na+ content and salt tolerance (Genc et al., 2007). Thus, excluding Na+ alone is not always sufficient to increase plant salt tolerance so other physiological traits should also be considered.
Maintenance of a high cytosolic K+:Na+ ratio is a key feature of plant salt tolerance (Maathuis and Amtmann, 1999). Under optimal conditions, the cytosolic K+ content is estimated to be about 150 mM (Leigh and Wyn Jones, 1984; Walker et al., 1995; Cuin et al., 2003) with a negligible Na+ content (Carden et al., 2003). However, due to excessive Na+ accumulation in the cytosol (Zhu, 2000; Leigh, 2001) and enhanced K+ leakage (Shabala, 2000; Shabala et al., 2003), the cytosolic K+:Na+ ratio falls dramatically under saline conditions (Maathuis and Amtmann, 1999). This salinity-induced K+ loss from cells (Shabala et al., 2003, 2006; Chen et al., 2005; Cuin and Shabala, 2005) is a result of NaCl-induced membrane depolarization (Cakirlar and Bowling, 1981; Shabala et al., 2003), leading to the activation of depolarization-activated outward-rectifying K+ channels (Shabala et al., 2006). Recent studies on barley have suggested that the magnitude of this NaCl-induced efflux from the roots of young seedlings shows a strong negative correlation with salt tolerance (measured as grain yield under greenhouse conditions) (Chen et al., 2005, 2007c). These results suggest that, although salinity is a complex multigenic trait (Flowers, 2004), over 70% of the genetic variability in barley is attributed to just one physiological trait: a root's ability to retain K+, and, importantly, this trait shows high heritability (Chen et al., 2005, 2008). Thus, measurements of cellular K+ loss upon the application of NaCl could be used as a screening tool for plant salt tolerance. Whether this is true for other crops needs to be validated.
In wheat, the importance of K+ homeostasis in salt tolerance is well known (Gorham et al., 1987, 1990; Dvořák and Gorham, 1992; Dvořák et al., 1994). For example, Omielan et al. (1991) found that salt tolerance correlated positively with K+ as well as negatively with flag leaf Na+, suggesting that this relationship was strong enough to be exploited as a selection tool in wheat breeding. Further support comes from a salt-tolerant durum wheat mutant with a high ability to accumulate K+ in the shoot (Rascio et al., 2001). However, these findings have never been taken on board by plant breeders, and the potential role of K+ homeostasis in salt tolerance in wheat is under-explored and under-exploited.
In this work, the above issue has been addressed by applying the non-invasive ion flux measuring (the MIFE) technique to measure NaCl-induced kinetics of K+ flux from two bread and two durum wheat genotypes, contrasting in their salt tolerance. The results of laboratory measurements were compared with whole-plant physiological characteristics and yield responses from plants grown under greenhouse conditions. The results show that K+ flux from the root surface of 6-d-old wheat seedlings in response to salt treatment was highly correlated with major plant physiological characteristics and yield of greenhouse-grown plants. This emphasizes the critical role of K+ homeostasis in plant salt tolerance and suggests that using NaCl-induced K+ flux measurements as a physiological ‘marker’ for salt tolerance may benefit wheat-breeding programmes.
Materials and methods
Plant material
Two bread wheat (Baart 46; salt-sensitive; Rawson et al., 1988) and Kharchia 65 (tolerant; Hollington, 2000), and two durum lines; Tamaroi and Wollaroi (higher and lower Na+ accumulators, respectively; Munns et al., 2000) were used. Seeds were obtained from the Tamworth Agricultural Institute, NSW Department of Primary Industries, Australia and Dr Rana Munns, CSIRO Plant Industry, Canberra, ACT, AUS.
Greenhouse experiments
Whole plant responses to salinity were studied in greenhouse experiments using a semi-hydroponic culture technique. Seeds were surface-sterilized with 3% sodium hypochlorite for 5 min, followed by a thorough rinsing with deionized water. They were sown in PVC pots containing 70% perlite and 30% sand, ten seeds per pot and six replicate pots for each cultivar and treatment. Plants were watered twice daily with half-strength Hoagland's solution with an automatic irrigation system through drippers, about 60 ml of solution being applied each time for each pot. A saucer was placed under each pot to prevent solution loss.
After 10 d, seedlings were thinned to leave eight uniform and healthy seedlings in each pot and salinity treatment commenced. Salt stress (NaCl) commenced 2 weeks after sowing and was imposed incrementally, increasing by 30 mM a day to reach a final concentration of 150 mM.
Chlorophyll fluorescence and chlorophyll content:
Chlorophyll characteristics of the flag leaves were measured on 6-week-old plants, (after 4 weeks of NaCl treatment), just as the plant was reaching anthesis. One plant from each of the six replicate pots was selected. Chlorophyll fluorescence characteristics (F0, Fm, and Fv/Fm) were recorded using an OS-30p chlorophyll fluorometer and chlorophyll content (measured as chlorophyll content index, or CCI) was quantified by a CCM-200 chlorophyll content meter (both from Opti-Sciences, Inc, Hudson, NH 03051, USA).
Tissue sodium and potassium content and osmolality:
One flag leaf was harvested from each of the six replicate pots at the pre-anthesis stage, and frozen immediately in liquid nitrogen. For measurements, thawed leaf samples were placed into 1.5 ml microcentrifuge tubes in which there was a basal opening, allowing cell sap, but not tissue fragments, to pass through to a collection tube. Each sample was spun for 3 min at 11 600 g in a microcentrifuge. The sample collected was measured for its K+ and Na+ concentration (in mM) using flame photometry, and its osmolality determined using a vapour pressure osmometer (Vapro; Wescor Inc, Logan, UT, USA). Analysis of K+ using such a method does not differ significantly from that measured using acid extraction (Walker et al., 1995).
Biomass and yield:
The shoot tissue from one plant was harvested from each of the six replicate pots at the pre-anthesis stage. The fresh weight was recorded immediately with a Mettler BB2440 Delta range balance (Mettler-Toledo, Greifensee, Switzerland). Plant material was dried at 65 °C in a Unitherm Dryer (Birmingham, UK) to a constant weight, then weighed again. Shoot water content (%) was calculated as the relative difference between fresh and dry weight.
The final harvest for yield was carried out at maturity, c. 12 weeks after sowing (after 10 weeks 150 mM NaCl). Grain yield was recorded as the average number of ears per replicate and ear dry weight.
Electrophysiology
Sterilized seeds were grown in an aerated hydroponic solution (0.5 mM KCl and 0.1 mM CaCl2) in a dark growth cabinet at 23 °C. Six-day-old seedlings were used for ion flux and membrane potential measurements. All measurements were made 10 mm from the root tip.
Ion flux measurements:
Net K+ and H+ fluxes were measured non-invasively using ion-selective microelectrodes (the MIFE technique, UTas Innovation, Hobart, Australia), as described previously (Shabala et al., 1997, 2003). Briefly, microelectrodes were pulled and salinized with tributylchlorosilane and tips backfilled with commercially available ion-selective cocktails (K+, 60 031; H+, 95 297; both from Fluka, Busch, Switzerland). Electrodes were mounted on a 3D-micromanipulator (MMT-5, Narishige, Toyko, Japan), tips positioned close together, 40 μM above the root surface. During measurement, a computer-controlled stepper motor moved the electrode between two positions (40 μM and 80 μM, respectively) from the root surface in a 10 s square-wave manner. The CHART software (see Shabala et al., 1997, and Newman, 2001, for details), recorded the potential difference between two positions and converted them into electrochemical potential differences using the calibrated Nernst slope of the electrode. Net ion fluxes were calculated using the MIFEFLUX software for cylindrical diffusion geometry (Newman, 2001).
Ion flux measuring protocols:
One hour prior to measurement, a seedling was taken from the growth chamber and placed in a 10 ml Perspex measuring chamber containing 5 ml of the bathing medium (control solution: 0.5 mM KCl and 0.1 mM CaCl2). Net ion fluxes were measured in this control solution to ensure steady initial values, then a double stock of NaCl-containing solution was applied to reach a final NaCl concentration of 80 mM, and transient recordings of the flux kinetics of K+ and H+ were measured. The time required for the stock addition and the establishment of the diffusion gradients is reported to be about 40 s (Shabala and Hariadi, 2005). Accordingly, the first 60 s after the solution change was discarded from the analysis, so appears as a gap in all figures.
Membrane potential measurements:
Conventional KCl-filled Ag/AgCl microelectrodes (Shabala and Lew, 2002; Cuin and Shabala, 2005), with a tip diameter of 0.5 μm were used with the MIFE electrometer to measure Em from epidermal cells in the root mature zone. Following cell penetration, Em was recorded for 2 min, then NaCl was added (as above) and the measurement continued for 15 min. For steady-state recordings, measurements were taken in control roots and in roots 30 min after 80 mM NaCl treatment. At least five individual plants for both control and treated roots were determined, with up to three measurements from each individual root.
Results
Whole plant responses
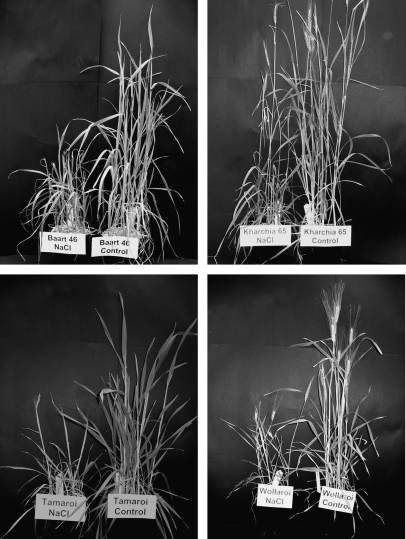
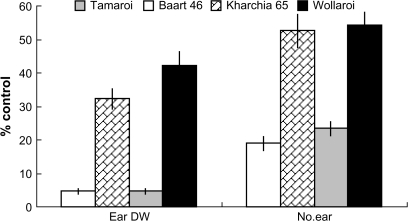
Salinity substantially reduced plant performance in all four wheat cultivars used in this study (Fig. 1). Shoot growth was significantly reduced (50–80% inhibition) after only 4 weeks of salt treatment, with durum cultivars being, in general, more affected than bread cultivars (data not shown). This was alongside a significant reduction in crop yield (Fig. 2). This reduction was a massive 95% in the two known salt-sensitive lines: Tamaroi and Baart 46, but much lower in salt-tolerant Kharchia 65 and Wollaroi (68% and 58%, respectively).
Fig. 1.
Eight-week-old wheat cultivars used in this study after 6 weeks of salt treatment. The growth of salt-treated plants (shown on the left hand side of each picture) is severely restricted compared with control plants (shown on the right).
Fig. 2.
Relative plant yield (% control; measured as the ear dry weight and the total number of ear per replicate) at the harvest of plants grown in 150 mM NaCl. Means ±SE (n=6).
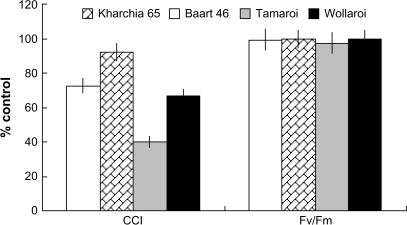
A significant (P < 0.05) decline in chlorophyll content was observed in all cultivars except Kharchia 65 (Fig. 3), with a much stronger effect in durum cultivars. The overall CCI-based ranking was as follows: Tamaroi (durum/sensitive)<Wollaroi (durum/tolerant)=Baart 46 (bread/sensitive)<Kharchia 65 (bread/tolerant) (Fig. 3). At the same time, maximal photochemical efficiency of PSII (measured as the Fv/Fm ratio) was unchanged by salinity in any of the lines, indicating the absence of detrimental salinity effects on leaf photochemistry.
Fig. 3.
The effect of four weeks of salinity on the relative changes (% control) in chlorophyll content index and chlorophyll fluorescence characteristics (Fv/Fm ratio, maximum photochemical efficiency of PSII) of four wheat cultivars. Means ±SE (n=6).
Ionic relations in plant tissues
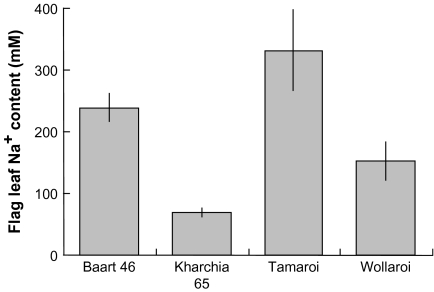
In the absence of salt, the Na+ content in leaf sap in all four wheat cultivars was negligible (around 1 mM; Fig. 4A). Supply of 150 mM NaCl to the plants for 4 weeks resulted in a significant increase in the Na+ content in the flag leaf of all the lines measured (Fig. 4B). By far the greatest increase was in the salt sensitive durum line Tamaroi (to 332±66 mM). The salt-tolerant durum cultivar Wollaroi accumulated half as much Na+ (152±30 mM). In bread varieties, about a 4-fold difference was observed (68±7 mM in the salt-tolerant Kharchia 65 versus 239±23 mM in salt-sensitive Baart 46) (Fig. 4B).
Fig. 4.
Effect of four weeks of 150 mM NaCl on the sap Na+ concentration of the flag leaf of salt-treated plants. Means ±SE (n=6). The Na+ content in the control plants was negligible.
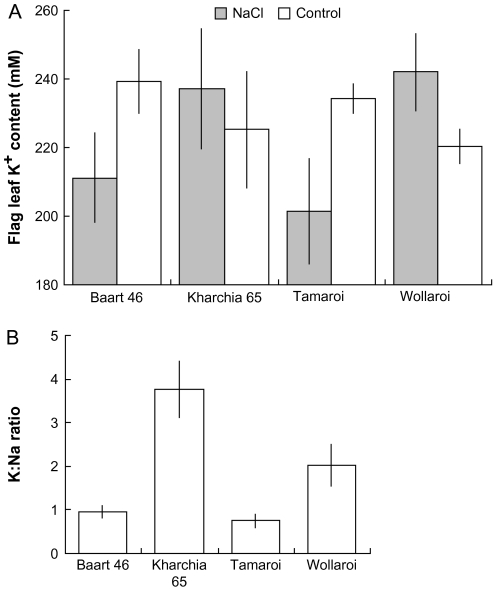
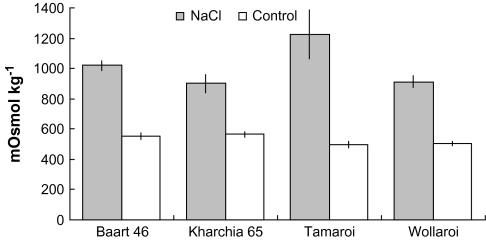
The flag leaf sap K+ concentration did not change significantly (P < 0.05) as a result of salinity in any of the lines tested (Fig. 5A), remaining in a range of 200–250 mM. Furthermore, no significant differences in the K+ content were seen between any of the cultivars, with or without salt treatment. Thus, the observed increase in cell sap osmolality (Fig. 6) is primarily the result of the increased Na+ content. However, an interesting trend emerged: while the two salt-sensitive varieties, Tamaroi (durum) and Baart 46 (bread) had their leaf sap K+ content reduced by 13–16% as a result of salinity treatment, the two tolerant varieties, Wollaroi (durum) and Kharchia 65 (bread), increased their leaf K+ content by 5–7% (Fig. 5A). Taken together, a significantly (P < 0.05) greater K:Na ratio was observed in Kharchia 65 and Wollaroi compared with their two salt-sensitive counterparts (Fig. 5B).
Fig. 5.
(A) Effect of salinity on the sap K+ concentration of the flag leaf after 4 weeks of 150 mM NaCl treatment. (B) K:Na ratio for salt-treated plants. Means ±SE (n=6).
Fig. 6.
Effect of salinity on the sap osmolality in 6-week-old salt-stressed and control wheat. Means ±SE (n=6).
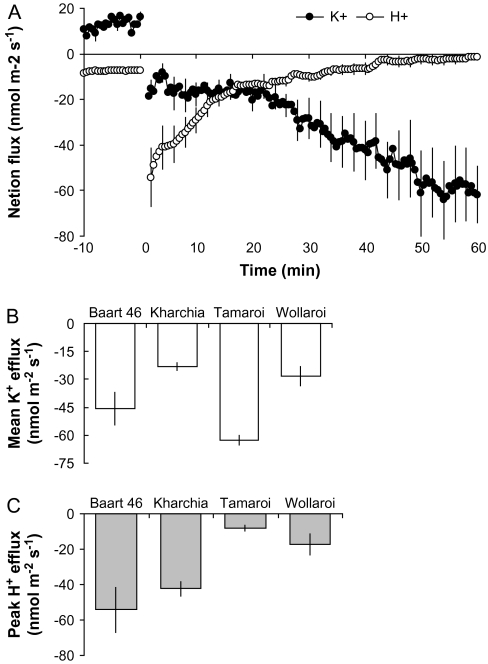
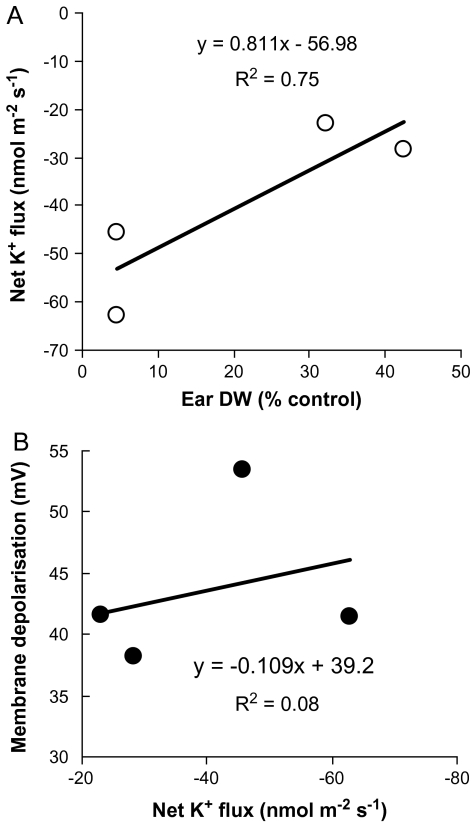
The application of 80 mM NaCl resulted in an immediate efflux of K+ from root epidermal cells from the mature zone of all wheat varieties measured (as illustrated for Baart 46 in Fig. 7A). The mean K+ efflux over the first 60 min after salt application was about 2-fold higher (significant at P < 0.05) in salt-tolerant varieties (Fig. 7B), showing a very strong (r2=0.75; Fig. 8A) correlation between the magnitude of NaCl-induced K+ efflux and plant yield at harvest (Fig. 9A). The overall ranking of cultivars for salt tolerance according to K+ flux data was as follows: Tamaroi<Baart 46<Wollaroi<Kharchia 65.
Fig. 7.
(A) Net K+ and H+ flux kinetics measured in 6-d-old seedlings of Baart 46 cultivar following 80 mM NaCl treatment. Fluxes were measured in the mature zone, about 10 mm from the root tip. Means ±SE (n=6). (B) Mean net K+ flux from each of the four cultivars over the first 60 min after NaCl application (80 mM). Means ±SE (n=6). (C) Peak H+ efflux values measured 2 min after NaCl stress onset in four wheat cultivars. Means ±SE (n=6). In all MIFE measurements, the sign convention is efflux negative.
Fig. 8.
Correlation between net mean K+ efflux measured from 6-d-old wheat seedlings and final plant yield at harvest (A) and the magnitude of membrane depolarization 60 min after 80 mM NaCl application (B). Each point represents a different cultivar.
Fig. 9.
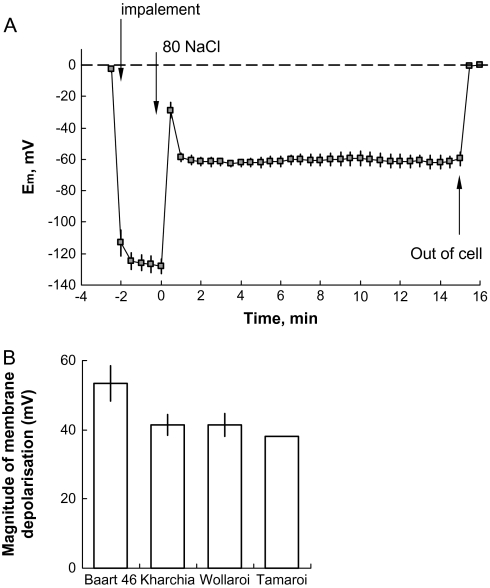
(A) The effects of 80 mM NaCl application on membrane potential in the mature zone of 6-d-old Baart 46 seedlings. (B) Steady-state membrane depolarization 60 min after salt application measured in all four cultivars. Mean ±SE (n=6).
H+ flux kinetics did not reveal any significant differences between cultivars 60 min after salt-stress application (data not shown). Although 80 mM NaCl imposition resulted in an initial efflux of H+ (Fig. 7A), it was quickly recovered within c. 15–20 min, returning back almost to the original steady-state value prior to salt treatment. Interestingly, however, was that the initial peak of H+ efflux measured 2 min after NaCl application, was significantly (P < 0.05) higher in bread compared with durum wheat cultivars (Fig. 7C).
Stress-induced changes in membrane potential
Salt imposition resulted in an immediate membrane depolarization by ∼60 mV (Fig. 9A). After a quick recovery (within 2 min), membrane potential values reached a new (depolarized) state that remained unchanged. No obvious relationship between a cultivar's salt tolerance and the magnitude of membrane depolarization was observed (Fig. 9B), resulting in the absence of any significant correlation between the magnitude of NaCl-induced K+ efflux and membrane potential values (Fig. 8B). This is in contrast with our previous work on barley (Chen et al., 2007b) and Arabidopsis (Shabala et al., 2006). Only Baart 46 showed ∼10 mV less negative values compared with three other cultivars.
Correlations between flag leaf ion content and growth characteristics
In contrast to the report by Genc et al. (2007), strong correlations were found for both the Na+ and K+ content of the flag leaf sap as well as the sap K:Na ratio with many of the physiological responses measured (Table 1). Most importantly from a farmer's point of view, the grain yield (measured as number and weight of ears) correlated negatively with sap Na+ content. Although this correlation was relatively strong (r2=0.65 and r2=0.71 for ear dry weight and number of ears, respectively), the positive correlation with the flag leaf sap K+ content was even stronger, with r2 values of 0.95 and 0.91 for ear dry weight and number of ears, respectively. Conversely, the correlation between the flag leaf sap K:Na ratio was weaker (r2=0.53 and 0.69).
Table 1.
Correlations (r2 values) between the relative (% of control) and total values for various physiological characteristics measured from four wheat cultivars in greenhouse experiments against flag leaf sap ion content
| Parameter | [Na+] | [K+] | K:Na ratio |
| Relative CCI | 0.820 | 0.461 | 0.662 |
| Relative Fv/Fm | 0.752 | 0.793 | 0.415 |
| Relative osmolality | 0.843 | 0.623 | 0.569 |
| Total [K+] | 0.821 | 1.000 | 0.631 |
| Total [Na+] | 1.000 | 0.820 | 0.882 |
| Relative [K+] | 0.736 | 0.982 | 0.590 |
| K:Na ratio | 0.882 | 0.631 | 1.000 |
| Relative RWC | 0.390 | 0.448 | 0.102 |
| Relative ear DW | 0.652 | 0.947 | 0.530 |
| Relative no. ears | 0.713 | 0.907 | 0.686 |
Correlations between potassium efflux and physiological characteristics
Neither the extent of the membrane depolarization nor the H+ flux correlated significantly with any of the physiological parameters measured (final yield, biomass, chlorophyll characteristics, ion content, calculated on the basis of their performance related to the control). On the other hand, significant negative correlations were found with 80 mM NaCl-induced K+ efflux (Table 2). The highest correlations were with the flag leaf sap ion content (r2 > 0.92, 0.86, and 0.93 for Na+, K+, and osmolality, respectively).
Table 2.
Correlations (r2 values) between the relative (% of control) and total values for various physiological characteristics measured from four wheat cultivars in greenhouse experiments and mean K+ efflux over the hours measured from mature zone of 6-d-old wheat roots following 80 mM NaCl treatment
| Parameter | r2 |
| Relative CCI | 0.745 |
| Relative Fv/Fm | 0.874 |
| Relative osmolality | 0.856 |
| Total [K+] | 0.916 |
| Total [Na+] | 0.965 |
| Relative [K+] | 0.833 |
| K:Na ratio | 0.755 |
| Relative RWC | 0.530 |
| Relative ear DW | 0.753 |
| Relative no. ears | 0.754 |
| Absolute ear DW | 0.808 |
| Absolute no. ears | 0.773 |
Again, and importantly, similar to flag leaf sap K+ content, a strong negative correlation was observed between the extent of NaCl-induced K+ efflux and the grain yield. Both the relative grain yield (measured as ear dry weight and number of ears) relative to the control, as well as the total yield, showed a strong correlation of r2 > 0.77 with the average efflux over the 60 min measuring period. This strongly indicates that the extent of NaCl-induced K+ efflux measured from young wheat seedlings can be used to predict the final yield of cultivars grown under saline conditions and that a smaller K+ efflux is related to a higher salt tolerance.
Discussion
Measuring the magnitude of the NaCl-induced K+ efflux from 3-d-old barley roots was shown to be an efficient tool for the discrimination of salt-tolerant barley varieties (Chen et al., 2007c), emphasizing the critical role of K+ homeostasis in salt tolerance. However, barley is a ‘salt includer’ (Maas and Hoffman, 1977; Rawson et al., 1988; Royo et al., 2000), and it is unclear whether the same concept is applicable to plant species with a different strategy of survival under saline conditions: that of Na+ exclusion rather than tissue tolerance. This work provides the affirmative answer to this question and suggests that a cell's ability to maintain intracellular K+ homeostasis also correlates with increased salt tolerance in wheat cultivars.
Salinity tolerance in wheat correlates with both reduced Na+ and increased K+ content in leaf sap
Salt stress resulted in Na+ accumulation within the flag leaf sap of all wheat cultivars used in this study (Fig. 4). The extent of this increase clearly correlated with plant performance, including grain yield (Table 1), consistent with the hypothesis that salt tolerance in wheat is associated with Na+ exclusion from the shoot (Gorham et al., 1987, 1990). This is not surprising, given the focus on Na+ exclusion as a selection criterion for salt tolerance in wheat (Munns et al., 2006).
However, the correlation between plant performance was even stronger with the flag leaf sap K+ content (Table 2), even though, in contrast to barley (Chen et al., 2005), changes in flag leaf sap K+ content were small and not significant (Fig. 5A). Nevertheless, two salt-tolerant varieties, Kharchia 65 and Wollaroi, increased their K+ content compared with their respective controls, while in salt-sensitive Baart 46 and Tamaroi, K+ levels were decreased by salinity. It must be remembered though, that changes in K+ levels at the whole tissue level are largely a reflection of the behaviour of K+ within the vacuole (Walker et al., 1996), so masking the degree of changes in cytosolic K+ activity (Walker et al., 1996; Cuin et al., 2003). It is after all, the cytosolic K+ homeostasis rather than the vacuolar K+ content that is essential for plant metabolic processes (Marschner, 1995; Walker et al., 1996; Maathuis and Amtmann, 1999). Certainly, in wheat, in addition to low rates of Na+ transport to the shoots, a high selectivity for K+ over Na+ has also been shown to be crucial in salt tolerance mechanisms (Gorham et al., 1987, 1990; Munns et al., 2006).
Wheat salt tolerance can be assessed by measuring NaCl-induced potassium efflux from roots of young seedlings
The application of 80 mM NaCl to the root mature zone of 6-d-old wheat seedlings resulted in a significant net efflux of K+ (Fig. 7), and the magnitude of this efflux correlated strongly with the performance of greenhouse plants grown under saline conditions (Table 2). Significantly greater K+ loss was recorded in poorly performing Baart 46 and Tamaroi compared with higher yielding Kharchia 65 and Wollaroi. These results strongly suggest that, similar to our previous reports on barley (Chen et al., 2005, 2007a, b), K+ retention is critical in maintaining performance and yield in wheat. Thus, measuring short-term, NaCl-induced K+ efflux in wheat seedlings could be used to select salt-tolerant durum and bread wheat cultivars.
The extent of the NaCl-induced potassium efflux differs from other plant species measured and may relate to salt-tolerance mechanisms
Interestingly, the NaCl-induced K+ efflux measured in wheat mature zones was considerably smaller than that previously measured in other species such as barley and Arabidopsis (Shabala et al., 2003, 2006; Chen et al., 2005, 2007b, c; Cuin and Shabala, 2005, 2007). Furthermore, the difference in K+ efflux between contrasting cultivars was only 2-fold (Fig. 7B), compared with a 6-fold difference between contrasting barley varieties (Chen et al., 2005, 2007b). Moreover, the greatest NaCl-induced K+ efflux was in the same range as that in salt-tolerant barley cultivars (compare Fig. 7B with Fig. 6 in Chen et al., 2005). Such a tiny efflux is probably reflected in the very small changes in the flag leaf sap K+ content in the long-term greenhouse trial (Fig. 4), changes that, when measured at the whole leaf level, are unlikely to detect subtle cytosolic K+ decreases.
Differential K+ retaining ability in contrasting wheat cultivars does not correlate with the magnitude of the NaCl-induced membrane depolarization
The massive influx of Na+ into cells that occurs upon the application of NaCl results in a membrane depolarization of about 70–80 mV (Shabala et al., 2003, 2006; L. Shabala et al., 2005; Cuin and Shabala, 2005). Membrane depolarization results in the activation of depolarization-activated outward-rectifying K+ channels (Maathuis and Sanders, 1995; Véry and Sentenac, 2003; Shabala et al., 2006), leading to an immediate and substantial loss of K+ from the cell (Cuin and Shabala, 2005; Shabala et al., 2006; Chen et al., 2007b). Such depolarization-activated K+ channels are primarily responsible for NaCl-induced K+ efflux in barley (Chen et al., 2007b) and Arabidopsis (Shabala et al., 2006), and maintenance of membrane potential under salinity correlates with salt-tolerance in barley (Chen et al., 2007b). However, membrane depolarization and its effects on K+ efflux within wheat roots contrasted greatly with barley. Firstly, the extent of the depolarization after the initial ‘shock’ was much less, in the range of 40–65 mV (Fig. 9B). Secondly, no apparent correlation between the extent of the salt-induced K+ efflux and membrane depolarization was observed (Fig. 8B). Thirdly, there was only a small recovery in membrane potential during the first h after salt imposition, possibly due to the very low level of H+ efflux shortly after salt application (Fig. 7A). Fourthly, the difference in the degree of the depolarization between different cultivars was much less than in barley, and although differences were found, they were generally insignificant. Finally, and most importantly, depolarization did not correlate with plant performance. The reasons behind this discrepancy are unknown and currently under investigation.
With an external K+ concentration of 0.5 mM in the bathing medium and an estimated cytosolic K+ concentration of 100 mM, the recorded membrane potential would need to be positive of –80 mV for activation of K+ efflux channels. Thus, we speculate that the extent of the salt-induced depolarization in wheat could be inadequate for fully activating depolarization-activated K+ channels, resulting in comparatively smaller salt-induced K+ effluxes compared with barley and Arabidopsis. One suggestion for this lower depolarization is that wheat is a salt excluder and so accumulates a far lower concentration of Na+ in the cell compared with Arabidopsis and barley, and it is the Na+ influx that is thought responsible for the membrane depolarization (Cakirlar and Bowling, 1981; Shabala et al., 2003). Certainly, the Na+ accumulation in all cultivars (Fig. 4) was considerably lower than that reported for barley (Chen et al., 2005; James et al., 2006).
NaCl-induced potassium efflux may be used as a physiological trait in breeding wheat for salinity tolerance
In light of the above, it is suggested that future breeding programmes need to focus on other factors important in salinity tolerance such as tissue tolerance and K+ retention as opposed to Na+ exclusion alone. However, the genetic causes of tissue tolerance are more difficult to quantify (Munns and James, 2003), leading to the historic and current focus of attention on identifying genetic sources of Na+ exclusion. Yet, none of this research has led to salt-tolerant varieties (Flowers, 2004; Munns et al., 2006). On the other hand, vacuolar compartmentation of excess Na+ would provide a cheap osmoticum for osmoregulation under saline conditions, osmolality that could be matched by cytosolic retention of K+. Indeed, the introduction of the Arabidopsis AtNHX1 gene into wheat significantly improved crop performance and yield under saline conditions, and this was alongside a higher K+ concentration (Xue et al., 2004). If wheat cultivars could be identified that show a greater maintenance of cellular K+ under saline conditions, lines could be bred from these, opening up new avenues for developing salt-tolerant wheat cultivars. Reducing salt-induced K+ efflux would allow its contribution towards osmoregulation, negating the need for a high investment into the production of organic solutes and allowing the critical maintenance of optimal cytosolic K:Na ratios.
However, measuring the actual flag leaf K+ concentration may be insufficient to achieve this goal. Although leaf K+ content has been used as an indicator of salinity tolerance, it does not correlate consistently with salinity tolerance (Genc et al., 2007), most likely because whole tissue K+ measurements are far too crude a method to detect changes in the cytosolic K+ content (Walker et al., 1996). Undeniably, in the results presented above, changes in the flag leaf sap K+ content did not vary significantly between contrasting genotypes (Fig. 5) despite the strong positive correlation with yield (Table 1). Furthermore, such tissue analyses, as with current screening methods, involves large-scale, time-consuming, costly greenhouse or field trials. Thus, there is a need for more ‘refined’ methods to measure the cytosolic K+ content, either directly or indirectly. This study does indicate that, as previously shown in barley (Chen et al., 2005, 2007c), the magnitude of NaCl-induced K+ efflux in the roots of 6-d-old wheat seedlings does strongly correlate with salinity tolerance as measured by various physiological parameters, including yield (Table 2). Consequently, it appears that, despite the different strategies for salt tolerance employed by barley and wheat, measuring NaCl-induced K+ flux from young wheat roots may present a highly sensitive system for indirect evaluation of cytosolic K+ content and, as a result, for screening large numbers of cultivars. This technique could therefore prove crucial in the detection of salt-tolerant strategies within wheat, particularly when considering the small range of salt tolerance (Davenport and Tester, 2000). Such inter-cultivar differences in salinity tolerance are likely to present as subtle differences, difficult to detect using current screening methods. Thus, selecting genotypes with minimal NaCl-induced K+ efflux may help to identify traits that can be used in future breeding programmes.
Acknowledgments
This work was supported by a GDRC grant UT00013 to Associate Professor S Shabala. We thank Mr Phil Andrews and Dr Zhonghua Chen for their technical assistance and helpful suggestions, and Dr Rana Munns (CSIRO Plant Industry, Canberra, ACT, Australia) and Michael Mackay (Tamworth Agricultural Institute, NSW, Australia) for kindly supplying the seeds for this study.
References
- Ashraf M, Khanum A. Relationship between ion accumulation and growth in two spring wheat lines differing in salt tolerance at different growth stages. Journal of Agronomy and Crop Science–Zeitschrift Fur Acker Und Pflanzenbau. 1997;178:39–51. [Google Scholar]
- Ashraf M, McNeilly T. Variability in salt tolerance of 9 spring wheat cultivars. Journal of Agronomy and Crop Science–Zeitschrift Fur Acker Und Pflanzenbau. 1988;160:14–21. [Google Scholar]
- Cakirlar H, Bowling DJF. The effect of salinity on the membrane potential of sunflower roots. Journal of Experimental Botany. 1981;32:479–485. [Google Scholar]
- Carden DE, Walker DJ, Flowers TJ, Miller AJ. Single-cell measurements of the contributions of cytosolic Na+ and K+ to salt tolerance. Plant Physiology. 2003;131:676–683. doi: 10.1104/pp.011445. [DOI] [PMC free article] [PubMed] [Google Scholar]
- Chen Z, Cuin TA, Zhou M, Twomey A, Naidu BP, Shabala S. Compatible solute accumulation and stress-mitigating effects in barley genotypes contrasting in their salt tolerance. Journal of Experimental Botany. 2007a;58:4245–4255. doi: 10.1093/jxb/erm284. [DOI] [PubMed] [Google Scholar]
- Chen Z, Newman I, Zhou M, Mendham N, Zhang G, Shabala S. Screening plants for salt tolerance by measuring K+ flux: a case study for barley. Plant, Cell and Environment. 2005;28:1230–1246. [Google Scholar]
- Chen ZH, Pottosin, Cuin TA, et al. Root plasma membrane transporters controlling K+/Na+ homeostasis in salt-stressed barley. Plant Physiology. 2007b;145:1714–1725. doi: 10.1104/pp.107.110262. [DOI] [PMC free article] [PubMed] [Google Scholar]
- Chen ZH, Shabala S, Mendham NJ, Newman I, Zhang GP, Zhou MX. Combining ability of salt tolerance based on NaCl induced K+ flux from roots of barley (Hordeum vulgare L.) Crop Science. 2008 (in press) [Google Scholar]
- Chen ZH, Zhou MX, Newman IA, Mendham NJ, Zhang GP, Shabala S. Potassium and sodium relations in salinized barley tissues as a basis of differential salt tolerance. Functional Plant Biology. 2007c;34:150–162. doi: 10.1071/FP06237. [DOI] [PubMed] [Google Scholar]
- Colmer TD, Flowers TJ, Munns R. Use of wild relatives to improve salt tolerance in wheat. Journal of Experimental Botany. 2006;57:1059–1078. doi: 10.1093/jxb/erj124. [DOI] [PubMed] [Google Scholar]
- Colmer TD, Munns R, Flowers TJ. Improving salt tolerance of wheat and barley: future prospects. Australian Journal of Experimental Agriculture. 2005;45:1425–1443. [Google Scholar]
- Cuin TA, Miller AJ, Laurie SA, Leigh RA. Potassium activities in cell compartments of salt-grown barley leaves. Journal of Experimental Botany. 2003;54:657–661. doi: 10.1093/jxb/erg072. [DOI] [PubMed] [Google Scholar]
- Cuin TA, Shabala S. Exogenously supplied compatible solutes rapidly ameliorate NaCl-induced potassium efflux from barley roots. Plant and Cell Physiology. 2005;46:1924–1933. doi: 10.1093/pcp/pci205. [DOI] [PubMed] [Google Scholar]
- Cuin TA, Shabala S. Amino acids regulate salinity-induced potassium efflux in barley root epidermis. Planta. 2007;225:753–761. doi: 10.1007/s00425-006-0386-x. [DOI] [PubMed] [Google Scholar]
- Davenport RJ, Tester M. A weakly voltage-dependent, nonselective cation channel mediates toxic sodium influx in wheat. Plant Physiology. 2000;122:823–834. doi: 10.1104/pp.122.3.823. [DOI] [PMC free article] [PubMed] [Google Scholar]
- Dvořák J, Gorham J. Methodology of gene-transfer by homoeologous recombination into Triticum turgidum: transfer of K+/Na+ discrimination from Triticum aestivum. Genome. 1992;35:639–646. [Google Scholar]
- Dvořák J, Noaman MM, Goyal S, Gorham J. Enhancement of the salt tolerance of Triticum turgidum L. by the Kna1 locus transferred from the Triticum aestivum L. chromosome 4D by homoeologous recombination. Theoretical and Applied Genetics. 1994;87:872–877. doi: 10.1007/BF00221141. [DOI] [PubMed] [Google Scholar]
- El-Hendawy SE, Hu YC, Yakout GM, Awad AM, Hafiz SE, Schmidhalter U. Evaluating salt tolerance of wheat genotypes using multiple parameters. European Journal of Agronomy. 2005;22:243–253. [Google Scholar]
- Flowers TJ. Improving crop salt tolerance. Journal of Experimental Botany. 2004;55:307–319. doi: 10.1093/jxb/erh003. [DOI] [PubMed] [Google Scholar]
- Francois LE, Maas EV, Donovan TJ, Youngs VL. Effect of salinity on grain-yield and quality, vegetative growth, and germination of semidwarf and durum-wheat. Agronomy Journal. 1986;78:1053–1058. [Google Scholar]
- Garthwaite AJ, von Bothmer R, Colmer TD. Salt tolerance in wild Hordeum species is associated with restricted entry of Na+ and Cl– into the shoots. Journal of Experimental Botany. 2005;56:2365–2378. doi: 10.1093/jxb/eri229. [DOI] [PubMed] [Google Scholar]
- Genc Y, McDonald GK, Tester M. Reassessment of tissue Na+ concentration as a criterion for salinity tolerance in bread wheat. Plant, Cell and Environment. 2007;30:1486–1498. doi: 10.1111/j.1365-3040.2007.01726.x. [DOI] [PubMed] [Google Scholar]
- Gorham J, Hardy C, Wyn Jones RG, Joppa LR, Law CN. Chromosomal location of a K/Na discrimination character in the D-genome of wheat. Theoretical and Applied Genetics. 1987;74:584–588. doi: 10.1007/BF00288856. [DOI] [PubMed] [Google Scholar]
- Gorham J, Wyn Jones RG, Bristol A. Partial characterization of the trait for enhanced K+-Na+ discrimination in the D-genome of wheat. Planta. 1990;180:590–597. doi: 10.1007/BF02411458. [DOI] [PubMed] [Google Scholar]
- Hollington PA. Technological breakthroughs in screening/breeding wheat varieties for salt tolerance. In: Gupta SK, Sharma SK, Tyagi NK, editors. National conference on salinity management in agriculture. Karnal, India: Central Soil Salinity Research Institute; 2000. pp. 273–289. [Google Scholar]
- James RA, Munns R, von Caemmerer S, Trejo C, Miller C, Codon T. Photosynthetic capacity is related to the cellular and subcellular partitioning of Na+, K+, and Cl– in salt-affected barley and durum wheat. Plant, Cell and Environment. 2006;29:2185–2197. doi: 10.1111/j.1365-3040.2006.01592.x. [DOI] [PubMed] [Google Scholar]
- Joshi AK, Sharma GS, Dhari R. Variability and associations of flag-leaf area and other traits in wheat. Indian Journal of Agricultural Sciences. 1982;52:351–355. [Google Scholar]
- Leigh RA. Potassium homeostasis and membrane transport. Journal of Plant Nutrition and Soil Science–Zeitschrift Fur Pflanzenernahrung Und Bodenkunde. 2001;164:193–198. [Google Scholar]
- Leigh RA, Wyn Jones RG. A hypothesis relating critical potassium concentrations for growth to the distribution and functions of this ion in the plant cell. New Phytologist. 1984;97:1–13. [Google Scholar]
- Maas EV, Grieve CM. Spike and leaf development in salt-stressed wheat. Crop Science. 1990;30:1309–1313. [Google Scholar]
- Maas EV, Hoffman GJ. Crop salt tolerance: current assessment. Journal of the Irrigation and Drainage Division of the American Society of Civil Engineering. 1977;103:115–134. [Google Scholar]
- Maathuis FJM, Amtmann A. K+ nutrition and Na+ toxicity: The basis of cellular K+/Na+ ratios. Annals of Botany. 1999;84:123–133. [Google Scholar]
- Maathuis FJM, Sanders D. Contrasting roles in ion-transport of 2 K+-channel types in root-cells of Arabidopsis thaliana. Planta. 1995;197:456–464. doi: 10.1007/BF00196667. [DOI] [PubMed] [Google Scholar]
- Marschner H. The mineral nutrition of higher plants. 2nd edn. London: Academic Press; 1995. [Google Scholar]
- Munns R, Hare RA, James RA, Rebetzke GJ. Genetic variation for improving the salt tolerance of durum wheat. Australian Journal of Agricultural Research. 2000;51:69–74. [Google Scholar]
- Munns R, James RA. Screening methods for salinity tolerance: a case study with tetraploid wheat. Plant and Soil. 2003;253:201–218. [Google Scholar]
- Munns R, James RA, Läuchli A. Approaches to increasing the salt tolerance of wheat and other cereals. Journal of Experimental Botany. 2006;57:1025–1043. doi: 10.1093/jxb/erj100. [DOI] [PubMed] [Google Scholar]
- Newman IA. Ion transport in roots: measurement of fluxes using ion-selective microelectrodes to characterize transporter function. Plant, Cell and Environment. 2001;24:1–14. doi: 10.1046/j.1365-3040.2001.00661.x. [DOI] [PubMed] [Google Scholar]
- Omielan JA, Epstein E, Dvořák J. Salt tolerance and ionic relations of wheat as affected by individual chromosomes of salt-tolerant Lophopyrum elongatum. Genome. 1991;34:961–974. [Google Scholar]
- Rascio A, Russo M, Mazzucco L, Platani C, Nicastro G, Di Fonzo N. Enhanced osmotolerance of a wheat mutant selected for potassium accumulation. Plant Science. 2001;160:441–448. doi: 10.1016/s0168-9452(00)00404-0. [DOI] [PubMed] [Google Scholar]
- Rawson HM, Richards RA, Munns R. An examination of selection criteria for salt tolerance in wheat, barley and Triticale genotypes. Australian Journal of Agricultural Research. 1988;39:759–772. [Google Scholar]
- Royo A, Aragues R, Playan E, Ortiz R. Salinity–grain yield response functions of barley cultivars assessed with a drip-injection irrigation system. Soil Science Society of America Journal. 2000;64:359–365. [Google Scholar]
- Shabala L, Cuin TA, Newman IA, Shabala S. Salinity-induced ion flux patterns from the excised roots of Arabidopsis sos mutants. Planta. 2005;222:1041–1050. doi: 10.1007/s00425-005-0074-2. [DOI] [PubMed] [Google Scholar]
- Shabala S. Ionic osmotic components of salt stress specifically modulate net ion fluxes from bean leaf mesophyll. Plant, Cell and Environment. 2000;23:825–837. [Google Scholar]
- Shabala S, Demidchik V, Shabala L, Cuin TA, Smith SJ, Miller AJ, Davies JM, Newman IA. Extracellular Ca2+ ameliorates NaCl-induced K+ loss from Arabidopsis root and leaf cells by controlling plasma membrane K+-permeable channels. Plant Physiology. 2006;141:1653–1665. doi: 10.1104/pp.106.082388. [DOI] [PMC free article] [PubMed] [Google Scholar]
- Shabala S, Hariadi Y. Effects of magnesium availability on the activity of plasma membrane ion transporters and light-induced responses from broad bean leaf mesophyll. Planta. 2005;221:56–65. doi: 10.1007/s00425-004-1425-0. [DOI] [PubMed] [Google Scholar]
- Shabala S, Shabala L, Van Volkenburgh E. Effect of calcium on root development and root ion fluxes in salinised barley seedlings. Functional Plant Biology. 2003;30:507–514. doi: 10.1071/FP03016. [DOI] [PubMed] [Google Scholar]
- Shabala SN, Lew RR. Turgor regulation in osmotically stressed Arabidopsis epidermal root cells. Direct support for the role of inorganic ion uptake as revealed by concurrent flux and cell turgor measurements. Plant Physiology. 2002;129:290–299. doi: 10.1104/pp.020005. [DOI] [PMC free article] [PubMed] [Google Scholar]
- Shabala SN, Newman IA, Morris J. Oscillations in H+ and Ca2+ ion fluxes around the elongation region of corn roots and effects of external pH. Plant Physiology. 1997;113:111–118. doi: 10.1104/pp.113.1.111. [DOI] [PMC free article] [PubMed] [Google Scholar]
- Tester M, Davenport R. Na+ tolerance and Na+ transport in higher plants. Annals of Botany. 2003;91:503–527. doi: 10.1093/aob/mcg058. [DOI] [PMC free article] [PubMed] [Google Scholar]
- Véry AA, Sentenac H. Molecular mechanisms and regulation of K+ transport in higher plants. Annual Review of Plant Biology. 2003;54:575–603. doi: 10.1146/annurev.arplant.54.031902.134831. [DOI] [PubMed] [Google Scholar]
- Walker DJ, Leigh RA, Miller AJ. Potassium homeostasis in vacuolate plant cells. Proceedings of the National Academy of Sciences, USA. 1996;93:10510–10514. doi: 10.1073/pnas.93.19.10510. [DOI] [PMC free article] [PubMed] [Google Scholar]
- Walker DJ, Smith SJ, Miller AJ. Simultaneous measurement of intracellular pH and K+ or in barley root-cells using triple-barreled, ion-selective microelectrodes. Plant Physiology. 1995;108:743–751. doi: 10.1104/pp.108.2.743. [DOI] [PMC free article] [PubMed] [Google Scholar]
- Xue ZY, Zhi DY, Xue GP, Zhang H, Zhao YX, Xia GM. Enhanced salt tolerance of transgenic wheat (Tritivum aestivum L.) expressing a vacuolar Na+/H+ antiporter gene with improved grain yields in saline soils in the field and a reduced level of leaf Na+ Plant Science. 2004;167:849–859. [Google Scholar]
- Zhu JK. Genetic analysis of plant salt tolerance using Arabidopsis. Plant Physiology. 2000;124:941–948. doi: 10.1104/pp.124.3.941. [DOI] [PMC free article] [PubMed] [Google Scholar]


