Abstract
In cytochrome c oxidase, a requirement for proton pumping is a tight coupling between electron and proton transfer, which could be accomplished if internal electron-transfer rates were controlled by uptake of protons. During reaction of the fully reduced enzyme with oxygen, concomitant with the “peroxy” to “oxoferryl” transition, internal transfer of the fourth electron from CuA to heme a has the same rate as proton uptake from the bulk solution (8,000 s−1). The question was therefore raised whether the proton uptake controls electron transfer or vice versa. To resolve this question, we have studied a site-specific mutant of the Rhodobacter sphaeroides enzyme in which methionine 263 (SU II), a CuA ligand, was replaced by leucine, which resulted in an increased redox potential of CuA. During reaction of the reduced mutant enzyme with O2, a proton was taken up at the same rate as in the wild-type enzyme (8,000 s−1), whereas electron transfer from CuA to heme a was impaired. Together with results from studies of the EQ(I-286) mutant enzyme, in which both proton uptake and electron transfer from CuA to heme a were blocked, the results from this study show that the CuA → heme a electron transfer is controlled by the proton uptake and not vice versa. This mechanism prevents further electron transfer to heme a3–CuB before a proton is taken up, which assures a tight coupling of electron transfer to proton pumping.
Keywords: flow–flash/proton pumping/cytochrome aa3/flash photolysis/gating
Cytochrome c oxidase is an integral membrane protein complex that catalyzes the sequential one-electron oxidations of cytochrome c coupled to the four-electron reduction of oxygen to water. Part of the free energy released in this process is conserved by translocation of protons across the membrane (for a recent review, see ref. 1). The coupling of electron transfer to proton transfer requires control of the rates of intramolecular electron- and proton-transfer reactions. To understand these physical processes on a molecular level, it is necessary to investigate in detail the individual electron- and proton-transfer steps during catalysis.
The crystal structures of cytochrome c oxidase from bovine heart (2–4) and Paracoccus denitrificans (5, 6) have been determined to atomic resolution. The three-dimensional structure of the highly homologous Rhodobacter sphaeroides enzyme is generally assumed to be very similar to the structures of the P. denitrificans and bovine enzymes (7–9), and these structures are used as models of the R. sphaeroides enzyme. The R. sphaeroides cytochrome c oxidase consists of three protein subunits in which four redox-active metal sites are embedded. During enzyme turnover, electrons from water-soluble cytochrome c are transferred consecutively to CuA, heme a, and the binuclear center consisting of CuB and heme a3. The elementary electron- and proton-transfer reactions associated with reaction of the reduced enzyme with oxygen have been investigated after flash photolysis of carbon monoxide (CO) from the fully reduced enzyme in the presence of O2 (referred to as the flow–flash technique) (1, 10–13). After dissociation of CO and binding of O2 to reduced heme a3, the so-called peroxy intermediate (PR) is formed (14, 15), concomitant with electron transfer from heme a to the binuclear center with a time constant of ≈50 μs (16), leaving CuA and presumably CuB reduced. This process is followed by formation of the so-called oxoferryl intermediate (F) at the binuclear center, accompanied by internal electron equilibration between CuA and heme a with a time constant of 120 μs (at pH 7.4), which results in reduction of heme a. Finally, when the fourth electron is transferred to F, the fully reduced oxygen (water) and the fully oxidized enzyme (O) are formed with a time constant of ≈1.2 ms (at pH 7.4) (16). In the bovine enzyme, proton pumping takes place during the P → F and F → O transitions, respectively (2 H+ in each step) (17). In both the bovine and R. sphaeroides solubilized enzymes in the flow–flash experiment these two transitions are associated with proton uptake from solution (16, 18).
Babcock and colleagues (1, 10, 19) suggested that a tight coupling between electron and proton transfer in a redox-driven proton pump can be maintained if internal electron-transfer reactions are controlled by uptake of pumped protons [see also a discussion on electroneutrality (20)]. In cytochrome c oxidase, this would assure that the pumped protons are taken up before the electrons are transferred to the binuclear center. As indicated above, during the PR → F transition at the binuclear center with a time constant of 120 μs, an electron is transferred from CuA to heme a with the same time constant. This electron transfer reaction is slower than that of the intrinsic electron transfer between these two sites [τ ≤ 35 μs, (21)]. Consequently, in light of the above discussed model for the function of a proton pump, it was proposed that during the PR → F transition the proton uptake controls the electron transfer from CuA to heme a (13, 22, 23). This hypothesis was further supported by results from studies of a mutant enzyme in which Glu 286 of subunit I was replaced by Gln (24). In this enzyme, the 120-μs proton uptake as well as the CuA → heme a electron transfer were impaired and it was suggested that the electron transfer was impaired because the proton uptake was blocked (24). However, the results with the EQ(I-286) mutant enzyme did not resolve the question of whether the converse might also be true.
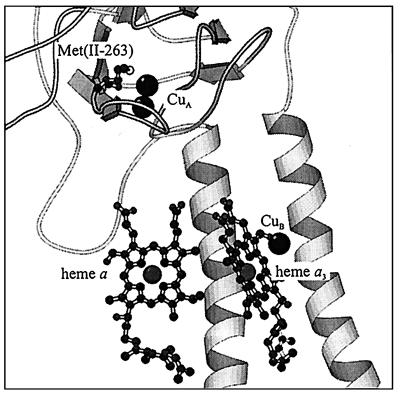
In this work, we have tested this hypothesis by investigation of electron and proton transfer in a site-specific mutant of the R. sphaeroides cytochrome c oxidase in which methionine 263 in subunit II [M(II-263)], a CuA ligand, has been replaced by leucine (Fig. 1). The mutation has a localized effect, resulting in decoupling of the two coppers of CuA, leading to an increased redox potential and a dramatically slowed internal electron transfer from CuA to heme a (25, 26). The results show that after transfer of the third electron to the binuclear center, proton uptake is observed with the same time constant as in the wild-type enzyme (120 μs), whereas no electron transfer from CuA to heme a is seen on this time scale. Together with the results from studies of the EQ(I-286) mutant enzyme, this shows that in the wild-type enzyme, the 120-μs proton uptake controls the electron transfer from CuA to heme a and not vice versa.
Figure 1.
The position of the CuA ligand Met(II-263) relative to the cofactors in cytochrome c oxidase. The backbone shown in the figure is from subunit II. The distance between CuA and the Fe of heme a is ≈20 Å. Coordinates are from the P. denitrificans structure (6). The picture was prepared by using the program molscript (37).
MATERIALS AND METHODS
The ML(II-263) mutant of cytochrome c oxidase from R. sphaeroides was constructed as described in ref. 27, and the enzyme was overexpressed and purified as described in Zhen et al. (28). The position of M(II-263) is shown in Fig. 1.
The catalytic activity of the enzyme was measured polarographically at 25°C in 50 mM KH2PO4, pH 6.5/0.05% lauryl maltoside/2.8 mM ascorbate/0.55 mM TMPD/1.1 mg/ml asolectin/30 μM horse-heart cytochrome c.
The mixed-valence-CO complex of the enzyme (in which heme a3/CuB are reduced and heme a/CuA are oxidized) was prepared by incubation of the oxidized enzyme under pure CO atmosphere (29).
The preparation of the fully reduced enzyme and the experimental setup have been described in detail elsewhere (16, 24). Briefly, a 10-μM solution of the enzyme was transferred to a cuvette. The solution was supplemented with phenazine methosulfate at 5 μM, and air was exchanged for nitrogen. The enzyme was reduced by an anaerobic addition of ascorbate to a final concentration of 2 mM, followed by exchange of nitrogen for carbon monoxide. The enzyme solution was transferred anaerobically to one of the drive syringes (500 μl total volume) of a locally modified Applied Photophysics (Surrey, UK) stopped-flow apparatus. The other syringe (2.5 ml total volume) was filled with an oxygen-saturated buffer. Measurements were performed as described previously (16, 24). For measurements at 830 nm, a solid-state laser (Melles Griot, Irvine, CA) was used as measuring light. Where applicable, a diode-array detector (Applied Photophysics) was used to determine the spectrum of the enzyme solution at different times (>2 ms) after flash photolysis of CO.
For proton-uptake measurements, buffer was removed on a PD-10 column (Pharmacia) equilibrated with 0.1 M KCl and 0.1% β-d-dodecyl maltoside at pH 7.5. The measurements were performed as described in detail in refs. 16 and 24. The O2-containing solution was supplemented with phenol red. The dye concentration was 40 μM after mixing. Calibration of the observed phenol-red absorbance changes to the number of protons taken up was done as described (24).
The amount of reacting enzyme was calculated from the CO-dissociation absorbance change at 445 nm, by using an absorption coefficient of 67 mM−1cm−1 (30).
RESULTS
The catalytic turnover of the ML(II-263) mutant enzyme was 150 s−1 (at pH 6.5), which is about 10% of that of the wild-type enzyme (1700 s−1) under the same conditions (26). At 830 nm, the absorption coefficient of reduced minus oxidized CuA in the ML(II-263) enzyme was 1.3 cm−1mM−1 (compared with 2.1 cm−1mM−1 in the wild-type enzyme) (27). The spectral characteristics of the other metal centers were unaltered.
Binding of CO to the Fully Reduced Enzyme.
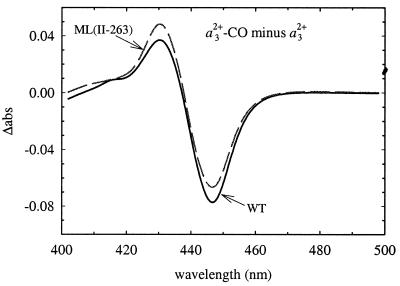
Fig. 2 shows the CO-difference absorption spectra (fully-reduced-CO complex minus fully-reduced enzyme) for the ML(II-263) and wild-type enzymes. As seen in the figure, the two spectra are very similar, which indicates that the binuclear center was intact in the mutant enzyme. A distorted CO binding to heme a3 was observed earlier in a CuA-ligand mutant [MI(II-227)] of cytochrome c oxidase from P. denitrificans (31).
Figure 2.
Absorbance difference spectrum of the fully reduced CO minus reduced wild-type (solid line) and ML(II-263) mutant (dashed line) enzymes. Experimental conditions: ≈1 μM enzyme/0.1 M Hepes, pH 7.4/0.1% β-d-dodecyl maltoside/1 mM CO, 22°C.
Electron Transfer in Mixed-Valence Enzyme.
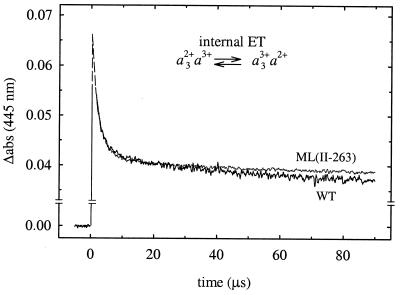
Internal electron transfer in the absence of oxygen was investigated after flash photolysis of CO from the partly reduced CO complex of the wild-type (21) and ML(II-263) mutant enzymes. Binding of the CO ligand stabilizes the reduced state of the binuclear center, while CuA and heme a remain oxidized. Consequently, on flash photolysis of CO, the electron at heme a3 equilibrates with heme a, observed as a decrease in absorbance at 445 nm with a time constant of ≈3 μs after dissociation of CO (Fig. 3). The extent of electron transfer was determined from the amplitude of the 3-μs absorbance change and was found to be ≈40% in the wild-type enzyme (21). Thus, in addition to the kinetic information, this method allows determination also of the equilibrium constant, i.e., the difference in redox potentials between hemes a and a3.
Figure 3.
Electron equilibration between hemes a and a3 after flash photolysis of CO (at t = 0) from the wild-type and ML(II-263) mutant mixed-valence-CO enzymes. The rapid increase following immediately after the flash is associated with dissociation of CO. The decrease in absorbance with a time constant of about 3 μs is associated with fractional electron transfer from heme a3 to heme a. The slower absorbance decrease after the 3-μs phase is associated with CO recombination. The absorbances have been extrapolated (dashed lines) to t = 0 from the fitted exponentials. The traces shown are the average of 15 individual traces. Experimental conditions: 22°C, 0.1 M Hepes, pH 7.4/0.1% β-d-dodecyl maltoside/1.3 μM reacting enzyme (note that in the graph the traces have been scaled to 1 μM enzyme)/1 mM CO.
Both the rate and extent of electron transfer between the hemes were the same in the ML(II-263) as in the wild-type enzyme (Fig. 3), which shows that the mutation did not alter the redox-potential difference between hemes a and a3.
Reaction with Oxygen.
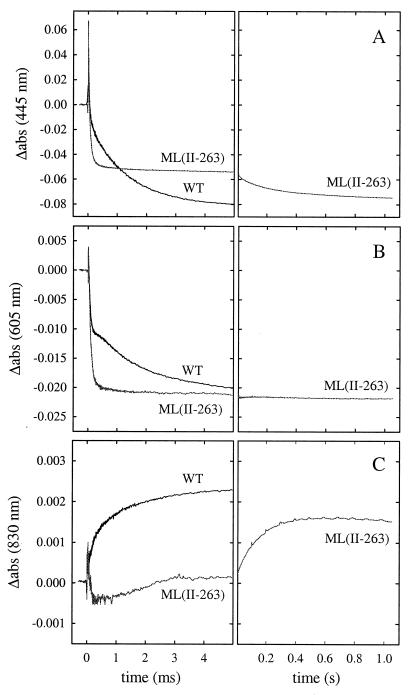
The kinetics of electron and proton transfer during reaction of the fully reduced wild-type (16) and ML(II-263) enzymes with O2 were investigated by using the flow–flash technique. The fully reduced enzyme with CO bound to heme a3 is mixed with an O2-containing solution. The CO ligand is flashed off by using a short laser flash, which allows binding of O2 to the binuclear center. Absorbance changes at 445 nm, 605 nm (contribution from the hemes), and 830 nm (significant contribution from CuA) after dissociation of CO from the fully reduced enzyme in the presence of O2 are shown in Fig. 4. At 445 nm, with the wild-type and ML(II-263) enzymes (Fig. 4A), the initial increase in absorbance at t = 0 is due to the dissociation of CO, leaving reduced heme a3. (The heme a32+-CO complex and heme a32+ have their absorption maxima at ≈430 nm and at ≈445 nm, respectively.) This reaction is followed by binding of O2 to reduced heme a3 with a time constant of ≈10 μs (at 1 mM O2, phase I) (not seen on the time scale shown in Fig. 4). The absorbance decrease at 445 nm and 605 nm with a time constant of ≈50 μs (phase II) reflects oxidation of hemes a and a3 on formation of the peroxy (PR) intermediate.
Figure 4.
Absorbance changes associated with reaction of fully reduced wild-type and ML(II-263) enzyme with O2 after flash photolysis of CO (at t = 0) monitored at (A) 445 nm, (B) 605 nm, and (C) 830 nm. The fully reduced CO complex of the enzyme was mixed with a solution saturated with O2 at a ratio of 1:5 about 100 ms before the flash. The traces shown are averages of 3, ≈10, and ≈20 traces, respectively. The periodic noise in the right panel in C originates from the solid-state laser used as measuring light. With the wild-type enzyme, the reaction is over within 5 ms. Consequently, the corresponding traces on the longer time scale (Right) have been left out. Experimental conditions: 22°C, 0.1 M Hepes, pH 7.4/0.05% β-d-dodecyl maltoside/1.9 μM reacting enzyme (the traces have been scaled to 1 μM enzyme)/1 mM O2.
With the wild-type enzyme (16), the following increase in absorbance with a time constant of 120 μs (phase III), most clearly seen at 605 nm (plateau at 100–200 μs in Fig. 4B) and at 830 nm (absorbance increase in Fig. 4C) is mainly because of fractional electron transfer from CuA to heme a, concomitant with formation of the oxoferryl intermediate (F).
In the last reaction phase, heme a and the remaining fraction of reduced CuA are oxidized, forming the fully oxidized enzyme with a time constant of 1.2 ms (phase IV, absorbance decrease at 445 nm and 605 nm and absorbance increase at 830 nm).
With the ML(II-263) mutant enzyme at 605 nm, after CO dissociation, the absorbance decayed with a time constant of ≈50 μs to about the same level as the final level after phase IV with the wild-type enzyme (Fig. 4B Left). Similarly, at 445 nm on the 5-ms time scale (Fig. 4A Left), only the first two phases were observed with the ML(II-263) enzyme. The absorbance then decreased, to reach the same absorbance as that of the fully oxidized wild-type enzyme with a time constant of 150 ms (Fig. 4A Right) (because of decay of the F intermediate to the oxidized enzyme; see below).
As seen in Fig. 4C, with the ML(II-263) mutant enzyme no increase in absorbance was observed on the 5-ms time scale at 830 nm (Fig. 4C Left), and the absorbance increased with a time constant of 150 ms, i.e., orders of magnitude slower than in the wild-type enzyme (Fig. 4C Right). The final absorbance level at 830 nm was lower with the mutant than with the wild-type enzyme because of the smaller absorption coefficient of reduced minus oxidized CuA in the ML(II-263) than in the wild-type enzyme. The rapid absorbance decrease, followed by an increase at 830 nm observed with the ML(II-263) enzyme during the first 3 ms, was because of a small contribution of heme absorbance changes at this wavelength (24, 32). With the wild-type enzyme, these changes are normally masked by the much larger increase in absorbance because of oxidation of CuA (see ref. 24).
Thus, the results in Fig. 4 show that in the ML(II-263) enzyme, after heme a is oxidized with a time constant of 50 μs, it is not re-reduced by CuA on the 5-ms time scale. The CuA site is oxidized several orders of magnitude slower than in the wild-type enzyme (τML ≅ 150 ms, τWT = 120 μs).
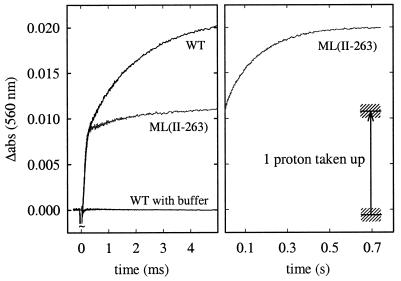
Fig. 5 shows absorbance changes at 560 nm of the pH-sensitive dye phenol red, associated with proton uptake from solution on flash photolysis of CO from the fully reduced enzyme in the presence of O2. At this wavelength, the enzyme displays very small absorbance changes associated with redox reactions of the metal sites. In the ML(II-263) enzyme, the first proton was taken up with the same time constant as in the wild-type enzyme (≈120 μs). However, whereas in the wild-type enzyme the second proton was taken up with a time constant of ≈1.2 ms, in the ML(II-263) enzyme the uptake of the second proton was much slower (τ ≅ 150 ms, i.e., the same time constant as the transfer of the fourth electron to the binuclear center). [Note that during oxidation of the fully reduced enzyme, a net of about two protons (not four) is taken up because during formation of the reduced state about two protons are taken up (20).]
Figure 5.
Absorbance changes of the pH dye phenol red associated with proton uptake during reaction of the fully reduced wild-type and ML(II-263) enzymes with O2. The traces shown are the differences between the traces obtained in an unbuffered and a buffered solution. A laser artifact around t = 0 has been truncated for clarity. The traces shown in the figure are averages of about 20 traces. The buffer capacity of the exhaust solutions were approximately the same for the wild-type and ML(II-263) enzymes. The arrow shows the calibrated value corresponding to the uptake of one proton. The calibration error is shown as shaded areas. Experimental conditions: 22°C, 0.1 M KCl (0.1 M Hepes)/0.05% β-d-dodecyl maltoside/40 μM phenol red/2 μM reacting enzyme/1 mM O2.
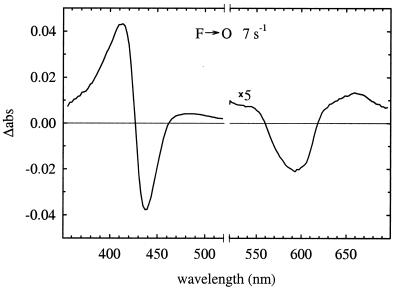
To identify the oxygen intermediate bound at the binuclear center in the ML(II-263) enzyme after the 120-μs proton uptake, but before the transfer of the fourth electron to the binuclear center, absorbance changes were monitored with a time resolution of ≈2 ms in the wavelength range 350–700 nm, by using a diode-array detector. Fig. 6 shows the kinetic difference spectrum of the slowest reaction phase with a time constant of 150 ms. As seen in the figure, this spectrum is characteristic of the O minus F spectrum (14, 33). The concentration of the F intermediate was estimated from the absorbance difference A583–A650 by using an absorption coefficient of 5.3 mM−1cm−1 (33) to be about the same as the enzyme concentration (as determined from the CO-dissociation absorbance change at 445 nm), i.e., the F intermediate was formed in ≈100% of the enzyme population. The trough at ≈590 nm in Fig. 6 is slightly red-shifted as compared with the F–O spectrum shown in ref. 33.
Figure 6.
An absorbance difference spectrum corresponding to the slowest kinetic phase observed during reaction of the fully reduced ML(II-263) enzyme with O2 (τ ≅ 150 ms, k ≅ 7 s−1) by using a diode-array detector. The diode-array data were globally fitted with a single exponential from which the spectrum was calculated. The concentration of reacting enzyme was calculated from the CO-dissociation absorbance change at 445 nm (absorption coefficient 67 mM−1cm−1). The kinetic difference spectrum is consistent with the F → O transition, i.e., the O minus F spectrum. In the range 520–700 nm, the absorbance changes have been multiplied by five. Conditions were the same as in Fig. 4, except that the enzyme concentration was 2.3 μM (the spectrum in the graph is scaled to 1 μM enzyme).
DISCUSSION
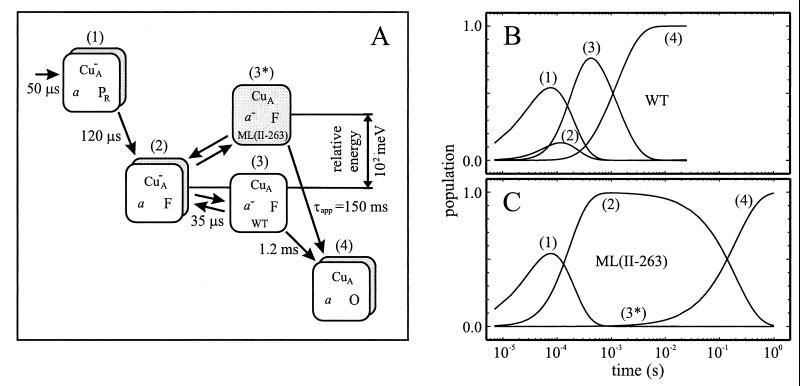
Mutation of Met-263 of subunit II caused a localized change in CuA that resulted in a dramatically slower electron transfer from CuA to heme a, which made it possible to investigate the sequence of electron transfer and proton uptake during catalysis. The results are summarized in Fig. 7.
Figure 7.
(A) Comparison of the reaction sequences in the wild-type (white boxes) and ML(II-263) (gray boxes) enzymes. For simplicity, the states of the binuclear center are indicated with the corresponding O2 intermediates PR, F, and O. The energy scale of the ordinate is arbitrary, except the free-energy difference between states (3) and (3*) of about 102 millielectronvolts (meV). This difference in the energy levels of states (3) and (3*) results in a different population sequence (in time) for the intermediates in the wild-type (B) and ML(II-263) (C) mutant enzymes. The curve for (3*) in (C) is not shown because this intermediate is only populated to a maximum of about 2%.
Electron-Transfer Reactions.
After flash photolysis of CO from the fully reduced wild-type enzyme in the presence of O2 at 445 nm and 605 nm, the first two phases were associated with binding of O2 to heme a3 with a time constant of ≈10 μs (at 1 mM O2) and oxidation of hemes a and a3 forming the peroxy (P) intermediate at the binuclear center with a time constant of 50 μs (16).
In the mutant enzyme at 605 nm, after phases I and II, the absorbance had dropped to about the same level as that after the final phase with the wild-type enzyme (Fig. 4B). At this wavelength, the main contribution to the observed absorbance changes is from redox reactions of heme a. Thus, in both the wild-type and ML(II-263) mutant enzymes, the absorbance decreased initially because heme a became oxidized. In the wild-type enzyme, the initial decrease in absorbance was followed by an increase (phase III) and decrease (phase IV), associated with electron transfer from CuA to heme a and from heme a to the binuclear center, respectively. Thus, in the final state of the wild-type enzyme about 5 ms after the flash, heme a was oxidized. With the ML(II-263) enzyme after phase II, the 605-nm absorbance remained at the same level as the final level of the wild-type enzyme because with the ML(II-263) mutant enzyme, heme a was not re-reduced on the 5-ms time scale. Thus, the difference between the states formed in the wild-type and ML(II-263) enzymes about 5 ms after CO dissociation is that in the former, all redox centers are fully oxidized, whereas in the latter, CuA is reduced and the F intermediate is present at the binuclear center (see also below). Both enzymes display about the same absorbance at 605 nm after ≈5 ms because redox changes of CuA do not contribute to the absorbance changes and the difference in absorbance between the F intermediate and the fully oxidized enzyme is very small at this wavelength (14, 33).
The absence of electron transfer from CuA to heme a in the ML(II-263) enzyme on the 5-ms time scale is also evident from the lack of absorbance increase at 830 nm (Fig. 4C). As seen on the longer time scale in Fig. 4C, with the ML(II-263) enzyme the absorbance increased with a time constant of 150 ms.
In both the wild-type and mutant enzymes, after phase II (PR state) there are three electrons at the binuclear center. Formation of PR was followed by formation of the F intermediate. As indicated above, in the wild-type enzyme, the 120-μs increase in absorbance at 605 nm, concomitant with formation of the F intermediate, is mainly associated with the electron transfer from CuA to heme a. Therefore, this increase in absorbance was not observed with the ML(II-263) enzyme, even though the F intermediate was formed in about 100% of the enzyme population. Formation of the F intermediate, but in a smaller fraction of the enzyme population (15%) was also found during reaction of the reduced CuA-ligand mutant [MI(II-227)] cytochrome c oxidase from P. denitrificans with O2 (31).
In the ML(II-263) mutant enzyme, the fourth electron was transferred to the binuclear center (Fig. 4) and a second proton was taken up (Fig. 5) with a time constant of about 150 ms, i.e., ≈100 times slower than in the wild-type enzyme. Because in the ML(II-263) mutant enzyme the electron-transfer rate from heme a to heme a3 is the same as in the wild-type enzyme (see Fig. 3), the dramatically slower transfer of the fourth electron to the binuclear center may be either because of a slower, rate-limiting intrinsic transfer rate from CuA to heme a or a higher redox potential of CuA relative to that of heme a (or a combination of the two effects). The first case is unlikely, because in the oxidized enzyme the intrinsic electron-transfer rate from CuA to heme a (50 s−1) is faster than 7 s−1 (Y.Z., F. Millet, and S.F.-M., unpublished results). Assuming a rapid (compared with 150 ms) CuA–heme a electron-transfer equilibrium, the apparent electron-transfer rate from CuA to the binuclear center is determined by the fraction of reduced heme a times the electron-transfer rate from heme a to the binuclear center:
 |
1 |
where a “−” sign denotes a reduced site (CuB is omitted for simplicity). Because the observed electron-transfer rate in the ML(II-263) enzyme was ≈7 s −1 (τ ≅ 150 ms), according to the model outlined in Eq. 1 the redox potential of CuA in the mutant enzyme must be about ≈102 mV higher than that of heme a. This estimation is consistent with independent measurements, which show that the redox-potential difference between heme a and CuA (Ea − ECuA) is ≈−60 mV (compared with +50 mV in the wild-type enzyme) (25). A 100-mV increase in the redox potential of CuA was also found in the MI(II-227) mutant cytochrome c oxidase from P. denitrificans (31).
Proton–Electron Coupling.
In summary, on the basis of the above discussion, we conclude that in the ML(II-263) mutant, as in the wild-type enzyme, a proton is taken up and the F intermediate is formed with a time constant of 120 μs, but in the mutant enzyme, electron transfer from CuA to heme a is impaired on this time scale. This observation shows that the 120-μs proton uptake is not controlled by the CuA to heme a electron transfer.
The kinetics of the electron-transfer equilibrium between CuA and heme a can be studied independently, for example after flash photolysis of CO from the two or three electron-reduced enzymes in the absence of O2 (21, 34), or from ruthenium-labeled cytochrome c (35). In R. sphaeroides wild-type cytochrome aa3, the time constant of this electron transfer is 10–35 μs (21, 36), i.e., a factor of 3–10 faster than during O2 reduction (phase III). It was therefore proposed that during reaction of the fully reduced enzyme with O2, this electron transfer may be controlled by other events, such as proton uptake (22–24). This proposal was further supported by investigations of the ubiquinol oxidase cytochrome bo3 from Escherichia coli, which showed that during O2 reduction, electron transfer from the bound quinol (QH2) to heme b was ≈10 times slower than proton uptake associated with the PR → F transition (22). In this enzyme, the electron-transfer rate was presumably determined by the relatively slow oxidation of QH2, which is the reason why the electron transfer was slower than the proton uptake to the binuclear center. Further support for a control of the electron transfer by proton uptake was obtained from studies of the EQ(I-286) mutant enzyme in which, during reaction of the fully reduced enzyme with O2, both proton uptake (associated with formation of the F intermediate) and electron transfer from CuA to heme a were impaired (24). The results with the EQ(I-286) mutant enzyme showed that electron transfer from CuA to heme a is impaired when proton uptake is impaired, but they did not resolve the question whether the converse also is true. The results with the ML(II-263) mutant enzyme show that the 120-μs proton uptake takes place independently of the electron transfer from CuA to heme a (Fig. 7). Together with the results from studies of the EQ(I-286) enzyme, this result indicates that the proton uptake (formation of F) controls the electron transfer from CuA to heme a but not vice versa. One possible type of direct interaction between proton uptake and electron transfer is electrostatic control (22–24). In other words, the increase in positive charge around the binuclear center on proton uptake increases the apparent redox potential of heme a more than that of CuA because of the smaller distance between heme a3 and heme a (≈13 Å center to center) than between heme a3 and CuA (≈20 Å) (2, 3).
This type of control of electron transfer by proton transfer is consistent with the model proposed by Babcock and colleagues, who suggested that a tight coupling between the exergonic electron transfers to partly reduced oxygen intermediates and proton pumping can be maintained if the electron-transfer rates (and the associated uptake of substrate protons) are controlled by the uptake of pumped protons (1, 10, 19). The results from this study also hint at a mechanism by which the enzyme controls the sequence of electron- and proton-transfer events during catalysis:
(i) Only after arrival of the third electron to the binuclear center is a proton taken up [there is no proton uptake from solution on forming P in the mixed-valence enzyme (18)]. This proton is taken up through the D-pathway, including residues D(I-132) and E(I-286) (13, 24).
(ii) This proton uptake is necessary for the transfer of the electron from CuA to heme a.
(iii) The CuA-to-heme a electron transfer is necessary for the transfer of the fourth electron to the binuclear center, because a direct electron transfer from CuA to heme a3 does not take place.
(iv) The transfer of the fourth electron to the binuclear center is coupled to the uptake of another proton (through the D-pathway). The question whether the electron controls the proton or vice versa in this last reaction step remains an open question for future investigations.
Acknowledgments
These studies were supported by grants from The Swedish Foundation for International Cooperation in Research and Higher Education (STINT) and The Swedish Natural Science Research Council and from The National Institutes of Health (GM 26916 to S.F.-M.).
ABBREVIATIONS
- PR
peroxy intermediate formed in the fully reduced enzyme
- F
oxoferryl intermediate
- O
fully oxidized enzyme
- τ
time constant [exp(-t/τ)]
- WT
wild type
- CuA
copper A
- CuB
copper B
- mixed-valence state
a state in which heme a3/CuB are reduced and heme a/CuA are oxidized
- mutant-enzyme nomenclature
ML(II-263) denotes a replacement of methionine-263 of subunit II by leucine. If not otherwise indicated, amino acid residues are numbered according to the R. sphaeroides sequence
References
- 1.Ferguson-Miller S, Babcock G T. Chem Rev (Washington, DC) 1996;96:2889–2907. doi: 10.1021/cr950051s. [DOI] [PubMed] [Google Scholar]
- 2.Tsukihara T, Aoyama H, Yamashita E, Tomizaki T, Yamaguchi H, Shinzawa-Itoh K, Nakashima R, Yaono R, Yoshikawa S. Science. 1995;269:1069–1074. doi: 10.1126/science.7652554. [DOI] [PubMed] [Google Scholar]
- 3.Tsukihara T, Aoyama H, Yamashita E, Tomizaki T, Yamaguchi H, Shinzawa-Itoh K, Nakashima R, Yaono R, Yoshikawa S. Science. 1996;272:1136–1144. doi: 10.1126/science.272.5265.1136. [DOI] [PubMed] [Google Scholar]
- 4.Yoshikawa S, Shinzawa-Itoh K, Nakashima R, Yaono R, Yamashita E, Inoue N, Yao M, Fei M J, Libeu C P, Mizushima T, et al. Science. 1998;280:1723–1729. doi: 10.1126/science.280.5370.1723. [DOI] [PubMed] [Google Scholar]
- 5.Iwata S, Ostermeier C, Ludwig B, Michel H. Nature (London) 1995;376:660–669. doi: 10.1038/376660a0. [DOI] [PubMed] [Google Scholar]
- 6.Ostermeier C, Harrenga A, Ermler U, Michel H. Proc Natl Acad Sci USA. 1997;94:10547–10553. doi: 10.1073/pnas.94.20.10547. [DOI] [PMC free article] [PubMed] [Google Scholar]
- 7.Hosler J P, Ferguson-Miller S, Calhoun M W, Thomas J W, Hill J, Lemieux L, Ma J, Georgiou C, Fetter J, Shapleigh J P, et al. J Bioenerg Biomembr. 1993;25:121–136. doi: 10.1007/BF00762854. [DOI] [PubMed] [Google Scholar]
- 8.Shapleigh J P, Hill J J, Alben J O, Gennis R B. J Bacteriol. 1992;174:2338–2343. doi: 10.1128/jb.174.7.2338-2343.1992. [DOI] [PMC free article] [PubMed] [Google Scholar]
- 9.Calhoun M W, Thomas J W, Gennis R B. Trends Biochem Sci. 1994;19:325–330. doi: 10.1016/0968-0004(94)90071-x. [DOI] [PubMed] [Google Scholar]
- 10.Babcock G T, Wikström M. Nature (London) 1992;356:301–309. doi: 10.1038/356301a0. [DOI] [PubMed] [Google Scholar]
- 11.Hill B C, Hill J J, Gennis R B. Biochemistry. 1994;33:15110–15115. doi: 10.1021/bi00254a021. [DOI] [PubMed] [Google Scholar]
- 12.Einarsdóttir Ó. Biochim Biophys Acta. 1995;1229:129–147. doi: 10.1016/0005-2728(94)00196-c. [DOI] [PubMed] [Google Scholar]
- 13.Brzezinski P, Ädelroth P. J Bioenerg Biomembr. 1998;30:99–107. doi: 10.1023/a:1020567729941. [DOI] [PubMed] [Google Scholar]
- 14.Morgan J E, Verkhovsky M I, Wikström M. Biochemistry. 1996;35:12235–12240. doi: 10.1021/bi961634e. [DOI] [PubMed] [Google Scholar]
- 15.Sucheta A, Georgiadis K E, Einarsdóttir Ó. Biochemistry. 1997;36:554–565. doi: 10.1021/bi962422k. [DOI] [PubMed] [Google Scholar]
- 16.Ädelroth, P., Ek, M. & Brzezinski, P. (1998) Biochim. Biophys. Acta, in press. [DOI] [PubMed]
- 17.Wikström M. Nature (London) 1989;338:776–778. doi: 10.1038/338776a0. [DOI] [PubMed] [Google Scholar]
- 18.Oliveberg M, Hallén S, Nilsson T. Biochemistry. 1991;30:436–440. doi: 10.1021/bi00216a019. [DOI] [PubMed] [Google Scholar]
- 19.Babcock G T, Floris R, Nilsson T, Pressler M, Varotsis C, Vollenbroek E. Inorg Chim Acta. 1996;243:345–353. [Google Scholar]
- 20.Mitchell R, Rich P R. Biochim Biophys Acta. 1994;1186:19–26. doi: 10.1016/0005-2728(94)90130-9. [DOI] [PubMed] [Google Scholar]
- 21.Ädelroth P, Brzezinski P, Malmström B G. Biochemistry. 1995;34:2844–2849. doi: 10.1021/bi00009a014. [DOI] [PubMed] [Google Scholar]
- 22.Svensson Ek M, Brzezinski P. Biochemistry. 1997;36:5425–5431. doi: 10.1021/bi962478e. [DOI] [PubMed] [Google Scholar]
- 23.Hallén S, Brzezinski P. Biochim Biophys Acta. 1994;1184:207–218. doi: 10.1016/0005-2728(94)90225-9. [DOI] [PubMed] [Google Scholar]
- 24.Ädelroth P, Svensson Ek M, Mitchell D M, Gennis R B, Brzezinski P. Biochemistry. 1997;36:13824–13829. doi: 10.1021/bi9629079. [DOI] [PubMed] [Google Scholar]
- 25.Zhen Y, Wang K F, Mills D, Ferguson-Miller S, Millett F. Biophys J. 1997;72:A93. (abstr.). [Google Scholar]
- 26.Zhen Y, Mills D, Hoganson C, Lucas R, Shi W, Babcock G T, Ferguson-Miller S. In: Frontiers of Cellular Bioenergetics. Papa S, Guerrieri F, Tager J M, editors. New York: Plenum; 1998. , in press. [Google Scholar]
- 27.Zhen Y. Ph.D. thesis. East Lansing, MI: Michigan State University; 1998. [Google Scholar]
- 28.Zhen Y, Qian J, Follmann K, Hosler J, Hayward T, Nilsson T, Dahn M, Hilmi Y, Hamer A, Hosler J, et al. Protein Expression Purif. 1998;13:326–336. doi: 10.1006/prep.1998.0903. [DOI] [PubMed] [Google Scholar]
- 29.Brzezinski P, Malmström B G. FEBS Lett. 1985;187:111–114. doi: 10.1016/0014-5793(85)81224-2. [DOI] [PubMed] [Google Scholar]
- 30.Vanneste W H. Biochemistry. 1966;5:838–848. doi: 10.1021/bi00867a005. [DOI] [PubMed] [Google Scholar]
- 31.Zickermann V, Verkhovsky M, Morgan J, Wikström M, Anemüller S, Bill E, Steffens G C, Ludwig B. Eur J Biochem. 1995;234:686–693. doi: 10.1111/j.1432-1033.1995.686_b.x. [DOI] [PubMed] [Google Scholar]
- 32.Hendler R W, Harmon P A, Levin I W. Biophys J. 1994;67:2493–2500. doi: 10.1016/S0006-3495(94)80739-8. [DOI] [PMC free article] [PubMed] [Google Scholar]
- 33.Wikström M, Morgan J E. J Biol Chem. 1992;267:10266–10273. [PubMed] [Google Scholar]
- 34.Morgan J E, Li P M, Jang D J, el-Sayed M A, Chan S I. Biochemistry. 1989;28:6975–6983. doi: 10.1021/bi00443a030. [DOI] [PubMed] [Google Scholar]
- 35.Geren L M, Beasley J R, Fine B R, Saunders A J, Hibdon S, Pielak G J, Durham B, Millett F. J Biol Chem. 1995;270:2466–2472. doi: 10.1074/jbc.270.6.2466. [DOI] [PubMed] [Google Scholar]
- 36.Zhen Y, Wang K, Sadoski R, Grinnell S, Geren L, Ferguson-Miller S, Durham B, Millett F. Biophys J. 1998;74:A77. doi: 10.1074/jbc.274.53.38042. (abstr.). [DOI] [PubMed] [Google Scholar]
- 37.Kraulis P J. J Appl Crystallogr. 1991;24:946–950. [Google Scholar]


