

Abstract
Associations between serum uric acid (UA) levels and metabolic syndrome (MetS) have been reported in cross-sectional studies. Limited information, however, is available concerning the prospective association of UA and risk of developing MetS. The authors evaluated UA as a risk factor for incident MetS in a prospective study of 8,429 men and 1,260 women (ages 20–82 years) who were free of MetS and for whom measures of waist girth, resting blood pressure, fasting lipids and glucose were taken during baseline and follow-up examinations between 1977 and 2003. Hyperuricemia was defined as >7.0 mg/dL in men and >6.0 mg/dL in women. MetS was defined with NCEP ATP III criteria. The overall prevalence of hyperuricemia was 17%. During a mean follow-up of 5.7 years, 1120 men and 44 women developed MetS. Men with serum UA concentrations ≥6.5 mg/dL (upper third) had a 1.60-fold increase in risk of MetS (95% confidence interval [CI]: 1.34–1.91), as compared with those who had concentrations <5.5 mg/dL (lowest third). Among women, the risk of MetS was at least 2-fold higher for serum UA concentrations ≥4.6 mg/dL (p for trend=0.02). Higher serum UA is a strong and independent predictor of incident MetS in men and women.
1. Introduction
Metabolic syndrome (MetS) is a clustering of cardiovascular disease (CVD) risk factors [1]: abdominal obesity, atherogenic dyslipidemia, elevated blood pressure, and insulin resistance. It has become a large public health issue in the United States, affecting more than 50 million adult Americans [2], and its prevalence is increasing [3]. Because MetS is associated with a higher risk of CVD and diabetes [1, 4, 5], identifying high-risk asymptomatic individuals for these conditions may lead to better understanding of the pathophysiology of MetS and improvements in prevention and treatment [6].
Several emerging CVD risk factors have been studied in the context of clinical and epidemiological studies in relation to CVD outcomes, including C-reactive protein, fibrinogen and uric acid (UA) [7–10]. In particular, previous studies have reported the association between elevated serum UA and individual components of the MetS and established the link between serum levels of UA and hypertension [11–15], dyslipidemia [13, 14, 16, 17], glucose intolerance [12–15, 17], and obesity [13, 14]. In addition, the serum UA concentration is higher in individuals who have higher numbers of MetS variables [13, 15, 18]. Despite some epidemiologic research demonstrating a positive relationship between serum UA levels and the prevalence of MetS [19–21], prospective data on serum UA as predictor of MetS incidence are limited [22]. In fact, there is only one recent study from Korea which examined risk factors for incidence of MetS in young male workers ages 30 to 39 [22]. After 3 years of follow-up, the risk for developing MetS was progressively higher as serum UA levels increased, and this held even after adjustment for potentially confounding factors, including self-reported physical activity.
Given the increases in the prevalence of MetS [3], its association with increased risk for developing CVD and diabetes [4, 5], and the lack of prospective data on the factors associated with MetS incidence in women and the elderly [22], we set forth to examine the association between serum UA levels and incident MetS in a large cohort of women and men with a wide age range. Participants in the Aerobics Center Longitudinal Study (ACLS) who were free of MetS and healthy at baseline constituted the study group. Moreover, the study controlled for the influence of cardiorespiratory fitness (CRF), an objective measure of regular physical activity habits, to reduce confounding by this risk factor not only because our previous analyses in the ACLS showed an inverse association between CRF and prevalent [23, 24] and incident MetS [25], but also because acute exercise bouts can cause transient hyperuricemia [26] while exercise training can reduce UA levels [27].
2. Subjects and Methods
2.1. Study population
Participants for this study were 8,429 men and 1,260 women 20–82 years of age (mean 43.7 years) at baseline who were examined at the Cooper Clinic in Dallas, Texas, between 1977 and 2003. All participants completed at least two preventive medical evaluations with complete measures for each MetS variable. Study participants came to the clinic for periodic preventive health examinations and for counseling regarding diet, exercise, and other lifestyle factors associated with increased risk of chronic disease. Many participants were referred by their employers for the examination; others were referred by their personal physicians or were self-referred. At baseline, all participants were without prevalent MetS, were free of known CVD (physician-diagnosed coronary heart disease and stroke) and cancer, had normal resting and exercise electrocardiograms, and were able to complete an exercise stress test to at least 85% of their age-predicted maximal heart rate. Details of the study design and population characteristics of the ACLS cohort are available in earlier reports [25, 28]. Most participants were Caucasian (>95%) and from middle to upper socioeconomic strata. The Cooper Institute Institutional Review Board approved the study protocol annually, and participants provided written consent to participate in the clinical examinations and the follow-up study.
2.2. Clinical examination
The clinical examination followed a standardized manual of operations and was performed after an overnight fast of at least 12 hours; it has been described elsewhere [25, 28]. Body mass index (BMI, kg/m2) was computed from measured height and weight. Waist girth (cm) was measured at the umbilicus. Resting blood pressure was recorded after a brief period of quiet sitting as the first and fifth Korotkof sounds [29]. Serum samples were analyzed for triglycerides, high-density lipoprotein (HDL) cholesterol, glucose, and UA using standardized automated bioassays in accord with the Centers for Disease Control and Prevention standards. Information on smoking habits (current smoker or not); alcohol intake (drinks per week); and family history of hypertension, diabetes, and premature coronary disease was obtained from a standardized medical history questionnaire. CRF was quantified as the duration of a symptom-limited maximal treadmill exercise test using a modified Balke protocol [28, 30]. Exercise duration on this protocol is highly correlated with measured maximal oxygen uptake (r > 0.90) [31, 32]. The test endpoint was volitional exhaustion or termination by the supervising physician for clinical reasons.
There is no universally-accepted definition for hyperuricemia based solely on serum UA levels. We defined participants as having hyperuricemia if their serum UA concentration was > 7.0 mg/dL(416.4 µmol/L) in men or >6.0 mg/dL (356.9 µmol/L) in women [20, 33, 34]. These cutoffs were selected because they are commonly used in clinical laboratories and have been proposed in previously-published studies in relation to CVD outcomes to define hyperuricemia. In addition, they allowed us to perform direct comparisons of the prevalence of the condition between this and previous study populations [35]. We also classified participants according to categories of UA. UA concentrations were categorized into thirds for men and women separately. The resulting three categories for men were 1) <5.5 mg/dL; 2) 5.5–6.5 mg/dL; 3) ≥6.5 mg/dL. The corresponding categories for women were 1) <3.8 mg/dL; 2) 3.8–4.6 mg/dL; 3) ≥4.6 mg/dL.
2.3. Assessment of outcomes
Participants with 3 or more of the following criteria [1, 25] were defined as having the MetS: 1) abdominal obesity (waist girth > 102 cm in men and >88 cm in women); 2) hypertriglyceridemia (≥ 150 mg/dL); 3) low HDL cholesterol (<40 mg/dL in men and <50 mg/dL in women); 4) abnormal blood pressure: high blood pressure (≥130/85 mmHg) or a history of physician-diagnosed hypertension [25, 36–38]; 5) abnormal blood glucose: high fasting glucose (≥110 mg/dL) or a history of physician-diagnosed diabetes [25, 36–38].
2.4. Statistical analysis
Participants meeting the MetS definition at any clinic examination during follow-up (mean (SD): 5.5 (4.7) years) were defined as cases. Cumulative incidence rates were computed by dividing the number of MetS cases by the population at risk for the total sample and within categories of UA according to sex. Because the exact date of MetS development is unknown, logistic regression was used to estimate sex-specific odds ratios (ORs) and 95% confidence intervals (CIs) for incident MetS according to categories of UA. First we calculated MetS risk according to hyperuricemia status, and then by thirds of the baseline UA distribution. We also calculated MetS risk across tenths of baseline UA to better illustrate the graded association between serum UA and the risk of developing MetS. Multivariable analyses were adjusted for the following covariables: baseline age (years), examination year, current smoking (yes/no), alcohol intake (≥5 drinks/wk or not), number of baseline MetS risk factors (0, 1, or 2), family history (yes/no) of diseases (hypertension, diabetes, and premature CVD), and CRF (defined by treadmill test duration (minutes)). Additional sex-specific logistic regression analyses were conducted according to strata of baseline BMI (<25 vs. ≥25 kg/m2), age groups (20 to 39, 40 to 49, vs. ≥50 years), and MetS components (0, 1 vs. 2). Tests of linear trends across exposure categories were computed using ordinal scoring. We estimated the population attributable risk (PAR) of MetS for hyperuricemia and each MetS risk factor to quantify their possible influence on MetS incidence in our population sample if they were eliminated. PAR was computed as Pc(1-1/ORadj), where Pc is the prevalence of a risk factor among MetS cases, and ORadj is the multivariable adjusted OR for MetS associated with the specified risk factor [39]. Statistical analyses were performed using SAS (version 9.1, SAS Institute, Cary, NC) software. All reported p values are two tailed, and CIs were calculated at the 95% level.
3. Results
Overall, the prevalence of hyperuricemia was 17% in this study population. Hyperuricemia was more common in men than in women (18.9% vs. 4.7%). Men with hyperuricemia, as compared to those without the condition, had lower CRF and higher prevalence of each metabolic syndrome risk factor (except glucose) at the baseline evaluation (Table 1). Women with hyperuricemia as compared with their counterparts without the condition were broadly similar in age, average risk factor values (except serum triglycerides), and average duration of treadmill test which is directly related to maximal MET levels of CRF (Table 1).
Table 1.
Baseline characteristics for women and men according to hyperuricemia† status, Aerobics Center Longitudinal Study, 1977–2003
| Men |
Women |
|||
|---|---|---|---|---|
| Hyperuricemia | Hyperuricemia | |||
| No | Yes | No | Yes | |
| (n=6,837) | (n=1,592) | (n=1,201) | (n=59) | |
| (mean (SD) or %) | (mean (SD) or %) | (mean (SD) or %) | (mean (SD) or %) | |
| Age (years) | 43.6 (9.2) | 43.5 (9.0) | 44.2 (9.3) | 44.1 (9.2) |
| 20–39 | 34.7 | 35.2 | 31.6 | 28.8 |
| 40–49 | 39.7 | 39.8 | 40.7 | 37.3 |
| ≥50 | 25.6 | 25.0 | 27.7 | 33.9 |
| Treadmill test duration (minutes) | *20.4 (4.5) | 18.7 (4.1) | 14.8 (4.2) | 14.5 (4.1) |
| Body Mass Index* (kg/m2) | 25.0 (2.6) | 26.2 (2.9) | 22.1 (3.6) | 23.1 (3.3) |
| Waist circumference (cm) | *89.8 (8.1) | 93.6 (8.2) | 70.4 (7.8) | 73.2 (11.5) |
| Lipids (mmol/L) | ||||
| HDL-C | *1.24 (0.30) | 1.19 (0.29) | 1.59 (0.34) | 1.53 (0.34) |
| Triglycerides* | 1.18 (0.71) | 1.45 (0.93) | 0.92 (0.52) | 1.10 (0.63) |
| Fasting blood glucose (mmol/L) | 5.41 (0.61) | 5.44 (0.53) | 5.19 (0.84) | 5.11 (0.63) |
| Blood pressure (mmHg) | ||||
| Systolic | *118 (12) | 119 (12) | 111 (13) | 112 (14) |
| Diastolic | *79 (9) | 80 (9) | 75 (9) | 77 (10) |
| Current smoker (%) | 14.0 | 15.1 | 7.8 | 11.9 |
| ≥ 5 Alcohol drinks per week (%) | *42.1 | 50.8 | 25.4 | 33.9 |
| Family history (%) | ||||
| Hypertension | 10.6 | 9.3 | 16.2 | 13.6 |
| Diabetes | 4.3 | 3.5 | 6.0 | 6.8 |
| Cardiovascular disease | 28.9 | 31.0 | 29.6 | 30.5 |
| Abdominal obesity‡ (%) | *5.2 | 12.4 | 2.6 | 6.8 |
| High blood pressure§ (%) | *29.3 | 35.9 | 18.4 | 22.0 |
| High triglycerides# (%) | *13.6 | 23.9 | 6.3 | 11.9 |
| High glucose** (%) | 7.0 | 7.6 | 3.8 | 3.4 |
| Low HDL-C†† (%) | *22.9 | 27.4 | 15.8 | 15.3 |
| No. of metabolic syndrome factors (%) | ||||
| 0 | *42.5 | 27.1 | 61.2 | 55.9 |
| 1 | *36.9 | 38.6 | 30.6 | 28.8 |
| 2 | *20.6 | 34.3 | 8.2 | 15.3 |
| Serum uric acid level* (mg/dL) | 5.6 (0.9) | 7.8 (0.7) | 4.1 (0.9) | 6.6 (0.5) |
| (µmol/L) | (355.6 (52.3)) | (463.1 (39.8)) | (244.5 (54.2)) | (391.2 (26.9)) |
Abbreviations: UA, uric acid; HDL- C, high density lipoprotein cholesterol.
Difference between normal and high uric acid was statistically significant (p<0.05).
Hyperuricemia was defined as as >7.0 mg/dL in men and >6.0 mg/dL in women.
Abdominal obesity was defined as waist girth ≥102 cm [40 in] in men and ≥88 cm [35 in] in women)
High blood pressure was defined as systolic blood pressure≥130 mm Hg, diastolic blood pressure ≥85 mm Hg, or history of physician-diagnosed hypertension
High triglycerides was defined as triglycerides ≥1.69 mmol/L (150 mg/dL)
High glucose was defined as glucose ≥6.1 mmol/L (110 mg/dL) or history of physician-diagnosed diabetes
Low HDL-C was defined as HDL <1.04 mmol/L (40 mg/dL) in men and <1.3 mmol/L (50 mg/dL) in women
A total of 1,120 men and 44 women developed MetS during a mean follow-up of 5.5 years (median: 4 years; range: 0–30 years), which resulted in a 13.3% and 3.5% cumulative incidence MetS in men and women, respectively. We observed a steep positive gradient for incidence of MetS across thirds of UA in men and women (p<0.001 for each) (Fig. 1.). Multivariable logistic regression was used to quantify the strength of association between UA and incident MetS after controlling for potential confounding influences (Table 2). Men in the middle and upper thirds of UA, respectively, had 35% and 60% higher relative odds of developing MetS when compared with men in the lowest third (ptrend<0.001). In women, the adjusted risk of MetS was 29% lower and over 2-fold higher among those in the middle and upper thirds of UA categories, respectively, compared with women in the lowest third (ptrend=0.02). Across incremental tenths of baseline UA, the multivariable-adjusted ORs of MetS were 1.00 (referent), 1.18 (95% CI: 0.80, 1.74), 1.34 (95% CI: 0.92, 1.97), 1.17 (95% CI: 0.80, 1.70), 1.47 (95% CI: 1.02, 2.12), 1.34 (95% CI: 0.93, 1.92), 1.88 (95% CI: 1.33, 2.66), 1.56 (95% CI: 1.10, 2.20), 2.00 (95% CI: 1.42, 2.82), 1.96 (95% CI: 1.41, 2.74) in men, p for trend <0.001. There were not enough events in women to perform this analysis.
Fig. 1.
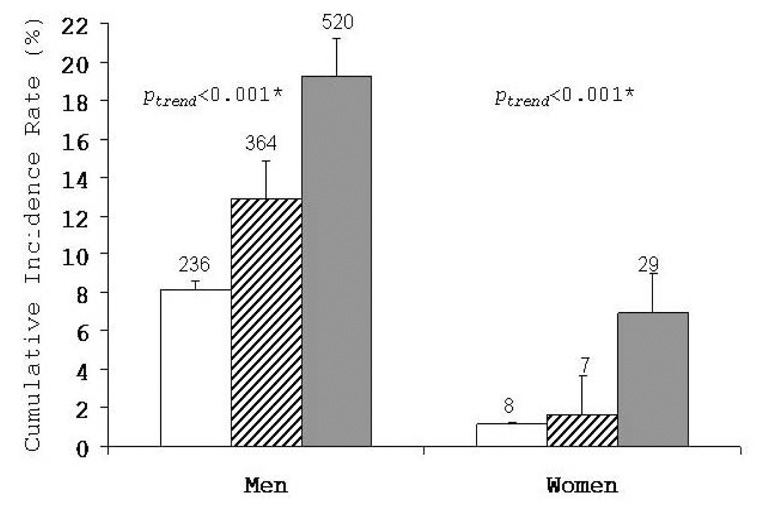
Cumulative incidence of metabolic syndrome by thirds of uric acid in men and women, Aerobics Center Longitudinal Study, 1977–2003. The 95% confidence intervals are shown. White bars represent the lower third; striped bars, the middle third; and grey bars, the upper third of baseline serum uric acid. The number of cases is shown above the bars. Number at risk in lower, middle, and upper thirds of serum uric acid was 2,897, 2,827, and 2,705 in men and 418, 424, and 418 in women, respectively. *adjusted for age and examination year.
Table 2.
Odds ratios and 95% confidence intervals for metabolic syndrome according to thirds of serum uric acid and categories of other predictors, Aerobics Center Longitudinal Study, 1977–2003
| Serum Uric Acid Thirds |
||||||||
|---|---|---|---|---|---|---|---|---|
| N | Cases | Lower third | Middle third |
Upper third |
Linear Trend p | |||
| OR | 95% CI | OR | 95% CI | |||||
| Men | ||||||||
| Total* | 8,429 | 1,120 | 1.0 (Referent) | 1.35 | 1.12, 1.61 | 1.60 | 1.34, 1.91 | <0.001 |
| Body mass index (kg/m2)† | ||||||||
| <25 | 4,256 | 311 | 1.0 (Referent) | 1.45 | 1.07, 1.96 | 1.88 | 1.38, 2.56 | <0.001 |
| ≥25 | 4,173 | 809 | 1.0 (Referent) | 1.30 | 1.04, 1.63 | 1.58 | 1.28, 1.96 | <0.001 |
| Age (years)‡ | ||||||||
| 20–39 | 2,935 | 326 | 1.0 (Referent) | 1.45 | 1.04, 2.03 | 1.54 | 1.10, 2.14 | 0.02 |
| 40–49 | 3,347 | 496 | 1.0 (Referent) | 1.12 | 0.84, 1.48 | 1.50 | 1.14, 1.96 | 0.002 |
| ≥50 | 2,147 | 298 | 1.0 (Referent) | 1.62 | 1.14, 2.28 | 1.80 | 1.28, 2.54 | 0.001 |
| Metabolic syndrome risk factors at baseline§ | ||||||||
| 0 | 3,336 | 154 | 1.0 (Referent) | 1.17 | 0.78, 1.76 | 1.53 | 1.01, 2.31 | 0.045 |
| 1 | 3,139 | 387 | 1.0 (Referent) | 1.49 | 1.11, 1.99 | 1.78 | 1.34, 2.38 | <0.001 |
| 2 | 1,954 | 579 | 1.0 (Referent) | 1.28 | 0.96, 1.70 | 1.51 | 1.15, 1.98 | 0.003 |
| Women | ||||||||
| Total* | 1,260 | 44 | 1.0 (Referent) | 0.71 | 0.25, 2.05 | 2.29 | 1.00, 5.27 | 0.02 |
| Body mass index (kg/m2)† | ||||||||
| <25 | 1,088 | 25 | 1.0 (Referent) | 0.41 | 0.10, 1.61 | 1.95 | 0.75, 5.05 | 0.10 |
| ≥25 | 172 | 19 | 1.0 (Referent) | 2.56 | 0.26, 25.12 | 4.37 | 0.52, 36.53 | 0.12 |
| Age (years)‡ | ||||||||
| 20–39 | 396 | 11 | 1.0 (Referent) | 2.82 | 0.26, 30.19 | 5.12 | 0.57, 46.07 | 0.12 |
| 40–49 | 511 | 13 | 1.0 (Referent) | 1.25 | 0.19, 8.29 | 3.14 | 0.61, 16.08 | 0.12 |
| ≥50 | 353 | 20 | 1.0 (Referent) | 0.13 | 0.01, 1.16 | 1.16 | 0.36, 3.75 | 0.39 |
| Metabolic syndrome risk factors at baseline§ | ||||||||
| 0 | 768 | 12 | 1.0 (Referent) | 0.35 | 0.03, 4.23 | 3.53 | 0.71, 17.46 | 0.04 |
| 1 | 385 | 15 | 1.0 (Referent) | 1.06 | 0.22, 5.19 | 1.64 | 0.40, 6.82 | 0.44 |
| 2 | 107 | 17 | 1.0 (Referent) | 0.43 | 0.06, 3.02 | 1.23 | 0.27, 5.62 | 0.52 |
Abbreviations: OR, odds ratios; CI, confidence interval.
The ORs for the total sample of women and men are adjusted for age, examination year, body mass index, current smoking, alcohol intake, number of baseline metabolic risk factors, family history of disease, and treadmill test duration.
The ORs within strata of body mass index are adjusted for age, examination year, current smoking, alcohol intake, number of baseline metabolic risk factors, family history of disease, and treadmill test duration.
The ORs within strata of age are adjusted for examination year, body mass index, current smoking, alcohol intake, number of baseline metabolic risk factors, family history of disease, and treadmill test duration.
The ORs within strata of baseline metabolic syndrome risk factors are adjusted for age, examination year, body mass index, current smoking, alcohol intake, family history of disease, and treadmill test duration.
We next examined potential modifying effects of selected variables on the UA-MetS association according to strata of BMI, age, and number of MetS components at baseline (Table 2). In men, regardless of BMI, age, or number of MetS risk factors, the risk of developing MetS was significantly higher across UA thirds, relative to the lowest third in multivariable-adjusted models (Table 2; p for trend, <0.05 each). Similar patterns of association were seen in women, but a significant trend was observed only for those without baseline MetS components (p=0.04).
Table 3 shows the relative importance of hyperuricemia and MetS risk factors in terms of population risks. After adjustment for age, examination year, smoking, treadmill test duration, and each risk factor in the table, hyperuricemia was significantly associated with incident MetS in men but not women. To place the risk of MetS for each exposure in the context of population-disease burden, we estimated PAR based on the baseline prevalence and strength of association with MetS for each exposure. Therefore, if the serum UA level had been normal in all individuals in our study group, we might expect that there would have been 10% fewer cases in the men and 4% fewer in the women. However the PAR for women is not statistically significant, perhaps due to low statistical power because of the small number of cases.
Table 3.
Odds ratios and population attributable risk of incident metabolic syndrome for hyperuricemia and each metabolic syndrome risk factor among men and women, Aerobics Center Longitudinal Study, 1977–2003
| Men |
Women |
|||||||
|---|---|---|---|---|---|---|---|---|
| Baseline Prevalence, %* | OR† | 95% CI† | PAR, %‡ | Baseline Prevalence, %* | OR† | 95% CI† | PAR, %‡ | |
| Hyperuricemia | 18.9 | 1.49 | 1.28, 1.74 | 10.0 | 4.7 | 1.66 | 0.54, 5.08 | 3.6 |
| Abdominal obesity | 6.6 | 4.36 | 3.52, 5.41 | 12.6 | 2.8 | 3.84 | 1.27, 11.62 | 8.4 |
| High blood pressure | 30.6 | 1.94 | 1.67, 2.25 | 17.7 | 18.6 | 2.49 | 1.27, 4.89 | 10.7 |
| High glucose | 15.5 | 3.22 | 2.75, 3.76 | 23.2 | 6.6 | 3.13 | 1.36, 7.17 | 14.0 |
| High triglycerides | 7.1 | 1.89 | 1.49, 2.40 | 4.2 | 3.8 | 3.09 | 1.00, 9.62 | 6.2 |
| Low HDL | 23.8 | 2.89 | 2.49, 3.36 | 27.7 | 15.8 | 3.15 | 1.58, 6.24 | 23.3 |
Abbreviations: OR, odds ratio; CI, confidence interval; PAR, population attributable risk.
Prevalence of hyperuricemia in the overall sample for women (>6.0 mg/dL) and men (>7.0 mg/dL)
Adjusted for age, examination year, current smoking, treadmill test duration, and each of the other variables in the table
Computed as Pc(1-1/ORadj), where Pc is the prevalence of the risk factor among metabolic syndrome cases, and ORadj is the multivariable adjusted OR for metabolic syndrome associated with the specified risk factor. Pc (ordered as listed in the table) was 30.5, 16.4, 36.5, 33.7, 8.9, and 42.4 in men and 9.1, 11.4, 17.9, 20.5, 9.1, and 34.1 in women.
4. Discussion
In this prospective study over 5.7 years, higher serum UA level was positively and significantly associated with higher risk of incident MetS in initially MetS free and healthy middle-aged men and women. This association was independent of baseline age, BMI, smoking, drinking, family history of disease, treadmill test duration, and number of MetS components. These results demonstrate that serum UA level is a strong marker of the risk for developing MetS.
The 17% prevalence of hyperuricemia noted among ACLS men and women in our study is higher than estimates reported for some populations (8.4% among Saudi adults [40]; 10.6% among Thai adults [20]), but lower than estimates reported for other populations (24.4% among Japanese adults [33]; 30.6% among Taiwanese adults [18]) using the same hyperuricemia definition.
UA concentrations have long been related to individual components of the MetS [11–17]. Because of the clustering effect with MetS risk factors [11–17] and the positive association with future development of CVD [41, 42], researchers have debated whether hyperuricemia should be included as an additional MetS component [13, 43, 44]. However, it was not included as one of the MetS diagnostic criteria by the National Cholesterol Education Program Adult Treatment Panel III definition (NCEP ATP III), which has been widely adopted [4]. In the current study, we found that men with hyperuricemia, although not meeting criteria for MetS at baseline, actually expressed more of the features already. Our results showed that 72.9% of hyperuricemic men had more than one MetS factor which provides further evidence that serum UA levels could be included in the definition of MetS, as other large epidemiologic studies have suggested [13, 43, 44]. Some investigators have proposed that UA may be one of the most under-recognized CVD risk factors, and that studies are needed to further evaluate its relevance for CVD [45, 46]. In fact, information is scarce on the determinants of serum UA with respect to its link to the MetS [19–21]. Choi et al [21] found that the prevalence of the MetS was incrementally higher across levels of serum UA in a nationally representative sample of US adults-the NHANES III. Lohsoonthorn and colleagues [20] conducted a study with 1,381 patients from a preventive medicine clinic in Thailand and reported that serum UA was positively associated with MetS presence. Individuals with serum UA concentrations in the upper fourth had 3.9-fold and 2-fold higher risks of MetS for men and women, respectively, as compared with those who had concentrations in the lowest fourth [20]. Researchers in Turkey [19] also observed an independent cross-sectional relationship between serum UA and MetS in which women and men in the top 10% of UA had roughly 2-fold higher risk for MetS as compared with the bottom 10% [19]. These cross-sectional studies from different population samples established an association between serum UA and prevalence of MetS. However, because of their cross-sectional nature with regard to the assessment of MetS risk, a temporal effect between UA and MetS can not be shown by these data.
To fully determine the causal relationship between serum UA and the development of MetS, evidence from prospective studies needs to be evaluated. To the best of our knowledge, there is only one study [22] in the current literature that reported the direct association between baseline serum UA and incident MetS. Our findings are consistent with that cohort of Korean men followed for 3 years [22]. In that study, baseline UA was associated higher risk of MetS. A 1.6-fold higher risk for MetS was observed in men with serum UA levels in the highest compared with the lowest fifth [22]. The current study extends existing data by demonstrating that higher levels of serum UA are associated with risk of MetS in women and in men across a broad age range. More longitudinal studies are needed to confirm our observations in other population samples.
A consistent positive gradient between MetS and UA within age strata (20 to >50 years), BMI (normal weight and overweight/obese), and number of MetS risk factors at baseline (0, 1 or 2) was noted in men. Strong positive gradients of MetS across UA levels in normal weight and overweight/obese men are consistent with data from NHANES III indicating that the association between UA and MetS was independent of BMI [21]. The association between UA and MetS was not significant in women when evaluated among most of the covariables strata. This was probably due to low statistical power resulting from the small number of cases in women. Additional data to evaluate the association between serum UA level and MetS incidence are needed in women, in older adults (age ≥60 years), and in individuals with different levels of physical activity or fitness.
The specific biologic mechanisms by which higher serum UA increases the risk of developing MetS remain unclear. Recently, researchers have linked fructose intake to MetS [47]. Nakagawa et al [48] found that lowering UA in fructose-fed rats improves components of the MetS, including a reduction in blood pressure, serum triglycerides, hyperinsulinemia, and weight gain, which suggested that UA had a causal role in the MetS that was induced by fructose in animal models. Intake of fructose- and purine-rich foods, which has increased noticeably in the past few decades and correlates with the rising rates of MetS, can raise UA levels and may play a role in the epidemic of MetS that is occurring around the globe [47]. The fact that serum UA levels can indicate deranged renal function needs to be considered when interpreting these results since altered renal function is an independent predictor of CVD outcomes [8–10].
We computed PAR values to estimate the burden of MetS attributable to hyperuricemia and other risk predictors. If all individuals with hyperuricemia in our population sample had normal UA, the incidence of MetS might have been 10% and 3.6% lower in men and women, respectively. Currently, there is not enough data to determine how much of the MetS disease burden may be due to hyperuricemia. These findings from the ACLS cohort suggest that assessing and possibly reducing population serum UA levels should be given consideration for primary prevention and for lowering the disease burden of MetS through lifestyle changes such as eating less meat, decreasing alcohol intake, and reducing food additive fructose intake.
Strengths of the current study include the longitudinal design, reliable assessment of incident MetS, and detailed adjustment for potential confounders such as alcohol intake, an objective indicator of physical activity habits, and the number MetS components at baseline. A limitation is the homogeneity of our population sample; however, the homogeneity of the cohort in terms of sociodemographic characteristics enhances the internal validity of our findings by reducing confounding by these factors. We did not have sufficient information on renal function (creatinine or glomerual filtration rate), medication usage, menopausal status, or dietary habits to include them in our analysis. In particular, elevated levels of serum UA may be related to increased dietary intake of purines. Therefore, our findings should be generalized carefully to other adult populations. It is possible that residual confounding by these factors may exist, although it seems unlikely that they would account for all of the observed association between serum UA and MetS. In this cohort we had only a single baseline assessment of serum UA; thus, we could not examine whether changes in UA occurred during follow-up and whether these changes may have influence the study results. Future prospective cohort studies in representative population samples should ideally include such information to expand on the findings reported here.
In conclusion, we found a positive, significant association between serum UA and the risk of developing MetS in middle-aged and older women and men. Even after adjustment for age, alcohol intake, CRF, and the number of MetS risk factors at baseline, the association between serum UA levels and MetS persisted. Further research is needed about the role of UA in the pathogenesis of MetS and the impact of lowering UA on MetS incidence and its clinical endpoints such as all-cause and CVD mortality.
ACKNOWLEDGEMENTS
Supported by National Institute of Health grants AG06945 and HL62508.
We thank the Cooper Clinic physicians and technicians for collecting the baseline data, staff at the Cooper Institute for data entry and data management, and Gaye Christmus for editorial assistance.
Footnotes
Publisher's Disclaimer: This is a PDF file of an unedited manuscript that has been accepted for publication. As a service to our customers we are providing this early version of the manuscript. The manuscript will undergo copyediting, typesetting, and review of the resulting proof before it is published in its final citable form. Please note that during the production process errors may be discovered which could affect the content, and all legal disclaimers that apply to the journal pertain.
Financial Disclosures: None declared.
References
- 1.Grundy SM, Brewer HB, Jr, Cleeman JI, et al. Definition of metabolic syndrome: Report of the National Heart, Lung, and Blood Institute/American Heart Association conference on scientific issues related to definition. Circulation. 2004;109:433–438. doi: 10.1161/01.CIR.0000111245.75752.C6. [DOI] [PubMed] [Google Scholar]
- 2.Ford ES, Giles WH, Dietz WH. Prevalence of the metabolic syndrome among US adults: findings from the third National Health and Nutrition Examination Survey. Journal of the American Medical Association. 2002;287:356–359. doi: 10.1001/jama.287.3.356. [DOI] [PubMed] [Google Scholar]
- 3.Ford ES, Giles WH, Mokdad AH. Increasing prevalence of the metabolic syndrome among u.s. Adults. Diabetes Care. 2004;27:2444–2449. doi: 10.2337/diacare.27.10.2444. [DOI] [PubMed] [Google Scholar]
- 4.Grundy SM, Cleeman JI, Daniels SR, et al. Diagnosis and management of the metabolic syndrome. An American Heart Association/National Heart, Lung, and Blood Institute Scientific Statement. Executive summary. Cardiol Rev. 2005;13:322–327. [PubMed] [Google Scholar]
- 5.Wilson PW, D'Agostino RB, Parise H, et al. Metabolic syndrome as a precursor of cardiovascular disease and type 2 diabetes mellitus. Circulation. 2005;112:3066–3072. doi: 10.1161/CIRCULATIONAHA.105.539528. [DOI] [PubMed] [Google Scholar]
- 6.Grundy SM, Hansen B, Smith SC, Jr, et al. Clinical management of metabolic syndrome: report of the American Heart Association/National Heart, Lung, and Blood Institute/American Diabetes Association conference on scientific issues related to management. Circulation. 2004;109:551–556. doi: 10.1161/01.CIR.0000112379.88385.67. [DOI] [PubMed] [Google Scholar]
- 7.Mora S, Rifai N, Buring JE, et al. Additive value of immunoassay-measured fibrinogen and high-sensitivity C-reactive protein levels for predicting incident cardiovascular events. Circulation. 2006;114:381–387. doi: 10.1161/CIRCULATIONAHA.106.634089. [DOI] [PubMed] [Google Scholar]
- 8.Ruilope LM, Garcia-Puig J. Hyperuricemia and renal function. Curr.Hypertens.Rep. 2001;3:197–202. doi: 10.1007/s11906-001-0038-2. [DOI] [PubMed] [Google Scholar]
- 9.Chien KL, Hsu HC, Sung FC, et al. Hyperuricemia as a risk factor on cardiovascular events in Taiwan: The Chin-Shan Community Cardiovascular Cohort Study. Atherosclerosis. 2005;183:147–155. doi: 10.1016/j.atherosclerosis.2005.01.018. [DOI] [PubMed] [Google Scholar]
- 10.Baker JF, Krishnan E, Chen L, et al. Serum uric acid and cardiovascular disease: recent developments, and where do they leave us? Am J Med. 2005;118:816–826. doi: 10.1016/j.amjmed.2005.03.043. [DOI] [PubMed] [Google Scholar]
- 11.Perlstein TS, Gumieniak O, Williams GH, et al. Uric acid and the development of hypertension: the normative aging study. Hypertension. 2006;48:1031–1036. doi: 10.1161/01.HYP.0000248752.08807.4c. [DOI] [PubMed] [Google Scholar]
- 12.Nakanishi N, Okamoto M, Yoshida H, et al. Serum uric acid and risk for development of hypertension and impaired fasting glucose or Type II diabetes in Japanese male office workers. Eur J Epidemiol. 2003;18:523–530. doi: 10.1023/a:1024600905574. [DOI] [PubMed] [Google Scholar]
- 13.Tsouli SG, Liberopoulos EN, Mikhailidis DP, et al. Elevated serum uric acid levels in metabolic syndrome: an active component or an innocent bystander? Metabolism. 2006;55:1293–1301. doi: 10.1016/j.metabol.2006.05.013. [DOI] [PubMed] [Google Scholar]
- 14.Schmidt MI, Watson RL, Duncan BB, et al. Clustering of dyslipidemia, hyperuricemia, diabetes, and hypertension and its association with fasting insulin and central and overall obesity in a general population. Atherosclerosis Risk in Communities Study Investigators. Metabolism. 1996;45:699–706. doi: 10.1016/s0026-0495(96)90134-1. [DOI] [PubMed] [Google Scholar]
- 15.Yoo TW, Sung KC, Shin HS, et al. Relationship between serum uric acid concentration and insulin resistance and metabolic syndrome. Circ.J. 2005;69:928–933. doi: 10.1253/circj.69.928. [DOI] [PubMed] [Google Scholar]
- 16.Conen D, Wietlisbach V, Bovet P, et al. Prevalence of hyperuricemia and relation of serum uric acid with cardiovascular risk factors in a developing country. BMC Public Health. 2004;4:9. doi: 10.1186/1471-2458-4-9. [DOI] [PMC free article] [PubMed] [Google Scholar]
- 17.Vuorinen-Markkola H, Yki-Jarvinen H. Hyperuricemia and insulin resistance. Journal of Clinical Endocrinology and Metabolism. 1994;78:25–29. doi: 10.1210/jcem.78.1.8288709. [DOI] [PubMed] [Google Scholar]
- 18.Lin SD, Tsai DH, Hsu SR. Association between serum uric acid level and components of the metabolic syndrome. J Chin Med Assoc. 2006;69:512–516. doi: 10.1016/S1726-4901(09)70320-X. [DOI] [PubMed] [Google Scholar]
- 19.Onat A, Uyarel H, Hergenc G, et al. Serum uric acid is a determinant of metabolic syndrome in a population-based study. Am J Hypertens. 2006;19:1055–1062. doi: 10.1016/j.amjhyper.2006.02.014. [DOI] [PubMed] [Google Scholar]
- 20.Lohsoonthorn V, Dhanamun B, Williams MA. Prevalence of hyperuricemia and its relationship with metabolic syndrome in Thai adults receiving annual health exams. Arch Med Res. 2006;37:883–889. doi: 10.1016/j.arcmed.2006.03.008. [DOI] [PubMed] [Google Scholar]
- 21.Choi HK, Ford ES. Prevalence of the metabolic syndrome in individuals with hyperuricemia. American Journal of Medicine. 2007;120:442–447. doi: 10.1016/j.amjmed.2006.06.040. [DOI] [PubMed] [Google Scholar]
- 22.Ryu S, Song J, Choi BY, et al. Incidence and risk factors for metabolic syndrome in Korean male workers, ages 30 to 39. Annals of Epidemiology. 2007;17:245–252. doi: 10.1016/j.annepidem.2006.10.001. [DOI] [PubMed] [Google Scholar]
- 23.Jurca R, LaMonte MJ, Church TS, et al. Associations of muscle strength and aerobic fitness with metabolic syndrome in men. Medicine and Science in Sports and Exercise. 2004;36:1301–1307. doi: 10.1249/01.mss.0000135780.88930.a9. [DOI] [PubMed] [Google Scholar]
- 24.Farrell SW, Cheng YJ, Blair SN. Prevalence of the Metabolic Syndrome across Cardiorespiratory Fitness Levels in Women. Obes Res. 2004;12:824–830. doi: 10.1038/oby.2004.99. [DOI] [PubMed] [Google Scholar]
- 25.LaMonte MJ, Barlow CE, Jurca R, et al. Cardiorespiratory fitness is inversely associated with the incidence of metabolic syndrome: a prospective study of men and women. Circulation. 2005;112:505–512. doi: 10.1161/CIRCULATIONAHA.104.503805. [DOI] [PubMed] [Google Scholar]
- 26.Zachau-Christiansen B. The rise in the serum uric acid during muscular exercise. Scand J Clin Lab Invest. 1959;11:57–60. doi: 10.3109/00365515909060408. [DOI] [PubMed] [Google Scholar]
- 27.Zoppini G, Targher G, Zamboni C, et al. Effects of moderate-intensity exercise training on plasma biomarkers of inflammation and endothelial dysfunction in older patients with type 2 diabetes. Nutr Metab Cardiovasc.Dis. 2006;16:543–549. doi: 10.1016/j.numecd.2005.09.004. [DOI] [PubMed] [Google Scholar]
- 28.Blair SN, Kohl HW, III, Paffenbarger RS, Jr, et al. Physical fitness and all-cause mortality: a prospective study of healthy men and women. Journal of the American Medical Association. 1989;262:2395–2401. doi: 10.1001/jama.262.17.2395. [DOI] [PubMed] [Google Scholar]
- 29.Pickering TG, Hall JE, Appel LJ, et al. Recommendations for blood pressure measurement in humans and experimental animals: Part 1: blood pressure measurement in humans: a statement for professionals from the Subcommittee of Professional and Public Education of the American Heart Association Council on High Blood Pressure Research. Hypertension. 2005;45:142–161. doi: 10.1161/01.HYP.0000150859.47929.8e. [DOI] [PubMed] [Google Scholar]
- 30.Balke B, Ware RW. An experimental study of physical fitness in Air Force personnel. US Armed Forces Medical Journal. 1959;10:675–688. [PubMed] [Google Scholar]
- 31.Pollock ML, Bohannon RL, Cooper KH, et al. A comparative analysis of four protocols for maximal treadmill stress testing. American Heart Journal. 1976;92:39–46. doi: 10.1016/s0002-8703(76)80401-2. [DOI] [PubMed] [Google Scholar]
- 32.Pollock ML, Foster C, Schmidt D, et al. Comparative analysis of physiologic responses to three different maximal graded exercise test protocols in healthy women. American Heart Journal. 1982;103:363–373. doi: 10.1016/0002-8703(82)90275-7. [DOI] [PubMed] [Google Scholar]
- 33.Nagahama K, Iseki K, Inoue T, Touma T, et al. Hyperuricemia and cardiovascular risk factor clustering in a screened cohort in Okinawa, Japan. Hypertens.Res. 2004;27:227–233. doi: 10.1291/hypres.27.227. [DOI] [PubMed] [Google Scholar]
- 34.Hochberg M, et al. Rheumatology. New York: Mosby; 2003. [Google Scholar]
- 35.Krishnan E, Kwoh CK, Schumacher HR, et al. Hyperuricemia and incidence of hypertension among men without metabolic syndrome. Hypertension. 2007;49:298–303. doi: 10.1161/01.HYP.0000254480.64564.b6. [DOI] [PubMed] [Google Scholar]
- 36.Lakka HM, Laaksonen DE, Lakka TA, et al. The metabolic syndrome and total and cardiovascular disease mortality in middle-aged men. Journal of the American Medical Association. 2002;288:2709–2716. doi: 10.1001/jama.288.21.2709. [DOI] [PubMed] [Google Scholar]
- 37.Carnethon MR, Gidding SS, Nehgme R, et al. Cardiorespiratory fitness in young adulthood and the development of cardiovascular disease risk factors. Journal of the American Medical Association. 2003;290:3092–3100. doi: 10.1001/jama.290.23.3092. [DOI] [PubMed] [Google Scholar]
- 38.Palaniappan L, Carnethon MR, Wang Y, et al. Predictors of the incident metabolic syndrome in adults: the Insulin Resistance Atherosclerosis Study. Diabetes Care. 2004;27:788–793. doi: 10.2337/diacare.27.3.788. [DOI] [PubMed] [Google Scholar]
- 39.Rothman KJ, Greenland S. Modern epidemiology. Philadelphia, PA: Lippincott-Raven Publishers; 1998. [Google Scholar]
- 40.Al-Arfaj AS. Hyperuricemia in Saudi Arabia. Rheumatol.Int. 2001;20:61–64. doi: 10.1007/s002960000076. [DOI] [PubMed] [Google Scholar]
- 41.Niskanen LK, Laaksonen DE, Nyyssonen K, et al. Uric acid level as a risk factor for cardiovascular and all-cause mortality in middle-aged men: a prospective cohort study. Archives of Internal Medicine. 2004;164:1546–1551. doi: 10.1001/archinte.164.14.1546. [DOI] [PubMed] [Google Scholar]
- 42.Lehto S, Niskanen L, Ronnemaa T, et al. Serum uric acid is a strong predictor of stroke in patients with non-insulin-dependent diabetes mellitus. Stroke. 1998;29:635–639. doi: 10.1161/01.str.29.3.635. [DOI] [PubMed] [Google Scholar]
- 43.Liou TL, Lin MW, Hsiao LC, et al. Is hyperuricemia another facet of the metabolic syndrome? J Chin Med Assoc. 2006;69:104–109. doi: 10.1016/S1726-4901(09)70186-8. [DOI] [PubMed] [Google Scholar]
- 44.Sheu WH, Tseng YH. Uric acid: an additional component of metabolic syndrome? J Chin Med Assoc. 2006;69:99–100. doi: 10.1016/S1726-4901(09)70184-4. [DOI] [PubMed] [Google Scholar]
- 45.The role of uric acid in hypertension, renal disease and the metabolic syndrome. Cardiovasc.J S Afr. 2005;16:12–13. [Google Scholar]
- 46.Heinig M, Johnson RJ. Role of uric acid in hypertension, renal disease, and metabolic syndrome. Cleve.Clin J Med. 2006;73:1059–1064. doi: 10.3949/ccjm.73.12.1059. [DOI] [PubMed] [Google Scholar]
- 47.Cirillo P, Sato W, Reungjui S, et al. Uric Acid, the metabolic syndrome, and renal disease. J Am Soc Nephrol. 2006;17:S165–S168. doi: 10.1681/ASN.2006080909. [DOI] [PubMed] [Google Scholar]
- 48.Nakagawa T, Hu H, Zharikov S, et al. A causal role for uric acid in fructose-induced metabolic syndrome. Am J Physiol Renal Physiol. 2006;290:F625–F631. doi: 10.1152/ajprenal.00140.2005. [DOI] [PubMed] [Google Scholar]