Abstract
Hepatic endothelial fenestrae are dynamic structures that act as a sieving barrier to control the extensive exchange of material between the blood and the liver parenchyma. Alterations in the number or diameter of fenestrae by drugs, hormones, toxins, and diseases can produce serious perturbations in liver function. Previous studies have shown that disassembly of actin by cytochalasin B or latrunculin A caused a remarkable increase in the number of fenestrae and established the importance of the actin cytoskeleton in the numerical dynamics of fenestrae. So far, however, no mechanism or structure has been described to explain the increase in the number of fenestrae. Using the new actin inhibitor misakinolide, we observed a new structure that appears to serve as a fenestrae-forming center in hepatic endothelial cells.
Liver sinusoids are unique capillaries, lined by endothelium expressing open fenestrae without a diaphragm and lacking an underlying basal lamina (1). The fenestrae are dynamic structures, clustered in sieve plates that control the exchange of fluids, solutes, and macromolecules between the sinusoid and the space of Disse (2). They play a central role in the selection and subsequent hepatic metabolism of lipoproteins, such as chylomicron (remnants), containing lipids, dietary cholesterol, and fat-soluble vitamin A (3). The porosity of the endothelial lining, i.e., the accumulated surface of fenestrae, measures ≈10% and shows a lobular gradient together with the number and size of fenestrae (2). Drugs, toxins, and diseases have an effect on these parameters. Defenestration occurs early in liver cancer (4), in the pathogenesis of cirrhosis (5), and in chronic alcohol abuse, resulting in alcoholism-associated hyperlipoproteinemia (6).
In vitro studies have established the involvement of the actin cytoskeleton in the regulation of the number and size of fenestrae (7, 8). Each of the fenestrae is surrounded by a fenestrae-associated cytoskeleton ring (8). Contractile bundles of actin and myosin around fenestrae seem to regulate fenestrae diameter under the control of intracellular calcium levels (9). Cytochalasin B, a widely used fungal metabolite disrupting actin filaments by complex mechanisms (10, 11) and latrunculin A, a marine sponge-derived macrolide disassembling actin filaments by sequestration of actin monomers (12, 13), both induce a substantial and rapid increase in fenestrae number (14, 15). These data indicate that fenestrae are inducible structures and that the organization of actin plays an important role in their numerical dynamics. However, the mechanism responsible for fenestrae formation remains elusive.
To further investigate the process by which actin disruption generates new fenestrae, we used three novel compounds derived from marine sponges that possess specific actin-binding properties. Misakinolide and swinholide A are structurally comparable dimeric macrolides that bind to two actin monomers, at the same time having different binding properties to actin filaments. Swinholide A severs actin filaments, whereas misakinolide caps the barbed ends (16, 17). Jasplakinolide is a macrocyclic peptide that induces actin polymerization and stabilizes actin filaments in vitro (18).
We investigated the effects of these new actin-binding agents on rat liver sinusoidal endothelial cell (LSEC) fenestrae and actin organization by using fluorescence microscopy, scanning electron microscopy (SEM) and whole-mount transmission electron microscopy (TEM). We report here that these three agents disrupt actin organization in LSEC, significantly increase the number of fenestrae and that treatment with misakinolide reveals a new structure that may serve as a fenestrae-forming center.
MATERIALS AND METHODS
Isolation, Purification, and Culture of Rat LSECs.
The method for the isolation of LSECs has been described earlier (19), and was based on a modification of the method by Smedsrød et al. (20). In brief, the liver of a male Wistar rat was perfused with collagenase A (Boehringer Mannheim, catalogue no. 1088793). After incubation of the fragmented tissue in the same solution, the resulting cell suspension was centrifuged at 100 × g for 5 min to remove the parenchymal cells. The supernatant, containing a mixture of sinusoidal liver cells, was then layered on top of a two-step Percoll gradient (25–50%) and centrifuged for 20 min at 900 × g. The intermediate zone, located between the two density layers was enriched in LSECs. LSEC purity was further enhanced by selective adherence of Kupffer cells and spreading of the LSECs on collagen. LSECs were further cultivated in 24-multiwell plates on collagen-coated thermanox coverslips for SEM. For TEM, LSECs were cultivated on collagen-coated nickel grids (300 mesh) instead of coverslips (8). Formvar (1%) supporting films on nickel grids (300 mesh) were used and later coated with diluted collagen. Ten microliters of collagen-S stock solution (Boehringer Mannheim, catalogue no. 1098292), was diluted with 900 μl of sterile water. Serum free LSEC culture medium consisted of RPMI-1640 with 2 mM l-glutamine, 100 units/ml penicillin, 100 mg/ml streptomycin, and 10 ng/ml endothelial cell growth factor (ECGF, Boehringer Mannheim, catalogue no. 1074016).
The cultures were estimated to have >95% purity, since <5% of the cells examined by SEM and TEM were devoid of fenestrae.
Treatment of LSEC with Misakinolide, Swinholide A, and Jasplakinolide.
LSECs were cultured for 8 hr and were treated with 5, 10, 25, and 100 nM misakinolide, swinholide A, or jasplakinolide for 10, 60, 120, 180, and 240 min. The compounds were dissolved in dimethyl sulfoxide (DMSO), and the DMSO concentration in the assays were in all cases ≤ 0.05% and had no effect on the ultrastructure and viability of LSECs as determined by the trypan blue and propidium iodide test. Control media also contained DMSO in the same amount as the treated LSECs and were incubated in serum-free endothelial cell culture medium without the compounds. After incubation, LSECs were prepared for fluorescence microscopy, SEM, and whole-mount TEM as described below.
Misakinolide and Swinholide A were purified respectively from an Okinawan Theonella sp. sponge (21) and the marine sponge Theonella swinhoei (22), and used according to the protocol of Bubb et al. (16) and Terry et al. (17). Jasplakinolide was isolated from the marine sponge Jaspis johnstoni (23) and used as described (18).
Fluorescence Microscopy.
To visualize filamentous actin, LSEC grown on coverslips were rinsed twice with PBS at pH 7.4, followed by fixation with freshly prepared 4% formaldehyde in PBS for 1 min at 21°C. After fixation, LSECs were submerged in absolute acetone for 5 min at −20°C. After this permeabilization, rhodamine-phalloidin solution (R-415, Molecular Probes) was applied to LSECs for 20 min at 21°C. LSEC were washed subsequently with PBS and mounted on microscope slides in a 1:1 solution of PBS and glycerol. As a control for the specificity of the staining reaction, LSECs were incubated first with unlabeled phalloidin solution (P-3457, Molecular Probes) for 20 min at 21°C, before incubation with rhodamine-phalloidin. No filamentous actin staining was observed when control LSECs were incubated with unlabeled phalloidin.
Samples were viewed and recorded with a Leica DM-IRBE inverted microscope, equipped with a Leica WILD MPS 48/52, 35 mm camera. The magnification was calibrated by using fluoresbrite calibration grade microspheres, (Polylab BVBA-Belgium, Ø 3.0 μm, catalogue no. 18861).
SEM.
LSECs cultivated on collagen-coated thermanox coverslips were rinsed twice with PBS and fixed with 2% glutaraldehyde in Na-cacodylate buffer (0.1 M and 0.1 M sucrose) at pH 7.4 for 12 hr. They were subsequently treated with filtered 1% tannic acid in 0.15 M Na-cacodylate at pH 7.4 for 1 hr and postfixed with 1% osmiumtetroxide in 0.1 M Na-cacodylate at pH 7.4 for 1 hr. SEM samples were dehydrated in a graded ethanol series, dried with hexamethyldisilazane, and sputter coated with 10 nm of gold. The samples were examined with a Philips SEM 505 (Philips Eindhoven, The Netherlands) at an accelerating voltage of 30 KV.
Whole-Mount TEM.
LSECs were rinsed twice with PBS. To visualize the cytoskeleton (8), samples were slightly fixed with freshly prepared 4% formaldehyde in PBS for 1 min at 21°C. LSECs were subsequently extracted in cytoskeleton buffer for 1 min at 21°C, consisting of 1 mM ethylene glycol bis [2-aminoethylether]-N, N,N′,N′ tetra-acetic acid, 100 mM piperazine-N,N′-bis [2-ethanesulfonic acid], 4% polyethylene glycol 6,000, and 0.1% Triton X-100 in PBS at pH 6.9. After extraction, cells were processed as for SEM, but the tannin was omitted. Samples were further dehydrated and hexamethyldisilazane-dried. The specimens were examined in a Philips EM 400 (Philips Eindhoven) at an accelerating voltage of 120 KV.
Morphometric and Statistical Analysis.
The SEM was regularly calibrated at a magnification of ×20,000, by using a 28.800 lines/inch grating stub with the specimen in eucentric position. For automatic image analysis, 30 images at a magnification of ×20,000 were taken in randomly selected fields of each experimental variable, each image containing a minimum of 10 fenestrae. Digital images with a low-noise content were obtained by using a large spot size (20 nm) and were processed subsequently and stored on a Masscomp 5520S computer, running under the RTU UNIX operating system, as previously described (19).
All experiments were repeated three times. Statistical analysis was performed with the Mann–Whitney U test.
RESULTS
Fluorescence Microscopy.
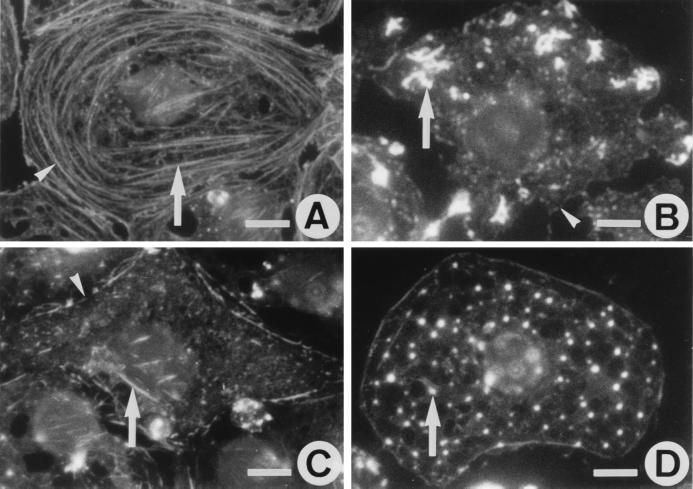
In untreated LSECs, rhodamine-phalloidin staining reveals intense circular bundles lining the cell periphery and few straight bundles oriented parallel to the long axis of the cell (Fig. 1A). Exposure of cells to 25 nM misakinolide, swinholide A, or jasplakinolide resulted in a loss of actin bundles and appearance of a compound-specific F-actin pattern (Fig. 1B–D). Maximal effects of misakinolide and swinholide A were obtained after 10- to 15-min treatment, and further incubation did not result in additional alterations in actin organization. Whereas the maximum effect of jasplakinolide was reached after 60 min. With misakinolide, F-actin changed into intensely stained curly structures at the cell periphery (Fig. 1B), whereas swinholide A resulted in diffuse, faint staining indicating massive depletion of F-actin together with a few remaining short and fine fibers (Fig. 1C). Lower concentrations of both compounds (10 and 5 nM) resulted in partial loss of F-actin bundles that were present even after 4-hr incubation. Exposure to higher concentrations of misakinolide or swinholide A (100 nM) resulted in a decreased viability as assessed by the percentage of cells stained by propidium iodide: from 96% (control) to 45% and 39%, respectively. Surprisingly, jasplakinolide did not stabilize F-actin filaments in LSECs as observed in other cell types (18, 24). Instead, F-actin became organized in small patches and dots scattered in the cytoplasm (Fig. 1D), even at concentrations as low as 10 nM. Incubation with 100 nM jasplakinolide decreased the viability from 96% to 31%.
Figure 1.
Fluorescence micrographs showing the effects of misakinolide, swinholide A, and jasplakinolide on actin organization in LSECs, monitored with rhodamine-phalloidin staining. (A) Actin distribution in control LSECs shows the presence of stress fibers (arrow), mainly oriented parallel to the long axis of the cells, and peripheral bands (arrowhead) of actin bundles that line the cell margin. (B) LSECs treated with 25 nM misakinolide for 10 min, show a loss of actin bundles, and the appearance of curly actin aggregates (arrow). Peripheral actin bands (arrowhead) are less dense and interrupted. (C) LSECs treated with 25 nM of swinholide A for 10 min also show loss of actin bundles and less dense peripheral bands with interruptions (arrowhead), whereas the cytoplasm is faintly stained and still with short and fine filaments (arrow). (D) LSECs treated with 25 nM jasplakinolide for 60 min show a complete loss of their actin bundles and the appearance of actin dots (arrow) throughout the cytoplasm. (Scale bars, 5 μm).
SEM.
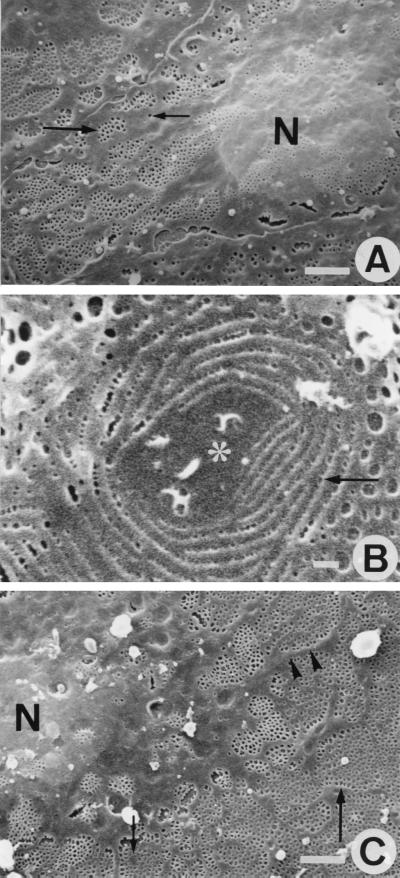
To examine the effects of the three actin-binding agents on LSEC fenestration, purified cells were grown on collagen-coated coverslips and prepared for SEM. In these experiments, we treated cells with 25 nM of one of the compounds because at this concentration actin filaments and stress fibers were disassembled without further adverse effects on cell shape and viability. Untreated LSECs revealed good preservation of their surface ultrastructural characteristics (Fig. 2A), showing a central, bulging nucleus, surrounded by flat, fenestrated cytoplasmic extensions. Remarkably, within 1 hr of misakinolide treatment, small cytoplasmic unfenestrated areas, surrounded by rows of very small fenestrae appeared within the area of fenestrated cytoplasm (Fig. 2B). Interestingly, swinholide A- and jasplakinolide-treated LSECs did show such unfenestrated areas, but the rows of very small fenestrae were absent even with different exposure times and concentrations. Because SEM gathers surface information with limited resolution, we applied whole-mount TEM to study these areas in more detail (vide infra).
Figure 2.
SEM observations of control-, and misakinolide-treated LSEC. (A) SEM micrograph of a control LSEC. Different organizations of fenestrae were found; some are arranged in sieve plates (large arrow) and some are lying single in the cytoplasm (small arrow). Nucleus (N). (Scale bar, 2 μm). (B) High-power SEM micrograph of the fenestrated cytoplasm obtained after 1 hr exposure to 25 nM misakinolide. Note a typical cytoplasmic unfenestrated area (asterisk), surrounded by circular rows of very small fenestrae (arrow). (Scale bar, 250 nm). (C) Shows a SEM micrograph of a LSEC treated with 25 nM misakinolide for 120 min, illustrating the highly fenestrated cytoplasm (large arrow). Thin nonfenestrated cytoplasmic arms (arrowheads) separate large fenestrated areas. In the fenestrated cytoplasm, small cytoplasmic unfenestrated areas could be observed (small arrow), nucleus (N). (Scale bar, 2 μm).
At 2 hr, the maximum effect of the agents on the number of fenestrae was reached. Fig. 2C depicts a typical SEM result of a misakinolide-treated LSEC after 2-hr exposure to 25 nM misakinolide. The same SEM morphology also was seen in swinholide A- and jasplakinolide-treated cells. Fenestrae were no longer clustered in sieve plates embedded in unfenestrated areas of cytoplasm, but treated cells contained abundant numbers of fenestrae interchanged with long and thin cytoplasmic arms, extending from the nucleus. Inside the fenestrated cytoplasm, the presence of small cytoplasmic unfenestrated areas could be observed. However, these areas were devoid of rows of very small fenestrae.
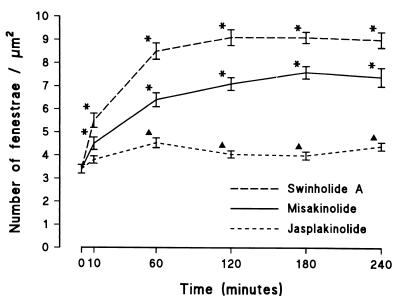
Computer-assisted analysis of endothelial fenestration, using digitized SEM images, showed that fenestrae occur at a frequency of 3.4 ± 0.2 per micrometer squared in control LSEC. Treatment with the three compounds (at 25 nM) induces a significant increase in the number of fenestrae as early as 10 min, indicating rapid de novo formation (Fig. 3) in misakinolide- and swinholide A-treated cells, corresponding to the maximum disruption of actin filaments (Fig. 1). The number of fenestrae per micrometer squared increased to 7.1 ± 0.3 and 9.1 ± 0.3 at 120 min in the presence of misakinolide or swinholide A, respectively. In the case of jasplakinolide, the maximum effect on the number of fenestrae per micrometer squared mounted to 4.5 ± 0.2 (Fig. 3) after 60 min, corresponding with the maximum effect of this agent on actin organization. Lower concentrations of misakinolide and swinholide A (5 or 10 nM) did not increase the number of fenestrae, whereas 10 nM of jasplakinolide resulted in a smaller increase in the number of fenestrae (data not shown).
Figure 3.
Time-based effects of misakinolide, swinholide A, and jasplakinolide on the number of fenestrae per micrometer squared. From this graph, we can conclude that all agents increase the number of fenestrae, although at a different rate and maximum. Data are means ±SEM of triplicate determinations. Note the significant differences between control LSECs (0 min) and treated LSECs, as indicated by asterisks above the SEM (P < 0.001) or by triangles (P < 0.01) (Mann–Whitney U test, two-sided).
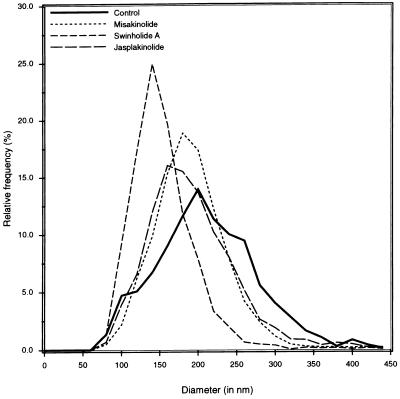
We also measured the effect of the agents on fenestrae diameter at the end of the treatment (Fig. 4). After 240 min of treatment with misakinolide, swinholide A or jasplakinolide, fenestrae diameter significantly decreased from 215 ± 2 nm (n = 1,436, controls) to 194.6 ± 1.1 nm (n = 2,977), 157.8 ± 0.9 nm (n = 3,574), and 197.4 ± 1.4 nm (n = 2,695), respectively, (diameters are means ± SEM.; P < 0.0001, Mann–Whitney U test [two-sided]).
Figure 4.
Diameter distribution of fenestrae, showing values for control, misakinolide-, swinholide A-, and jasplakinolide-treated LSECs. From this graph, we can conclude that treatment of LSECs with misakinolide, swinholide A, or jasplakinolide results in smaller fenestrae diameters.
Whole-Mount TEM.
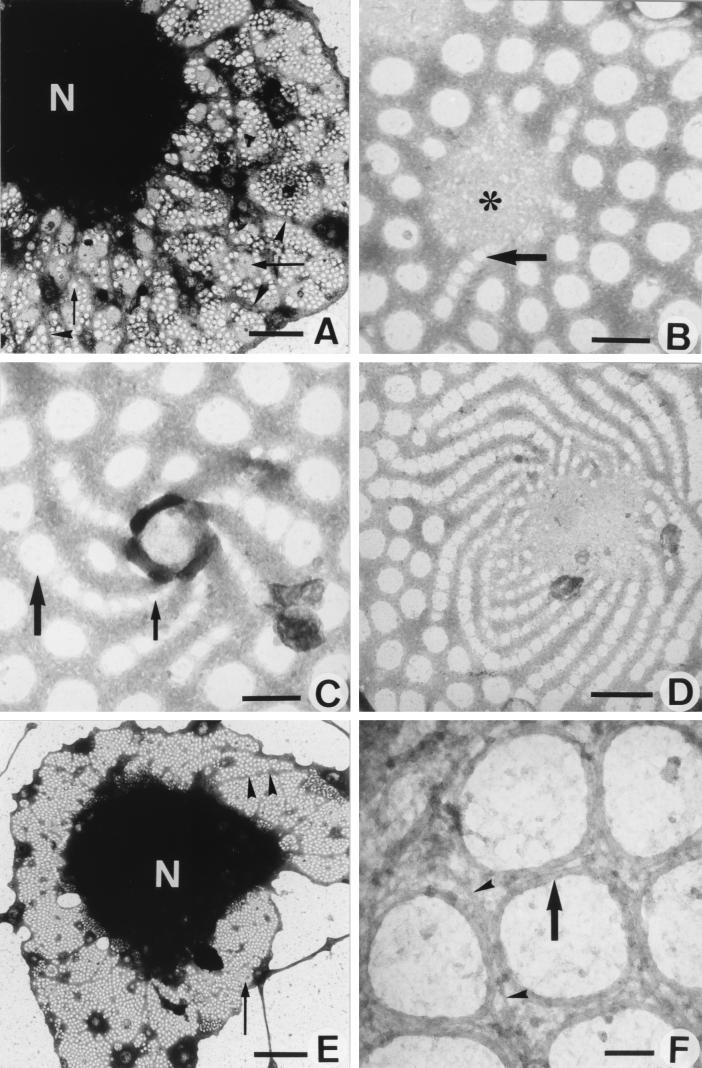
One of the most straightforward ways to observe the complex organization of the cytoskeleton at high resolution is to examine whole mounts of cells by TEM. This technique, allowing the visualization of the cytoskeleton with minimal disruption of the cells, was applied to LSECs cultured on collagen-coated grids, after slight prefixation and extraction with detergent. LSEC fenestration is characterized by the presence of a sieve plate-associated cytoskeleton and fenestrae-associated cytoskeleton rings (FACRs), connected to a cytoskeletal framework of microfilaments and microtubules (8). Treatment with 25 nM misakinolide, swinholide A, or jasplakinolide for 10–30 min resulted in the disappearance of microfilaments and an increase of fenestrae with intact FACRs. Remarkably, small cytoplasmic unfenestrated areas of intermediate electron density (gray centers) appeared within the cytoplasm of all treated cells (Fig. 5A). In addition, in several of these unfenestrated areas of misakinolide-treated cells, a very peculiar structure could be observed, consisting of rows of fenestrae with increasing diameter, fanning out into the surrounding cytoplasm, connected to the gray centers with their smallest fenestrae (Fig. 5B). These structures are suggestive of de novo fenestrae formation and we therefore propose to name them “fenestrae-forming center” (FFC). At 1 hr of misakinolide treatment, FFCs with a higher number of attached fenestrae rows could be observed per cell (Fig. 5C–D). Even in still TEM pictures these spiralling rows of fenestrae give the impression of a whirlwind, of which the normal-sized peripheral fenestrae ebb away in the surrounding fenestrated cytoplasm (Fig. 5C–D). At 120 min of treatment, when the effect of misakinolide on the number of fenestrae reaches its maximum (Fig. 5E), long cytoplasmic arms are extending from the nucleus into the cytoplasm and appear to divide the fenestrated cytoplasm into large sieve plates. At this stage, the burst of fenestrae formation has subsided and the small unfenestrated areas (gray centers) did not show the presence of rows of fenestrae (Fig. 5E). All fenestrae, therefore, also including the newly formed ones, were delineated by a FACR (Fig. 5F) with the same structure as in controls (8, 15).
Figure 5.
TEM micrographs of whole mount, formaldehyde prefixed, cytoskeleton buffer-extracted, and misakinolide-treated LSEC. (A) Low magnification showing the cell nucleus (N) and extracted cytoplasm. Note that the sieve plates are well defined by a dark border (arrowheads). Inside the sieve plates, fenestrae can be observed (small arrow); FFCs (large arrowheads). (Scale bar, 2 μm). (B) High magnification of a FFC (asterisk) shows the initial step of fenestrae formation (arrow). (Scale bar, 200 nm). (C) Within 1 hr of treatment, FFCs with a higher activity could be observed. Widening of the newly formed fenestrae occurs, from small (small arrow) to the size of well recognizable fenestrae (large arrow). (Scale bar, 200 nm). (D) Depicts a later stage in the process of fenestrae formation, fenestrae show a whirlwind-like structure, with centrally very small fenestrae, which form rows of fenestrae with increasing size, radiating into the surrounding cytoplasm. (Scale bar, 500 nm). (E) Low magnification showing the cell nucleus (N) and the highly fenestrated cytoplasm (small arrow) after 120 min of misakinolide treatment. Note the thin cytoplasmic arms (arrowheads), which run from the nucleus into the cytoplasm. In the cytoplasm, inactive FFCs could be observed (large arrow). (Scale bar, 5 μm). (F) Higher magnification of the fenestrated cytoplasm shows the presence of FACRs (arrow). From this rings, small interconnecting filaments (arrowheads) seem to crosslink the surrounding cytoskeleton. (Scale bar, 100 nm).
Detailed and thorough investigation of all preparations treated with swinholide A-, or jasplakinolide, only revealed the small unfenestrated areas (gray centers) that presumably represent inactive FFCs, but no sign of connected fenestrae rows could be visualized.
DISCUSSION
By treating LSECs with misakinolide, we were able to visualize a new structure involved in the process of fenestrae formation. Disassembly of actin filaments in LSECs by agents such as swinholide A, jasplakinolide, cytochalasin B (14), and latrunculin A (15) produces a substantial and rapid increase in the number of fenestrae and also the appearance of small unfenestrated areas (gray centers), indicating that this part of the process of fenestrae formation is equal for all compounds. When the short period of time, necessary to form new fenestrae is taken into account, it is obvious that this process does not involve de novo protein synthesis. Instead, it seems reasonable to consider a reorganization of preexisting FFCs. Recently, we could demonstrate by dry-cleaving of control and microfilament-disrupted LSECs, a sponge-like framework of three-dimensional organized fenestrae grouped along the nucleus (unpublished results). We suppose therefore, that FFCs are normally anchored in the perinuclear area of LSECs, where they cannot be resolved in whole mount TEM due to the mass thickness and the complex three-dimensional organization of the cytoskeletal proteins in this area. Microfilament-disruption might result in the translocation of preexisting FFCs from the perinuclear area into the 300–400-nm thick peripheral cytoplasm. As a consequence, the flattening of the FFCs might result in a structure as depicted in Fig. 5B–D. We also hypothesize that the spiralling of the rows of fenestrae indicates that FFCs are rotating during their translocation from the perinuclear region. It is clear, however, that static images at the electron microscopic level can only be suggestive of a dynamic process and that a technique allowing dynamic observations is necessary to visualize the actual process of fenestrae formation. The atomic force microscope can be easily operated under physiological conditions (25) and has the potential to monitor dynamic cellular events at nanometer resolution in real-time (26). Studies with the atomic force microscope on living LSECs are underway (27) to check our hypothesis on the translocation of preexisting FFC in real-time.
Fusion of two opposing cell membranes to form fenestrae most probably requires the presence of unique compositional membrane microdomains and/or a cell membrane-attached cytoskeletal structures. It has been previously demonstrated that the cell membrane of endothelial cells from various tissues contains microdomains, which are involved in the process of fenestrae formation (28, 29). Our salient findings unambiguously show the involvement of special cytoskeletal domains in the de novo formation of fenestrae and focuses future research on the molecular composition of the FFC and FACR, and on why active FFCs could be demonstrated only with misakinolide. They also underscore the importance of the novel actin-binding agents in studying cellular processes in which actin participates. The increase in endothelial porosity, induced by microfilament-disrupting drugs may perhaps be exploited therapeutically to improve the extraction of atherogenic lipoproteins from the circulation (3) and to enhance the efficiency of liposome-mediated gene or drug delivery to liver parenchymal cells (30). These possible therapeutic implications are supported by the fact that cytochalasin B is able to increase the porosity of the liver sieve in vivo (14) and that polyanionized proteoliposomes can be targeted with high efficiency to hepatic endothelial cells in vivo (31). Therefore, this opens up attractive possibilities to modulate the liver sieve of hepatic endothelial cells with liposome-encapsulated microfilament-disrupting drugs.
Acknowledgments
We thank Carine Seynaeve and Marijke Baekeland for excellent technical assistance. We also are grateful to Chris Derom for her photographic assistance. This research was financially supported by the Fund for Scientific Research-Flanders, Grants 3.0050.95 and 1.5.411.98; and partially by the National Oceanic and Atmospheric Administration Award NA46RG0090 (NY Sea Grant Project R/XBP-5).
ABBREVIATIONS
- FACR
fenestrae-associated cytoskeleton ring
- FFC
fenestrae-forming center
- LSEC
liver sinusoidal endothelial cell
- TEM
transmission electron microscopy
- SEM
scanning electron microscopy
References
- 1.Wisse E. J Ultrastruc Res. 1970;31:125–150. doi: 10.1016/s0022-5320(70)90150-4. [DOI] [PubMed] [Google Scholar]
- 2.Wisse E, De Zanger R B, Charels K, Van Der Smissen P, McCuskey R S. Hepatology. 1985;5:683–692. doi: 10.1002/hep.1840050427. [DOI] [PubMed] [Google Scholar]
- 3.Fraser R, Dobbs B R, Rogers G W T. Hepatology. 1995;21:863–874. [PubMed] [Google Scholar]
- 4.Vidal-Vanaclocha F, Alonso-Varona A, Ayala R, Barberá-Guillem E. Virchows Arch A Pathol Anat Histol. 1990;416:189–195. doi: 10.1007/BF01678977. [DOI] [PubMed] [Google Scholar]
- 5.Mori T, Okanoue T, Sawa Y, Hori N, Ohta M, Kagawa K. Hepatology. 1993;17:891–897. [PubMed] [Google Scholar]
- 6.Clark S A, Angus H B, Cook H B, Oxner R B G, George P M, Fraser R. Lancet. 1988;2:1225–1227. doi: 10.1016/s0140-6736(88)90813-6. [DOI] [PubMed] [Google Scholar]
- 7.Arias I M. In: Progress in Liver Disease. Schaffer F, Popper H, editors. Vol. 9. Philadelphia: Saunders; 1990. pp. 11–26. [Google Scholar]
- 8.Braet F, De Zanger R, Baekeland M, Crabbé E, Van Der Smissen P, Wisse E. Hepatology. 1995;21:180–189. [PubMed] [Google Scholar]
- 9.Gatmaitan Z, Varticovski L, Ling L, Mikkelsen R, Steffan A M, Arias I M. Am J Pathol. 1996;148:2027–2041. [PMC free article] [PubMed] [Google Scholar]
- 10.Cooper J A. J Cell Biol. 1987;105:1473–1478. doi: 10.1083/jcb.105.4.1473. [DOI] [PMC free article] [PubMed] [Google Scholar]
- 11.Sampath P, Pollard T D. Biochemistry. 1991;30:1973–1980. doi: 10.1021/bi00221a034. [DOI] [PubMed] [Google Scholar]
- 12.Spector I, Shochet N R, Kashman Y, Groweiss A. Science. 1983;219:493–495. doi: 10.1126/science.6681676. [DOI] [PubMed] [Google Scholar]
- 13.Spector I, Shochet N R, Blasberger D, Kashman Y. Cell Motil Cytoskeleton. 1989;13:127–144. doi: 10.1002/cm.970130302. [DOI] [PubMed] [Google Scholar]
- 14.Steffan A M, Gendrault J L, Kirn A. Hepatology. 1987;7:1230–1238. doi: 10.1002/hep.1840070610. [DOI] [PubMed] [Google Scholar]
- 15.Braet F, De Zanger R, Jans D, Spector I, Wisse E. Hepatology. 1996;24:627–635. doi: 10.1053/jhep.1996.v24.pm0008781335. [DOI] [PubMed] [Google Scholar]
- 16.Bubb M R, Spector I, Bershadsky A D, Korn E D. J Biol Chem. 1995;270:3463–3466. doi: 10.1074/jbc.270.8.3463. [DOI] [PubMed] [Google Scholar]
- 17.Terry D R, Spector I, Higa T, Bubb M R. J Biol Chem. 1997;272:7841–7845. doi: 10.1074/jbc.272.12.7841. [DOI] [PubMed] [Google Scholar]
- 18.Bubb M R, Senderowicz A M J, Duncan K L K, Korn E D. J Biol Chem. 1994;269:14869–14871. [PubMed] [Google Scholar]
- 19.Braet F, De Zanger R, Sasaoki T, Baekeland M, Janssens P, Smedsrød B, Wisse E. Lab Invest. 1994;70:944–952. [PubMed] [Google Scholar]
- 20.Smedsrød B, Pertoft H. J Leukocyte Biol. 1985;38:213–230. doi: 10.1002/jlb.38.2.213. [DOI] [PubMed] [Google Scholar]
- 21.Kato Y, Fusetani N, Matsunaga S, Hasimoto K, Sakai R, Higa T, Kashman Y. Tetrahedron Lett. 1987;28:6225–6228. [Google Scholar]
- 22.Carmeli S, Kashman Y. Tetrahedron Lett. 1985;26:511–514. [Google Scholar]
- 23.Crews P, Manes L V, Boehler M. Tetrahedron Lett. 1986;27:2797–2800. [Google Scholar]
- 24.Senderowicz A M J, Kaur G, Sainz E, Laing C, Inman W, D, Rodríguez J, Crews P, Malspeis L, Grever M R, Sausville E A, et al. J Natl Cancer Inst. 1995;87:46–51. doi: 10.1093/jnci/87.1.46. [DOI] [PubMed] [Google Scholar]
- 25.Radmacher M, Tillman R W, Fritz M, Gaub H E. Science. 1992;257:1900–1995. doi: 10.1126/science.1411505. [DOI] [PubMed] [Google Scholar]
- 26.Schneider S W, Sritharan K, Geibel J P, Oberleithner H, Jena B P. Proc Natl Acad Sci USA. 1997;94:316–321. doi: 10.1073/pnas.94.1.316. [DOI] [PMC free article] [PubMed] [Google Scholar]
- 27.Braet F, Rotsch C, Wisse E, Radmacher M. Appl Phys A. 1998;66:S575–S578. [Google Scholar]
- 28.Simionescu M, Simionescu N, Palade G E. J Cell Biol. 1982;95:425–434. doi: 10.1083/jcb.95.2.425. [DOI] [PMC free article] [PubMed] [Google Scholar]
- 29.Simionescu N, Lupu F, Simionescu M. J Cell Biol. 1983;97:1592–1600. doi: 10.1083/jcb.97.5.1592. [DOI] [PMC free article] [PubMed] [Google Scholar]
- 30.Templeton N S, Lasic D D, Frederik P M, Strey H H, Roberts D D, Pavlakis G N. Nat Biotechnol. 1997;15:647–652. doi: 10.1038/nbt0797-647. [DOI] [PubMed] [Google Scholar]
- 31.Kamps J A A M, Morselt H W M, Swart P J, Meijer D K F, Scherphof G L. Proc Natl Acad Sci USA. 1997;94:11681–11685. doi: 10.1073/pnas.94.21.11681. [DOI] [PMC free article] [PubMed] [Google Scholar]


