

Abstract
Hepatitis C virus (HCV) envelope glycoprotein co-evolution was studied in 14 genotype 1-infected and treatment naïve subjects, including 7 with mild and 7 with severe liver disease. Cassettes encoding the envelope 1 gene (E1) and hypervariable region (HVR1) of the envelope 2 gene were isolated at 38 different time points over 81 follow-up years. There were no significant differences in age, gender, alcohol use, or viral load between the mild and severe disease groups. Virus from subjects with severe disease had significantly slower evolution in HVR1, and significant divergent evolution of E1 quasispecies, characterized by a preponderance of synonymous mutations, compared to virus from subjects with mild disease. Phylogenetic comparisons indicated higher similarity between amino acid sequences of the E1 and HVR1 regions with mild disease versus severe disease (r=0.44 versus r=0.17, respectively; P=0.01). In summary, HCV envelope quasispecies co-evolution differs during mild versus severe disease.
Keywords: hepatitis C virus, envelope glycoprotein, viral evolution, viral fitness, chronic liver disease
INTRODUCTION
Hepatitis C virus (HCV), a positive-sense, single strand RNA virus of the family Flaviviridae (Lindenbach, 2001), is a major cause of chronic liver disease throughout the world (Choo et al., 1989; Di Bisceglie, 1998; Houghton et al., 1991). HCV infection accounts for at least 3 million cases of chronic hepatitis in the United States, and as many as 170 million cases worldwide (Alter et al., 1999; Kim, 2002; WHO, 1999). About 20% of infected individuals spontaneously clear the virus in the acute phase, while approximately 80% of cases result in persistent viremia that frequently develops into severe liver diseases after decades, including liver cirrhosis and hepatocellular carcinoma (Fattovich et al., 1997; Hu and Tong, 1999; Khan et al., 2000; Serfaty et al., 1998; Villano et al., 1999). Like many RNA viruses, HCV exhibits significant genetic heterogeneity as a result of high replication rates and error-prone, non-proofreading RNA polymerases (Bukh et al., 1995; Martell et al., 1992). Phylogenetic analysis has identified six genotypes or clades of HCV, each with multiple discrete subtypes (Robertson et al., 1998; Simmonds, 1995). In addition, HCV within a persistently infected individual is composed of a dynamic population of close-related, yet heterogeneous sequences, known as quasispecies (Bukh et al., 1995; Martell et al., 1992). The highest levels of HCV genetic variability are displayed in the two envelope glycoproteins E1 and E2, with maximum heterogeneity within the N-terminus of E2, commonly referred to as hypervariable region 1 (HVR1).
Although the error-prone nature of viral RNA polymerases provides the biochemical bases for rapid viral evolution (Holland et al., 1982), the quasispecies diversity is not generated by nucleotide substitutions during replication alone (Kurosaki et al., 1993; Lu et al., 2001). Immune pressure, involving neutralizing antibody, cytotoxic lymphocytes and alpha/beta interferons, is also thought to be the primary force driving HCV quasispecies evolution in vivo (Kato et al., 1993; Kurosaki et al., 1993; Neumann et al., 1998; Weiner et al., 1992; Zibert et al., 1995). HVR1, a 27 amino acid sequence located in the N-terminus of E2 protein, forms a major virus surface antigen and is the dominant epitope for strain-specific neutralizing-antibody responses (Farci et al., 1994; Farci et al., 1996; Rosa et al., 1996; Shimizu et al., 1994; Shimizu et al., 1996; Zibert et al., 1997; Zibert et al., 1995). The extensive sequence variability displayed in HVR1 correlates with the emergence of antibody escape mutants, and appears to play an essential role in maintenance of viral persistence during chronic infection (Erickson et al., 2001; Kurosaki et al., 1993; McAllister et al., 1998; Shimizu et al., 1994; van Doorn et al., 1995; Weiner et al., 1991; Weiner et al., 1992). Studies in immunosuppressed individuals have consistently reported reduced or absent variability in HVR1, presumably due to attenuation of humoral immune responses (Booth et al., 1998; Gaud et al., 2003; Gretch et al., 1996; Kumar et al., 1994; Qin et al., 2005; Sullivan et al., 1998). In spite of the high variability of HVR1, a strong negative selection is also observed against certain amino acid substitutions over the whole viral genome, which might indicate that conservative amino acids play important biological roles in the virus life-cycle (McAllister et al., 1998; Penin et al., 2001; Sobolev et al., 2000).
The genetic heterogeneity of HCV quasispecies has been shown to correlate with the evolution of chronic infection, outcome of antiviral therapy and progression of liver disease (Arenas et al., 2004; Farci et al., 2000; Farci et al., 2002; Pelletier et al., 2000; Ray et al., 1999; Sanchez-Fueyo et al., 2001). Dynamic evolution of HVR1 correlates with outcome of acute infection: subjects harboring stable viral populations frequently clear acute infection, while those with diversifying quasispecies progress to chronic infection (Farci et al., 2000; Ray et al., 1999). Higher quasispecies diversity in baseline specimens has been linked to a poor response to antiviral therapy (Farci et al., 2002; Morishima et al., 2006; Polyak et al., 1998). Finally, longitudinal studies of HCV infections after orthotopic liver transplantation (OLT) indicated that the complexity and diversity of HCV quasispecies is predictive of the histological severity of hepatitis C disease recurrence in liver allografts (Arenas et al., 2004; Gretch et al., 1996; Pelletier et al., 2000; Sanchez-Fueyo et al., 2001; Sullivan et al., 1998). Low diversity quasispecies are associated with worse disease in the post-transplant setting.
Previous studies of HCV quasispecies during natural infection have been conflicting. A missing element in all previous reports was a long-term longitudinal cohort of treatment naïve subjects with well-characterized patterns of disease progression. In a recent study, we recruited fifty-two treatment-naïve subjects with chronic HCV genotype 1 infection over multiple decades and known disease status based on liver biopsy results (Sullivan et al., 2007). The long-term dynamics of HCV infection and their associations with hepatitis C disease were analyzed. Subjects that developed mild disease had higher serum RNA titers after 2 decades of infection, greater fluctuations in serum HCV titers over time, and higher rates of HVR1 diversification over time compared to subjects that developed severe disease. In the present study, we analyzed the evolutionary dynamics of the E1 glycoprotein gene in addition to HVR1 of the E2 glycoprotein gene in 7 subjects with severe disease, and 7 non-diseased subjects randomly selected from the above cohort. Genetic parameters and their behaviors over time were carefully compared between viral genomes isolated from the two subject groups, and molecular evolutionary patterns associated with disease progression were identified for the E1 and HVR1 regions during chronic infection.
RESULTS
Patient characteristics
The fourteen subjects included in this study all underwent at least one liver biopsy on, or in the case of some subjects with mild disease, after the time point of the last serum collection. Seven subjects were defined as non-progressors with mild disease (fibrosis score of 0 or 1), and seven were defined as progressors with severe disease (bridging fibrosis or cirrhosis, fibrosis score of 3 or 4). Five of the subjects had more than 1 liver biopsy result available. Subjects in the two disease groups were comparable in most clinical and virological features, including gender (3 females in the mild group vs. 2 females in the severe group, p = 1.00), genotype (four genotype 1a and three genotype 1b in the mild group vs. five genotype 1a and two genotype 1b in the severe group, p = 1.00), mean viral load (5.2 log IU/ml vs. 5.5 log IU/ml for the mild and severe groups, respectively, p = 0.22), estimated duration of HCV infection (mean 18 years in the mild group vs. 21 years in the severe group, p = 0.56), average number of specimens (2.6 in the mild group vs. 2.8 in the severe group, p = 0.74), and years of follow-up (mean 7.4 years in the mild group vs. 7.3 years in the severe group, p = 0.93). However, subjects in the two groups differed with respect to age (48 years in the mild group vs. 36 years in the severe group, p = 0.06), and the severe disease group had a lower mean age at infection than the mild disease group (30 years in the mild group vs. 15 years in the severe group, p < 0.01). Since older age normally associates with more severe hepatitis C (Poynard et al., 1997), the fact that our mild disease subjects were older and were infected at an older age only strengthens confidence that disease classifications were accurate.
Intra-specimen genetic parameters
To characterize genetic parameters of the E1 gene and HVR1 of the E2 gene of HCV, extensive sequence analysis of quasispecies present in the serial serum samples was performed. 362 nucleotide sequences encompassing the region from nucleotide 817 at the end of the HCV core gene to nucleotide 1626 in E2 were obtained, with 169 sequences from 18 serial specimens of the individuals with mild disease and 193 sequences from 20 serial specimens of the individuals with severe disease. Intra-specimen genetic heterogeneity parameters of the E1 and HVR1 quasispecies are summarized in Table 1. In the E1 region, nonsynonymous substitutions (dN) were significantly less frequent than synonymous substitutions (dS) in both the mild and severe disease groups, with mean dN/dS ratios of 0.2627 and 0.1896, respectively. In contrast, nonsynonymous substitutions predominated in HVR1 in both disease groups. The dN/dS ratios were above 1 at 7 of 12 time points in the subjects with mild disease and 7 of 16 time points in the subjects with severe disease. The mean dN/dS values of E1 and HVR1 were not significantly different when comparing sequences from the two disease groups, although a trend towards differences between groups was evident in the E1 gene (mean dN/dS of 0.2627 versus 0.1896 for the mild versus severe disease group; P = 0.08). Genetic distance was also compared between the two disease groups with respect to both nucleotide and deduced amino acid sequences. There was no significant difference in genetic distance in either E1 or HVR1 between the subjects with mild disease and those with severe disease.
Table 1.
Comparison of intra-specimen genetic parameters between the subjects with mild disease and the subjects with severe disease.
| E1 | HVR1 | |||||||||||
|---|---|---|---|---|---|---|---|---|---|---|---|---|
| No. of subjects | No. of specimen | dS | dN | dN/dS | Nucleotide distance | Amino acid distance | dS | dN | dN/dS | Nucleotide distance | Amino acid distance | |
| Mild | 7 | 18 | 0.0232 | 0.0044 | 0.2627 | 0.0092 | 0.0091 | 0.0376 | 0.0586 | 1.4240 | 0.0576 | 0.1393 |
| (0.0040) | (0.0007) | (0.0331) | (0.0013) | (0.0010) | (0.0113) | (0.0211) | (0.3944) | (0.0179) | (0.0462) | |||
| Severe | 7 | 20 | 0.0348 | 0.0050 | 0.1896 | 0.0124 | 0.0115 | 0.0459 | 0.0527 | 1.2283 | 0.0592 | 0.1324 |
| (0.0048) | (0.0011) | (0.0265) | (0.0018) | (0.0025) | (0.0139) | (0.0166) | (0.2864) | (0.0154) | (0.0349) | |||
| P-value | 0.10 | 0.92 | 0.08 | 0.18 | 0.86 | 0.54 | 0.72 | 1.00 | 0.59 | 0.46 | ||
Next, intra-specimen dS, dN, dN/dS ratio, genetic distance and Shannon entropy were analyzed as a function of duration of infection for the time periods of 5–10 years, 11–19 years and 20–25 years after infection (Figure 1 and Figure 2). Wide fluctuations in HCV genetic parameters were observed over time in both groups of subjects. However, as shown in Figure 1A and Figure 1B, viral populations in the individuals with severe disease accumulated significantly more synonymous and nonsynonymous substitutions in the E1 region during the three decades of chronic HCV infection compared to the individuals with mild disease (P = 0.03 for dS, and P = 0.02 for dN). For HVR1, there was no consistent trend in accumulation of synonymous and nonsynonymous substitutions in either disease group (Figures 2D and 2E), although the mean dN/dS value of HVR1 exhibited a decreasing trend over time in the subjects with severe disease (Figure 2F). A detailed illustration of the intra-specimen genetic distance and Shannon entropy of the E1 region is shown in Figure 2. Comparison of the nucleotide and amino acid distances showed no significant changes over time in subjects with mild disease, but revealed an increase of genetic distances in those with severe disease, which was statistically significant between the first and third decades (P = 0.01 for both nucleotide and amino acid distances, respectively) (Figures 2A and 2C). At the time period 20–25 years after infection, the mean E1 genetic distances in the subjects with severe disease were higher than those in subjects with mild disease, for both nucleotide and amino acid populations (P = 0.02 and 0.06 for nucleotide and amino acid distances, respectively). For HVR1, the genetic distances were relatively stable over decades in both disease groups (data not shown). Shannon entropy was also plotted to determine whether the viral population variability differed according to disease progression (Figures 2B and 2D). In the mild disease group, nucleotide and amino acid entropy exhibited only moderate variation in the E1 region during HCV infection, whereas both indices increased in the severe group in a pattern similar to that observed for the E1 genetic distances. The differences between the first and third decades were statistically significant for the nucleotide as well as the amino acid population (P = 0.01 and P = 0.02 for nucleotide and amino acid distances, respectively). Again, the Shannon entropy did not exhibit significant variation in HVR1 over time in either disease group (data not shown). Taken together, the data indicate that higher synonymous and nonsynonymous substitution rates in E1, along with a greater increase of quasispecies diversity and complexity in E1, are closely associated with a higher likelihood of progression to severe liver disease during long-term chronic HCV infection. The relationship between E1 evolution and hepatitis C disease severity is completely opposite from the relationship between HVR1 evolution and hepatitis C disease severity we recently described (higher HVR1 genetic diversification was associated with mild disease progression) (Sullivan et al., 2007).
Figure 1.
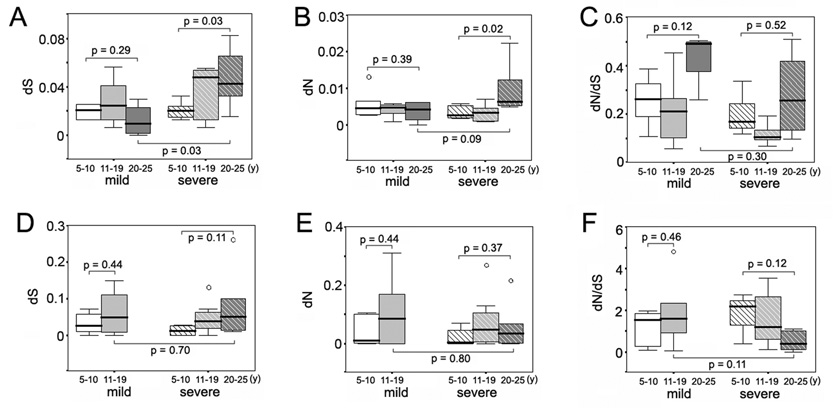
Variation of intra-specimen dS, dN and dN/dS ratio of the E1 and HVR regions according to years of disease progression in the mild and severe disease groups. Panel A, synonymous substitution rate of the E1 region in the mild and severe disease groups. Panel B, non-synonymous substitution rate of the E1 region in the mild and severe disease groups. Panel C, non-synonymous to synonymous (dN/dS) ratio of the E1 region in the mild and severe disease groups. Panel D, synonymous substitution rate of the HVR1 region in the mild and severe disease groups. Panel E, non-synonymous substitution rate of the HVR1 region in the mild and severe disease groups. Panel F, non-synonymous to synonymous (dN/dS) ratio of the HVR1 region in the mild and severe disease groups.
Figure 2.
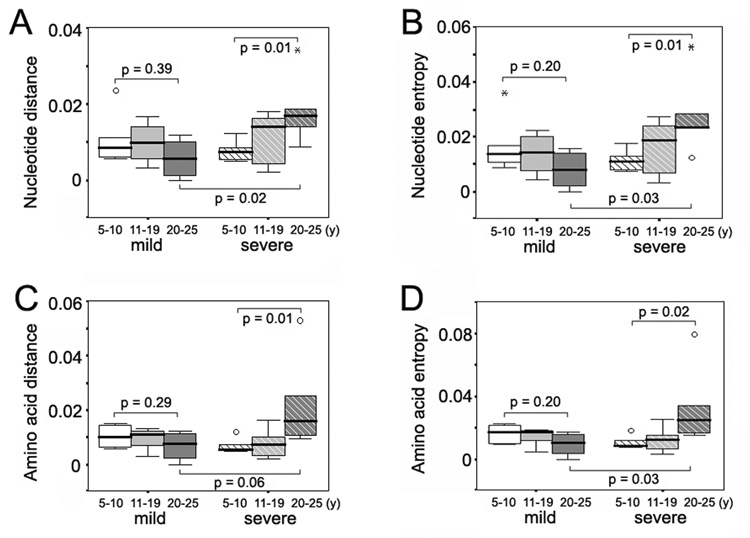
Variation of intra-specimen genetic distance and Shannon entropy of the E1 region according to years of disease progression in the mild and severe disease groups. Panel A, intra-specimen nucleotide distances of the E1 region in the mild and severe disease groups. Panel B, intra-specimen nucleotide entropy of the E1 region in the mild and severe disease groups. Panel C, intra-specimen amino acid distances of the E1 region in the mild and severe disease groups. Panel D, intra-specimen amino acid entropy of the E1 region in the mild and severe disease groups.
Inter-specimen genetic parameters
Although intra-specimen genetic parameters serve as a good indication of diversity and complexity of viral quasispecies at any one point in time, they only provide limited insight of accumulation of nucleotide substitutions and changes of viral population over time. To further investigate the latter aspect of HCV quasispecies biology, measurements of nucleotide substitutions and genetic distances were compared between envelope genes present in any paired specimens obtained from the same individual at different time points. Table 2 compares inter-specimen genetic data from HCV-infected mild (20 specimens pairs) and severe (27 specimen pairs) disease groups. Similar to the intra-specimen analysis, synonymous substitutions predominated in the E1 region when data from both disease groups were combined (dN/dS < 1). Although the two disease groups exhibited similar rates of synonymous nucleotide substitutions in the E1 region (P = 0.60), the rates of non-synonymous substitutions were significantly higher in E1 genes from the mild disease group (P = 0.01), resulting in higher dN/dS ratios in the individuals with mild disease (0.2213 in the mild disease group versus 0.1332 in the severe disease group; p < 0.01). In HVR1, the mild disease group exhibited significantly higher values of both synonymous substitutions (0.1034 in the mild group versus 0.0704 in the severe group, P = 0.02) and non-synonymous substitutions (0.1912 in the mild group versus 0.1312 in the severe group, P = 0.03), while the overall dN/dS ratios remained similar for both disease groups (2.570 in the mild group versus 2.407 in the severe group, P = 0.26). Genetic distances between the paired specimens were also compared between the two disease groups. HVR1 quasispecies present in the paired samples showed higher changes in diversity and complexity over time in the individuals with mild disease than in those with severe disease with respect to both nucleotide distances (0.1826 in the mild group versus 0.1360 in the severe group, P = 0.03) and amino acid distances (0.4405 in the mild group versus 0.3404 in the severe group, P = 0.07). E1 quasispecies in the mild disease group also exhibited higher amino acid distance compared to the quasispecies in the severe group (0.0212 in the mild group versus 0.0155 in the severe group, P = 0.04).
Table 2.
Comparison of inter-specimen genetic parameters between the subjects with mild disease and the subjects with severe disease.
| E1 | HVR1 | |||||||||||
|---|---|---|---|---|---|---|---|---|---|---|---|---|
| No. of subjects | No. of pairwise specimen | dS | dN | dN/dS | Nucleotide distance | Amino acid distance | dS | dN | dN/dS | Nucleotide distance | Amino acid distance | |
| Mild | 7 | 20 | 0.0581 | 0.0110 | 0.2213 | 0.0222 | 0.0212 | 0.1034 | 0.1912 | 2.570 | 0.1826 | 0.4405 |
| (0.0072) | (0.0014) | (0.0190) | (0.0027) | (0.0026) | (0.0137) | (0.0232) | (0.4680) | (0.0179) | (0.0454) | |||
| Severe | 7 | 27 | 0.0606 | 0.0071 | 0.1332 | 0.0198 | 0.0155 | 0.0704 | 0.1312 | 2.407 | 0.1360 | 0.3404 |
| (0.0041) | (0.0010) | (0.0186) | (0.0014) | (0.0021) | (0.0083) | (0.0143) | (0.1514) | (0.0112) | (0.0280) | |||
| P-value | 0.60 | 0.01 | < 0.01 | 0.50 | 0.04 | 0.02 | 0.03 | 0.26 | 0.03 | 0.07 | ||
Next, the inter-specimen genetic parameters were analyzed relative to the more recent time point of the paired samples for the time periods of 5–10 years, 11–19 years and 20–25 years after infection, respectively (Figure 3 and Figure 4). No significant differences were observed according to decade of infection for HVR1 between the two disease groups (data not shown). For the E1 region, while the synonymous substitution rate remained relatively stable in the mild group, there was a significant increase in the dS rate in the individuals with severe disease between the first and the third decades (P = 0.04) (Figure 3A). At the same time, however, little fluctuation was observed for the nonsynonymous substitution rate or the dN/dS ratio in those subjects (Figures 3B and 3C). E1 quasispecies present in the paired samples from subjects with severe disease showed a progressive increase in nucleotide distances over time between the first and the third decades of infection (P = 0.02), whereas E1 quasispecies from subjects with mild disease did not show this evolutionary pattern (Figure 4A).
Figure 3.
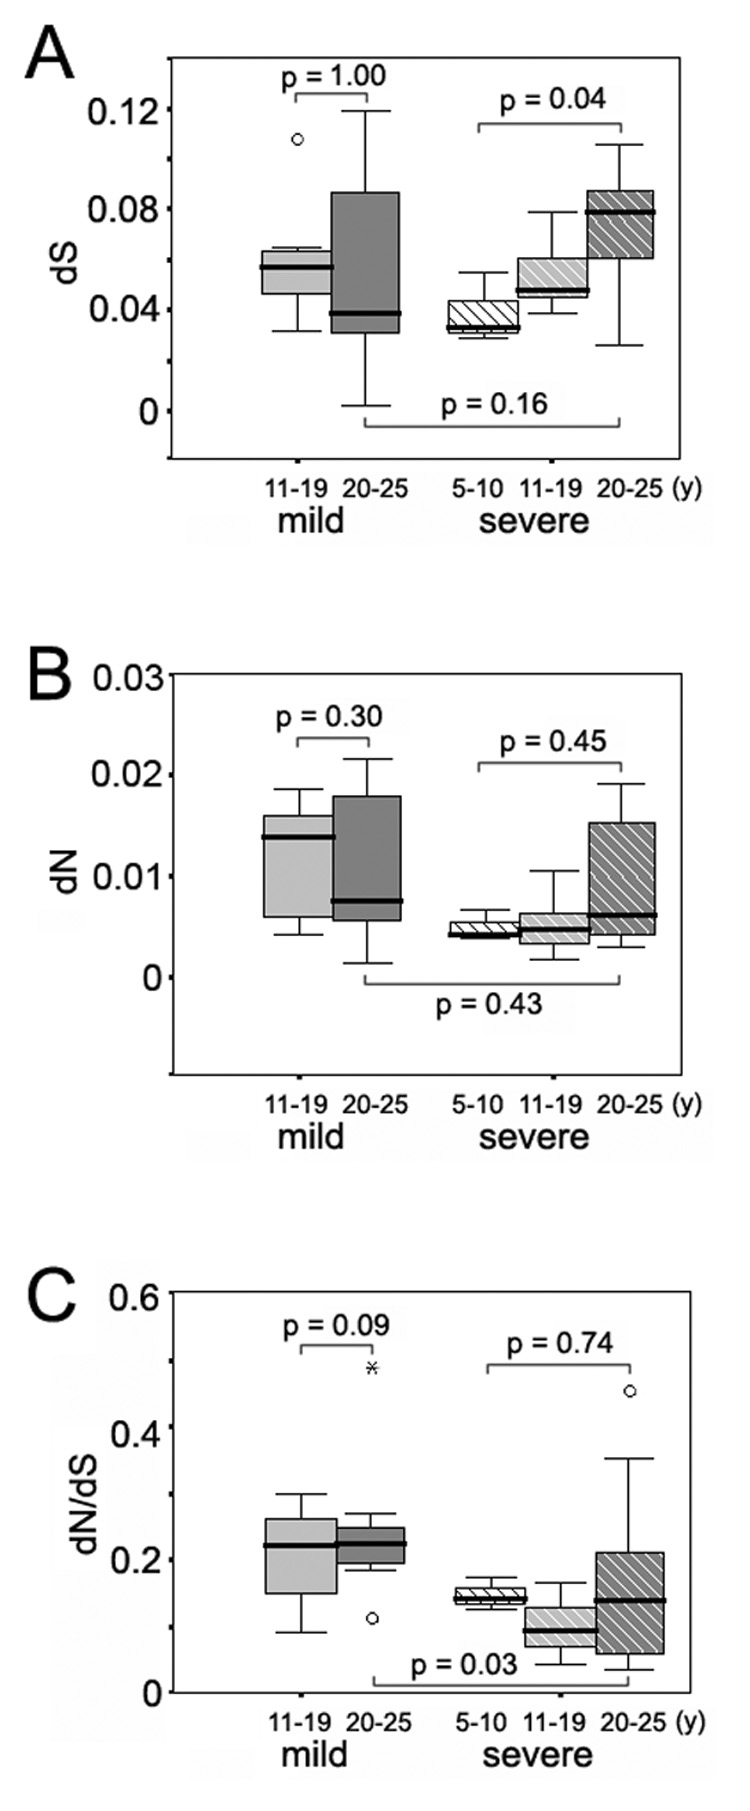
Variation of inter-specimen dS, dN and dN/dS ratio of the E1 region according to years of disease progression in the mild and severe disease groups. Panel A, synonymous substitution rate of the E1 region in the mild and severe disease groups. Panel B, non-synonymous substitution rate of the E1 region in the mild and severe disease groups. Panel C, non-synonymous to synonymous (dN/dS) ratio of the E1 region in the mild and severe disease groups.
Figure 4.
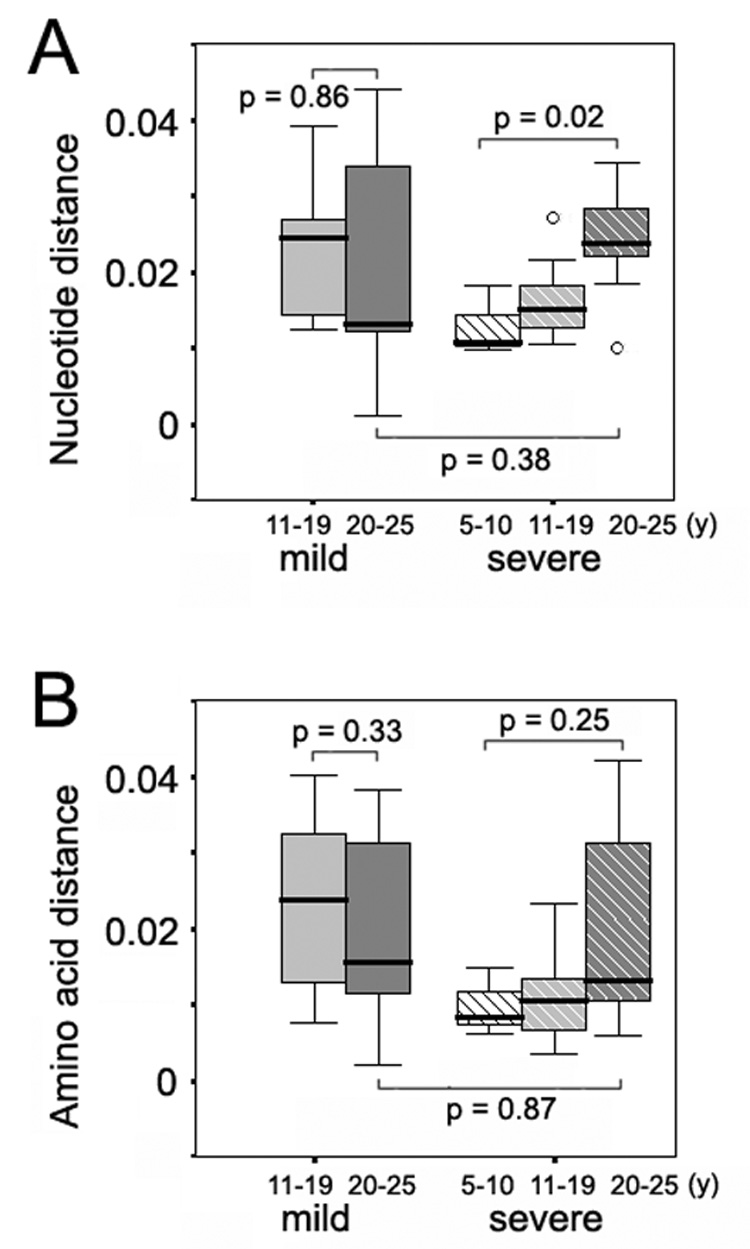
Variation of inter-specimen genetic distance of the E1 region according to years of disease progression in the mild and severe disease groups. Panel A, inter-specimen nucleotide distances of the E1 region in the mild and severe disease groups. Panel B, inter-specimen amino acid distances of the E1 region in the mild and severe disease groups.
Phylogenetic analysis and the co-evolution coefficients between E1 and HVR1 of E2
Phylogenetic reconstruction was performed on nucleotide sequence alignments to assess the specific evolutionary patterns of E1 and HVR1 according to disease progression. Phylogenetic trees for representative subjects from both disease groups are shown in Figure 5. As seen in the left part of the figure, the E1 quasispecies sequences diverged away from the initial viral population in both disease groups, with similar patterns of evolutionary drift. Interestingly, the sequence cluster of the third time point (1996) from the subject with severe disease drifted toward the initial time point (1989) instead of diverging away as a discrete lineage, suggesting that these variants were selectively advantageous between the second and third time points and were fixed as the major viral population. Divergent evolution was also evident in HVR1 from subjects in the mild disease group, with three distinct evolutionary clusters corresponding to the three time points, which exactly corresponded to the clusters in the E1 phylogenetic tree (Figure 5A, the left panel). However, HVR1 sequences from the representative subject with severe disease were closely related to each other, and showed little evidence of divergent evolution when variants at different time points were compared (Figure 5B, right panel).
Figure 5.
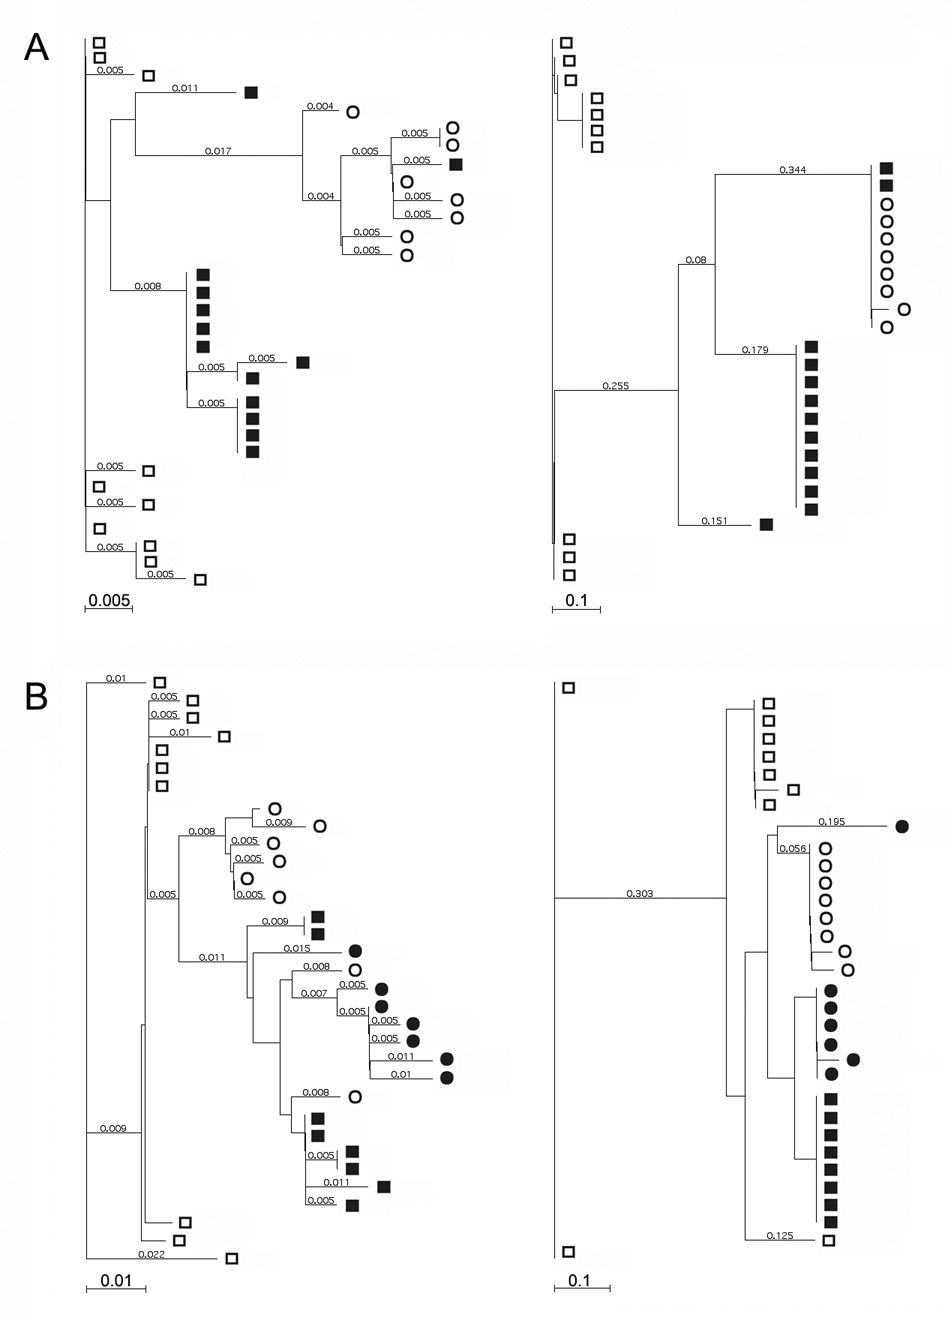
Phylogenetic trees constructed according to the amino acid sequences of the E1 and HVR regions obtained from representative individuals within the mild and severe disease groups. The trees were constructed with the neighbor-joining method, and Poisson-correction distances were shown with each branch. Panel A, phylogenetic trees based on the E1 (on the left) and HVR (on the right) amino acid sequences from a representative individual with mild disease. Sequences at various time points are indicated by various symbols (□, 1987; ■, 1988; ○, 1996). Panel B, phylogenetic trees based on the E1 (on the left) and HVR (on the right) amino acid sequences from a representative individual with severe disease. Sequences at various time points are indicated by various symbols (□, 1989; ■, 1994; ○, 1996; ●, 1997).
To evaluate E1 and HVR1 co-evolution and its association with the disease progression, we compared interrelatedness between the E1 and HVR1 phylogenetic trees from each study subject. Similarity between the phylogenetic trees was evaluated for statistical association of correlation coefficients, and interpreted as an indication of coordinated evolution under a similar evolutionary pressure (Pazos et al., 2005; Pazos and Valencia, 2001). Genetic distance was calculated for each individual E1 or HVR1 sequence by comparing the sequence to all the other E1 or HVR1 sequences obtained from the same subject. Then, a linear correlation coefficient was evaluated between the data set of E1 and HVR1 genetic distances for each subject. All of the correlation coefficients are plotted according to disease groups in Figure 6. The correlation of amino acid distances between E1 and HVR1 was significantly higher among the subjects with mild disease compared to those with severe disease (r = 0.44 versus r = 0.17, P = 0.01). These data indicate the E1 glycoprotein and HVR1 of the E2 glycoprotein evolve at a higher coordinate level in the subjects with mild disease compared to the subjects with severe disease.
Figure 6.
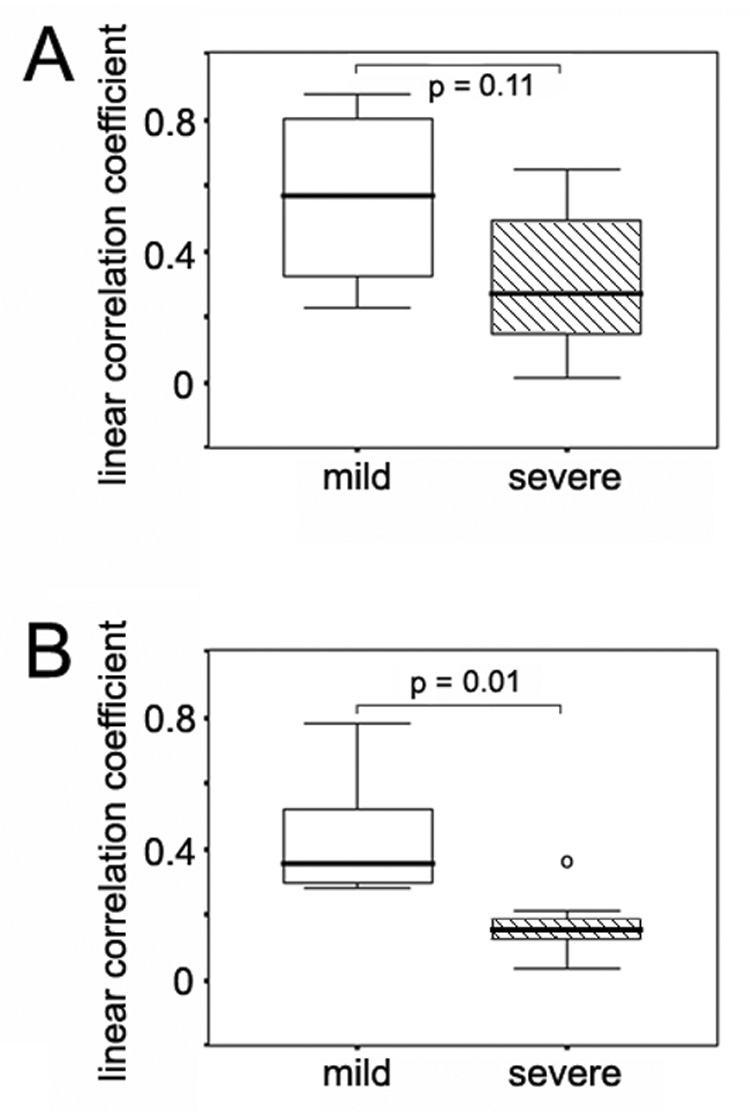
Linear correlation coefficients between genetic distances of the E1 and HVR regions in the mild and severe disease groups. Panel A, linear correlation coefficients between nucleotide distances of the E1 and HVR regions in the mild and severe disease groups. Panel B, linear correlation coefficients between amino acid distances of the E1 and HVR regions in the mild and severe disease groups.
Amino acid comparisons and signature sequence analysis of E1
To determine whether specific amino acid usage patterns were associated with disease outcomes, the deduced consensus amino acid sequences of E1 from each subject were assessed and compared between the mild and severe disease groups (Figure 7). HVR1 amino acid comparisons between disease groups was previously reported (Sullivan et al., 2007). The 14 consensus E1 sequences exhibited complete conservation at 126 of the 192 (66%) amino acid positions, suggesting that the E1 region is under a high degree of purifying selection. There were 5 putative N-linked glycosylation sites (NXT or NXS) (Goffard and Dubuisson, 2003; Meunier et al., 1999) and 8 cysteine residues present throughout the E1 region, and all of them were highly conserved among the 14 sequences except one potential glycosylation site which presented an N to S mutation in 58% of sequences from a subject with severe disease (S030).
Figure 7.

Alignment of the concensus amino acid sequences of the E1 region from each individual subject with mild (M) and severe (S) disease. *, putative N-linked glycosylation site (NXT or NXS); #, cysteine residue.
VESPA program was used to search for signature motifs between the mild and severe disease groups. Three amino acid positions were identified at which the majority amino acid differed according to disease groups: position 219 with 2T 2A 2M 1V in the mild group and 4A 2M 1T in the severe group, position 235 with 3S 2A 1I 1T in the mild group and 2V 2T 1A 1I 1S in the severe group, and position 359 with 4L 3I in the mild group and 4I 2L 1V in the severe group. However, none of the majority amino acids at these positions was unique to either group of subjects. The pI values were evaluated for the consensus E1 sequences from each individual subject; sequences from the subjects with severe disease were more positively charged than those from subjects with mild disease (pI = 8.16 versus pI = 7.32, P = 0.14).
DISCUSSION
In the present study, the evolution of the HCV envelope glycoproteins was analyzed in patients selected from a cohort with long-term chronic HCV infection followed prospectively to determine viral factors associated with the progression to cirrhosis. Subjects with HCV genotype 1 infection and who had not received any antiviral therapy were recruited and divided into two groups, one with severe disease and one with mild disease, based on histological findings on liver biopsy. 362 nucleotide sequences encompassing the E1 and HVR1 regions were generated from sequential serum specimens, and subjected to various phylogenetic analyses. The evolutionary trend of the E1 and HVR1 regions differed markedly according to disease status. As previously reported in the HCV-infected liver transplant model (Arenas et al., 2004; Gretch et al., 1996; Lyra et al., 2002; Sullivan et al., 1998), the HCV and HIV coinfection model (Qin et al., 2005), and during natural infection (Curran et al., 2002; Sullivan et al., 2007), reduced genetic diversification of HVR1 over time correlated with severe disease. In contrast, the present results demonstrate that during natural infection, severe disease was associated with increased diversification of the E1 glycoprotein gene over time, with progressive accumulation of both synonymous and nonsynonymous mutations. Comparison of E1 and HVR1 phylogenetic trees demonstrated that the two regions were less evolutionarily correlated in the individuals with severe disease.
A major limitation of the study is the relatively small sample size, making it premature to draw conclusions on the association between HCV glycoprotein evolution and disease progression in hepatitis C. For example, dN/dS ratios in HVR1 appeared to decline over time during severe disease, yet increase over time during mild disease (Figure 1, panel F). Such data might imply that immune pressure on HVR1 decreased over time during disease progression. However, the data did not reach statistical significance, possibly because of the limited sample size. Therefore, larger studies are needed to confirm the present findings. A major strength of this study is that the two disease groups were very well defined and matched (e.g., all therapy naïve, all infected with genotype 1, concomitant infections rigorously excluded, equivalent alcohol use, all were indigenous American Peoples), disease endpoints were well defined by liver biopsy, sampling was extensive, and quality genetic data were obtained. Verification of these findings is warranted by the potential clinical significance of HCV quasispecies biology, including the association between low HVR1 diversity and more severe disease outcome (Sullivan et al., 2007), and the association between high HVR1 diversity and poor response to interferon-based therapies (Koizumi et al., 1995; Morishima et al., 2006; Pawlotsky et al., 1998; Polyak et al., 1997).
Nucleotide substitutions of HVR1
HVR1 of E2, with the highest nucleotide substitution rate of the HCV genome, has been used as the most popular target in molecular studies of HCV quasispecies heterogeneity and phylogenies (Alfonso et al., 2004; Allain et al., 2000; Curran et al., 2002). Host immune pressure is considered to be the primary force driving quasispecies evolution in this region (Booth et al., 1998; Farci et al., 1994; Farci et al., 1996; Ray et al., 1999; Shimizu et al., 1994; Shimizu et al., 1996). With nonsynonymous substitutions predominant, the evolution of HVR1 occurs under immune pressure, either by fixation of spontaneous mutations at specific sites, or by shifts of major variants in a quasispecies (Lu et al., 2001). Variations are unequally distributed within HVR1, with the presence of both highly variable and highly conserved positions. It has been suggested that the positively selected sites are most likely to be surface-exposed, and therefore prime targets for host antibody responses (Wack et al., 2001; Yagnik et al., 2000). At the same time, a negative pressure is probably exerted against conserved positions essential for conformation conservation and/or host cell attachment (Penin et al., 2001). Previous investigators have proposed that HVR1 acts as an immunologic decoy during HCV infection, stimulating a strong yet ineffective immune response that results in a genetically unstable population without producing significant growth disadvantages or effective antiviral control (Ray et al., 1999; Sheridan et al., 2004). The present study could not determine the extent that quasispecies homogenization resulted from reduced immune pressure, versus accumulation of variants that successfully escaped antibody responses, versus formation of an equilibrium between the viral population and host immune responses.
Nucleotide substitutions of E1
E1 is a type-I transmembrane glycoprotein with a short C-terminal transmembrane domain of about 30 amino acids (Deleersnyder et al., 1997; Op De Beeck et al., 2000). E1 shares sequence similarity to the scaffold of class II membrane-fusion protein as observed in other members of the Flaviviridae family (Garry and Dash, 2003). By forming noncovalent heterodimers with E2, E1 plays pivotal roles in binding to receptors during host cell recognition and inducing fusion with the cell membrane (Bartosch et al., 2003). In contrast to HVR1 of E2, the E1 glycoprotein is reported to have a high degree of sequence conservation, appears to be less immunogenic in vivo, and by inference, is less likely to be surface-exposed (Allison et al., 2001; Fournillier et al., 2001). Our present results confirm that the dN/dS ratio of the E1 region is significantly lower than 1, regardless of patient disease status, suggesting that the majority of positions within E1 are under strong negative selection with amino acid constraints. The data may indicate a need to conserve E1 protein modification and/or folding processes that determine the glycoprotein confirmation and/or specific virus-cell receptor interactions during viral recognition and attachment to the host cells.
HCV glycoprotein dynamics and disease progression
Absolute nucleotide substitution rates can provide great insight into factors involved in a change of the evolutionary process (Seo et al., 2004). Synonymous substitution rates can be affected by differences in viral generation time or reproductive rate, while nonsynonymous substitution rates can be altered by either viral generation time, changes in patterns of selection, or effective viral population size. In the present study, inter-specimen synonymous and nonsynonymous substitution rates of the HVR1 region were consistently higher in subjects with mild disease, and viral quasispecies accumulated more genetic heterogeneity between different time points compared to virus infecting subjects with severe disease. In the post-transplant setting, subjects with severe disease had significantly reduced CD4+ T cell responses against HCV antigens compared to subjects with mild disease (Rosen et al., 1999), suggesting that deficient host immune responses may contribute to quasispecies homogenization in HVR1 during severe disease. Unfortunately, immunology data are not yet available for the present cohort.
In contrast to HVR1, E1 glycoprotein genetics accelerated during severe disease, with increasing dS and dN substitution rates resulting in increasing genetic heterogeneity at both the nucleotide and amino acid levels. Increases in both dS and dN within a poorly immunogenic region (such as found in E1) suggest increased replication rate. One hypothesis concerning HCV replication dynamics is that variants with increased replication fitness acquire survival advantages, and become the dominant population during progression of severe disease, as has been proposed for HIV disease (Lemey et al., 2007; Nowak and May, 2000). If true, viral emergence might be associated with reduced host pressure (i.e., immune exhaustion), viral escape, virus-immune equilibrium, or viral knockout of host control mechanisms. Alternatively, the data may be interpreted as resulting from higher turnover of infected cells, as proposed by Wang et al. (Wang et al., 2007).
Previous studies have defined important interactions between the E1 and E2 glycoproteins of HCV. Therefore, we analyzed amino acid relationships between the two glycoproteins, according to disease status. In subjects with mild disease, primary amino acid sequences in E1 and HVR1 remained more closely related over time compared to the same regions in subjects with severe disease. The data suggest fundamental differences in co-evolutionary dynamics between the HCV E1 and HVR1 glycoprotein domains in subjects with mild versus severe disease, perhaps indicating differences in the ability of virus to escape immunity, and/or differences with respect to efficiency and specificity of cell receptor usage.
In a recent study of HCV replicative intermediate RNA using strand-specific in situ hybridization, we reported a highly significant association between higher indices of intrahepatic HCV replication and more severe liver disease (Pal et al., 2006). Diseased livers also have higher levels of HCV non-structural antigens than non-diseased livers (Gretch et al., 1995; Hiramatsu et al., 1992). However, HCV serum viral loads do not increase during progression to severe disease, at least during natural infection (Sullivan et al., 2007). The most logical explanation is hepatic exhaustion, i.e., that more extensive liver damage results in fewer liver cells that are capable of supporting HCV replication. Alternatively, viral variants may become cell-associated, due to decreased efficiency of virogenesis as a result of intracellular congestion and/or toxicity associated with accumulation of viral replication products, even though viral replication is more robust. Thus, the relationship between viral population size in circulation and viral replication rate in liver may be different in subjects with mild versus severe disease, a possibility that deserves further study.
N-linked glycosylation
There are five potential N-linked glycosylation sites over the HCV E1 glycoprotein (Goffard and Dubuisson, 2003; Meunier et al., 1999). N-linked glycosylation sites, necessary for correct glycoprotein confirmation and cellular entry, can be sites of occurrence of adaptive mutations (Goffard et al., 2005; Huang et al., 1997; Li et al., 1993; Wu et al., 1995). Changes in N-linked glycosylation of the HIV envelope gene product, gp120, have recently been proposed as important in neutralization escape and viral persistence (Choisy et al., 2004; Wei et al., 2003). In our dataset, only one glycosylation site was detected missing, and this mutation occurred in only one subject. These data suggest that in contrast to the glycan shield of HIV, which can be rearranged to provide protection against neutralizing antibodies, the major function of glycosylation of HCV E1 glycoprotein is to ensure correct glycoprotein processing, folding and cellular entry, rather than immune shielding.
In summary, the data indicate that divergent evolution of E1 and decreasing quasispecies heterogeneity in the E2 hypervariable region strongly associated with progression to severe chronic hepatitis C disease. Accumulation of synonymous mutations in E1 accompanied by homogenization of sequences in HVR1 implicate viral outgrowth as secondary to fitness advantage. The collective data can be interpreted to indicate that during severe disease, variants with increased replication fitness (based on E1 genetics) successfully escaped from or equilibrated with the neutralizing antibody responses (based on HVR1 genetics). We hypothesize that HCV can adapt to non-sterilizing, disease-arresting antiviral pressures of the infected host, and that such adaptation somehow triggers increasing severity of liver disease. To prove the hypothesis requires systems to discriminate whether viral genetic changes trigger disease, or whether they are simply a consequence of other mechanisms driving disease progression.
MATERIALS AND METHODS
Subjects and samples
The 14 subjects included in the present study were recruited from the cohort of Alaska Natives and American Indians (AN/AI) cohort, and were included in previously published studies of the long term patterns of HCV genotype 1 infection in humans (McMahon et al., 2004; Sullivan et al., 2007). All subjects were negative of HIV and HBV coinfections, and all were interferon treatment-naïve. Disease status was inferred from current liver biopsies that were systematically evaluated by a single study pathologist (HD) according to the Knodell scoring system (Ishak et al., 1995; Knodell et al., 1981; Scheuer et al., 2002). Seven subjects were classified with severe disease (bridging fibrosis or cirrhosis) and seven were classified as with mild, non-progressive disease. The date of HCV infection was estimated based on risk factor data from patient interviews (the date of first intravenous drug use or pre-1992 blood transfusion) and was correlated with antibody seroconversion dates (Bruden et al., 2004). A total of 38 serial serum samples were collected from the 14 individuals over 81 follow-up years, and stored at −80°C for future RNA extraction.
Cloning and sequencing of E1 and HVR1
Reverse-transcription PCR (RT-PCR), cloning and sequencing was performed as previously described by our laboratory (Wilson et al., 1995). RT-PCR was performed in a 25 µL volume in the presence of anti-sense primer JBE1-1as (1639–1600, AGGCTTTCATTGCAGTTCAAGGCCGTGCTATTGATGTGCC) at 37°C for 1 h using the M-MLV reverse transcriptase kit (Invitrogen, Carlsbad, CA). The resulting cDNA was used as template in nested PCR to amplify a 0.84 kb fragment encompassing the E1 glycoprotein gene and HVR1 of the E2 glycoprotein gene. Aliquots (10 µL) of cDNA were mixed with 0.5 µM anti-sense primer JBE1-1as and sense primer JBE1-1s (802–841, GCGTCCGGGTTCTGG-AAGACGGCGTGAACTATGCAACAGG), 1 mM dNTPs and 0.5 U Platinum Taq Polymerase High Fidelity (Invitrogen, Carlsbad, CA) in a 25 µL reaction volume with 1 × PCR buffer. After an initial denaturation at 95°C for 2 minutes, PCR was carried out for 35 cycles with 30 seconds of denaturation at 95°C, 30 seconds of annealing at 55°C, and 1 minute of extension at 72°C, followed by a final extension at 72°C for 5 minutes. Then, one microliter of the first-round PCR product was used as template in second-round reactions with primers JBE1-2s (817–856, AAGACGGCGTGAACTATGCAACAGGG-AACCTTCCTGGTTG) and JBE1-2as (1626–1587, AGTTCAAGGCCGTGCTATTGATGTGCCAACTGCCGTTGGT). The second-round amplification was carried out using identical conditions to the first-round PCR.
PCR fragments were analyzed by agarose gel electrophoresis and extracted from the gel using Qiagen DNA purification kit (QIAGEN Inc., Valencia, CA). The fragments were ligated into the TA cloning vector (Invitrogen, Carlsbad, CA) and transformed into Escherichia coli TOP-10 competent cells for recovery of plasmid clones. Eight to twelve clones representative of each sequential time point for each subject were selected, amplified with primers JBE1-2s and JBE1-2as, and sequenced at both directions using an ABI 3730XL high-throughout capillary DNA Analyser.
Phylogenetic analysis
Nucleotide sequences were aligned using the CLUSTAL W program (Thompson et al., 1994) included in MacVector version 9.0 (Symantec Corp., Cupentino, CA) with manual adjustment. The rates of inter and intra-sample non-synonymous substitutions (dN) and synonymous substitutions (dS) were estimated using the method of Nei and Gojobori (Nei and Gojobori, 1986) and the Synonymous/Non-synonymous Analysis Program on Los Alamos National Security website (http://hcv.lanl.gov/content/hcv-db/SNAP/SNAP.html) (Korber, 2000). The resulting matrix was used to estimate mean inter- and intra-sample dS, dN and dN/dS ratios. Protein sequences were deduced from the nucleotide sequences using MacVector version 9.0. The mean genetic distance was calculated using the Kimura two-parameter method and the PHYLIP version 3.5 package (Felsenstein, 1993). Shannon entropy was determine using the Entropy program on the Los Alamos National Security website (http://hcv.lanl.gov/content/hcv-db/ENTROPY/entropy.html) (Korber et al., 1994). Phylogenetic trees were constructed using the neighbor-joining method (Saitou and Nei, 1987) and MacVector version 9.0. Signature pattern analysis was performed using the Viral Envelope Signature Pattern Analysis (VESPA) program (Korber and Myers, 1992).
Statistical analysis
All statistical calculations were performed using SPSS Base 11 (SPSS Inc., Chicago, IL). To determine the associations between patient characteristics and disease progression, independent-sample Mann-Whitney tests were used to compare age, viral load, age at HCV infection and length of HCV infection between the mild and severe disease groups, while Fisher exact tests were used for evaluating gender and genotype. Independent-sample Mann-Whitney tests were also used to analyze differences between the genetic parameters of mild and severe subjects as a whole group or at various time points. The linear correlation coefficient (r) was calculated to determine the relationship between genetic distances of the E1 and HVR1 regions. P-values of less than 0.05 were considered to be statistically significant.
ACKNOWLEDGMENTS
This study was supported by NIH grants AI 48214 and AI 7044-28, Alaska Science & Technology Foundation Grant Agreement Number 99-4-113, University of Washington, the Liver Disease and Liver Disease Hepatitis Program of the Alaska Native Tribal Health Consortium and the Arctic Investigations Program of the National Centers for Infectious Diseases, Centers for Disease Control and Prevention.
Footnotes
Publisher's Disclaimer: This is a PDF file of an unedited manuscript that has been accepted for publication. As a service to our customers we are providing this early version of the manuscript. The manuscript will undergo copyediting, typesetting, and review of the resulting proof before it is published in its final citable form. Please note that during the production process errors may be discovered which could affect the content, and all legal disclaimers that apply to the journal pertain.
REFERENCES
- Alfonso V, Flichman DM, Sookoian S, Mbayed VA, Campos RH. Evolutionary study of HVR1 of E2 in chronic hepatitis C virus infection. J Gen Virol. 2004;85:39–46. doi: 10.1099/vir.0.19403-0. [DOI] [PubMed] [Google Scholar]
- Allain JP, Dong Y, Vandamme AM, Moulton V, Salemi M. Evolutionary rate and genetic drift of hepatitis C virus are not correlated with the host immune response: studies of infected donor-recipient clusters. J Virol. 2000;74:2541–2549. doi: 10.1128/jvi.74.6.2541-2549.2000. [DOI] [PMC free article] [PubMed] [Google Scholar]
- Allison SL, Schalich J, Stiasny K, Mandl CW, Heinz FX. Mutational evidence for an internal fusion peptide in flavivirus envelope protein E. J Virol. 2001;75:4268–4275. doi: 10.1128/JVI.75.9.4268-4275.2001. [DOI] [PMC free article] [PubMed] [Google Scholar]
- Alter MJ, Kruszon-Moran D, Nainan OV, McQuillan GM, Gao F, Moyer LA, Kaslow RA, Margolis HS. The prevalence of hepatitis C virus infection in the United States, 1988 through 1994. N Engl J Med. 1999;341:556–562. doi: 10.1056/NEJM199908193410802. [DOI] [PubMed] [Google Scholar]
- Arenas JI, Gallegos-Orozco JF, Laskus T, Wilkinson J, Khatib A, Fasola C, Adair D, Radkowski M, Kibler KV, Nowicki M, Douglas D, Williams J, Netto G, Mulligan D, Klintmalm G, Rakela J, Vargas HE. Hepatitis C virus quasi-species dynamics predict progression of fibrosis after liver transplantation. J Infect Dis. 2004;189:2037–2046. doi: 10.1086/386338. [DOI] [PubMed] [Google Scholar]
- Bartosch B, Dubuisson J, Cosset FL. Infectious hepatitis C virus pseudo-particles containing functional E1–E2 envelope protein complexes. J Exp Med. 2003;197:633–642. doi: 10.1084/jem.20021756. [DOI] [PMC free article] [PubMed] [Google Scholar]
- Booth JC, Kumar U, Webster D, Monjardino J, Thomas HC. Comparison of the rate of sequence variation in the hypervariable region of E2/NS1 region of hepatitis C virus in normal and hypogammaglobulinemic patients. Hepatology. 1998;27:223–227. doi: 10.1002/hep.510270134. [DOI] [PubMed] [Google Scholar]
- Bruden DL, McMahon BJ, Hennessy TW, Christensen CJ, Homan CE, Williams JL, Sullivan DG, Gretch DR, Cagle HH, Bulkow LR. Estimating the date of hepatitis C virus infection from patient interviews and antibody tests on stored sera. Am J Gastroenterol. 2004;99:1517–1522. doi: 10.1111/j.1572-0241.2004.30826.x. [DOI] [PubMed] [Google Scholar]
- Bukh J, Miller RH, Purcell RH. Genetic heterogeneity of hepatitis C virus: quasispecies and genotypes. Semin Liver Dis. 1995;15:41–63. doi: 10.1055/s-2007-1007262. [DOI] [PubMed] [Google Scholar]
- Choisy M, Woelk CH, Guegan JF, Robertson DL. Comparative study of adaptive molecular evolution in different human immunodeficiency virus groups and subtypes. J Virol. 2004;78:1962–1970. doi: 10.1128/JVI.78.4.1962-1970.2004. [DOI] [PMC free article] [PubMed] [Google Scholar]
- Choo QL, Kuo G, Weiner AJ, Overby LR, Bradley DW, Houghton M. Isolation of a cDNA clone derived from a blood-borne non-A, non-B viral hepatitis genome. Science. 1989;244:359–362. doi: 10.1126/science.2523562. [DOI] [PubMed] [Google Scholar]
- Curran R, Jameson CL, Craggs JK, Grabowska AM, Thomson BJ, Robins A, Irving WL, Ball JK. Evolutionary trends of the first hypervariable region of the hepatitis C virus E2 protein in individuals with differing liver disease severity. J Gen Virol. 2002;83:11–23. doi: 10.1099/0022-1317-83-1-11. [DOI] [PubMed] [Google Scholar]
- Deleersnyder V, Pillez A, Wychowski C, Blight K, Xu J, Hahn YS, Rice CM, Dubuisson J. Formation of native hepatitis C virus glycoprotein complexes. J Virol. 1997;71:697–704. doi: 10.1128/jvi.71.1.697-704.1997. [DOI] [PMC free article] [PubMed] [Google Scholar]
- Di Bisceglie AM. Hepatitis C. Lancet. 1998;351:351–355. doi: 10.1016/S0140-6736(97)07361-3. [DOI] [PubMed] [Google Scholar]
- Erickson AL, Kimura Y, Igarashi S, Eichelberger J, Houghton M, Sidney J, McKinney D, Sette A, Hughes AL, Walker CM. The outcome of hepatitis C virus infection is predicted by escape mutations in epitopes targeted by cytotoxic T lymphocytes. Immunity. 2001;15:883–895. doi: 10.1016/s1074-7613(01)00245-x. [DOI] [PubMed] [Google Scholar]
- Farci P, Alter HJ, Wong DC, Miller RH, Govindarajan S, Engle R, Shapiro M, Purcell RH. Prevention of hepatitis C virus infection in chimpanzees after antibody-mediated in vitro neutralization. Proc Natl Acad Sci U S A. 1994;91:7792–7796. doi: 10.1073/pnas.91.16.7792. [DOI] [PMC free article] [PubMed] [Google Scholar]
- Farci P, Shimoda A, Coiana A, Diaz G, Peddis G, Melpolder JC, Strazzera A, Chien DY, Munoz SJ, Balestrieri A, Purcell RH, Alter HJ. The outcome of acute hepatitis C predicted by the evolution of the viral quasispecies. Science. 2000;288:339–344. doi: 10.1126/science.288.5464.339. [DOI] [PubMed] [Google Scholar]
- Farci P, Shimoda A, Wong D, Cabezon T, De Gioannis D, Strazzera A, Shimizu Y, Shapiro M, Alter HJ, Purcell RH. Prevention of hepatitis C virus infection in chimpanzees by hyperimmune serum against the hypervariable region 1 of the envelope 2 protein. Proc Natl Acad Sci U S A. 1996;93:15394–15399. doi: 10.1073/pnas.93.26.15394. [DOI] [PMC free article] [PubMed] [Google Scholar]
- Farci P, Strazzera R, Alter HJ, Farci S, Degioannis D, Coiana A, Peddis G, Usai F, Serra G, Chessa L, Diaz G, Balestrieri A, Purcell RH. Early changes in hepatitis C viral quasispecies during interferon therapy predict the therapeutic outcome. Proc Natl Acad Sci U S A. 2002;99:3081–3086. doi: 10.1073/pnas.052712599. [DOI] [PMC free article] [PubMed] [Google Scholar]
- Fattovich G, Giustina G, Degos F, Tremolada F, Diodati G, Almasio P, Nevens F, Solinas A, Mura D, Brouwer JT, Thomas H, Njapoum C, Casarin C, Bonetti P, Fuschi P, Basho J, Tocco A, Bhalla A, Galassini R, Noventa F, Schalm SW, Realdi G. Morbidity and mortality in compensated cirrhosis type C: a retrospective follow-up study of 384 patients. Gastroenterology. 1997;112:463–472. doi: 10.1053/gast.1997.v112.pm9024300. [DOI] [PubMed] [Google Scholar]
- Felsenstein J. PHYLIP - Phylogeny Inference Package Version 3.5. Seattle, WA: Department of Genetics, University of Washington; 1993. [Google Scholar]
- Fournillier A, Wychowski C, Boucreux D, Baumert TF, Meunier JC, Jacobs D, Muguet S, Depla E, Inchauspe G. Induction of hepatitis C virus E1 envelope protein-specific immune response can be enhanced by mutation of N-glycosylation sites. J Virol. 2001;75:12088–12097. doi: 10.1128/JVI.75.24.12088-12097.2001. [DOI] [PMC free article] [PubMed] [Google Scholar]
- Garry RF, Dash S. Proteomics computational analyses suggest that hepatitis C virus E1 and pestivirus E2 envelope glycoproteins are truncated class II fusion proteins. Virology. 2003;307:255–265. doi: 10.1016/s0042-6822(02)00065-x. [DOI] [PubMed] [Google Scholar]
- Gaud U, Langer B, Petropoulou T, Thomas HC, Karayiannis P. Changes in hypervariable region 1 of the envelope 2 glycoprotein of hepatitis C virus in children and adults with humoral immune defects. J Med Virol. 2003;69:350–356. doi: 10.1002/jmv.10296. [DOI] [PubMed] [Google Scholar]
- Goffard A, Callens N, Bartosch B, Wychowski C, Cosset FL, Montpellier C, Dubuisson J. Role of N-linked glycans in the functions of hepatitis C virus envelope glycoproteins. J Virol. 2005;79:8400–8409. doi: 10.1128/JVI.79.13.8400-8409.2005. [DOI] [PMC free article] [PubMed] [Google Scholar]
- Goffard A, Dubuisson J. Glycosylation of hepatitis C virus envelope proteins. Biochimie. 2003;85:295–301. doi: 10.1016/s0300-9084(03)00004-x. [DOI] [PubMed] [Google Scholar]
- Gretch DR, Bacchi CE, Corey L, Dela Rosa C, Lesniewski RR, Kowdley K, Gown A, Frank I, Perkins JD, Carithers RL., Jr Persistent hepatitis C virus infection after liver transplantation: Clinical and virological features. Hepatology. 1995;22:1–9. [PubMed] [Google Scholar]
- Gretch DR, Polyak SJ, Wilson JJ, Carithers RL, Jr, Perkins JD, Corey L. Tracking hepatitis C virus quasispecies major and minor variants in symptomatic and asymptomatic liver transplant recipients. J Virol. 1996;70:7622–7631. doi: 10.1128/jvi.70.11.7622-7631.1996. [DOI] [PMC free article] [PubMed] [Google Scholar]
- Hiramatsu N, Hayashi N, Haruna Y, Kasahara A, Fusamoto H, Mori C, Fuke I, Okayama H, Kamada T. Immunohistochemical detection of hepatitis C virus-infected hepatocytes in chronic liver disease with monoclonal antibodies to core, envelope and NS3 regions of the hepatitis C virus genome. Hepatology. 1992;16:306–311. doi: 10.1002/hep.1840160205. [DOI] [PubMed] [Google Scholar]
- Holland J, Spindler K, Horodyski F, Grabau E, Nichol S, VandePol S. Rapid evolution of RNA genomes. Science. 1982;215:1577–1585. doi: 10.1126/science.7041255. [DOI] [PubMed] [Google Scholar]
- Houghton M, Weiner A, Han J, Kuo G, Choo QL. Molecular biology of the hepatitis C viruses: implications for diagnosis, development and control of viral disease. Hepatology. 1991;14:381–388. [PubMed] [Google Scholar]
- Hu KQ, Tong MJ. The long-term outcomes of patients with compensated hepatitis C virus-related cirrhosis and history of parenteral exposure in the United States. Hepatology. 1999;29:1311–1316. doi: 10.1002/hep.510290424. [DOI] [PubMed] [Google Scholar]
- Huang X, Barchi JJ, Jr, Lung FD, Roller PP, Nara PL, Muschik J, Garrity RR. Glycosylation affects both the three-dimensional structure and antibody binding properties of the HIV-1IIIB GP120 peptide RP135. Biochemistry. 1997;36:10846–10856. doi: 10.1021/bi9703655. [DOI] [PubMed] [Google Scholar]
- Ishak K, Baptista A, Bianchi L, Callea F, De Groote J, Gudat F, Denk H, Desmet V, Korb G, MacSween RN, et al. Histological grading and staging of chronic hepatitis. J Hepatol. 1995;22:696–699. doi: 10.1016/0168-8278(95)80226-6. [DOI] [PubMed] [Google Scholar]
- Kato N, Sekiya H, Ootsuyama Y, Nakazawa T, Hijikata M, Ohkoshi S, Shimotohno K. Humoral immune response to hypervariable region 1 of the putative envelope glycoprotein (gp70) of hepatitis C virus. J Virol. 1993;67:3923–3930. doi: 10.1128/jvi.67.7.3923-3930.1993. [DOI] [PMC free article] [PubMed] [Google Scholar]
- Khan MH, Farrell GC, Byth K, Lin R, Weltman M, George J, Samarasinghe D, Kench J, Kaba S, Crewe E, Liddle C. Which patients with hepatitis C develop liver complications? Hepatology. 2000;31:513–520. doi: 10.1002/hep.510310236. [DOI] [PubMed] [Google Scholar]
- Kim WR. The burden of hepatitis C in the United States. Hepatology. 2002;36:S30–S34. doi: 10.1053/jhep.2002.36791. [DOI] [PubMed] [Google Scholar]
- Knodell RG, Ishak KG, Black WC, Chen TS, Craig R, Kaplowitz N, Kiernan TW, Wollman J. Formulation and application of a numerical scoring system for assessing histological activity in asymptomatic chronic active hepatitis. Hepatology. 1981;1:431–435. doi: 10.1002/hep.1840010511. [DOI] [PubMed] [Google Scholar]
- Koizumi K, Enomoto N, Kurosaki M, Murakami T, Izumi N, Marumo F, Sato C. Diversity of quasispecies in various disease stages of chronic hepatitis C virus infection and its significance in interferon treatment. Hepatology. 1995;22:30–35. [PubMed] [Google Scholar]
- Korber B. HIV Signature and Sequence Variation Analysis. In: Rodrigo AG, Learn GH, editors. Computational Analysis of HIV Molecular Sequences. Dordrecht, Netherlands: Kluwer Academic Publishers; 2000. pp. 55–72. [Google Scholar]
- Korber B, Myers G. Signature pattern analysis: a method for assessing viral sequence relatedness. AIDS Res Hum Retroviruses. 1992;8:1549–1560. doi: 10.1089/aid.1992.8.1549. [DOI] [PubMed] [Google Scholar]
- Korber BT, Kunstman KJ, Patterson BK, Furtado M, McEvilly MM, Levy R, Wolinsky SM. Genetic differences between blood- and brain-derived viral sequences from human immunodeficiency virus type 1-infected patients: evidence of conserved elements in the V3 region of the envelope protein of brain-derived sequences. J Virol. 1994;68:7467–7481. doi: 10.1128/jvi.68.11.7467-7481.1994. [DOI] [PMC free article] [PubMed] [Google Scholar]
- Kumar U, Monjardino J, Thomas HC. Hypervariable region of hepatitis C virus envelope glycoprotein (E2/NS1) in an agammaglobulinemic patient. Gastroenterology. 1994;106:1072–1075. doi: 10.1016/0016-5085(94)90770-6. [DOI] [PubMed] [Google Scholar]
- Kurosaki M, Enomoto N, Marumo F, Sato C. Rapid sequence variation of the hypervariable region of hepatitis C virus during the course of chronic infection. Hepatology. 1993;18:1293–1299. [PubMed] [Google Scholar]
- Lemey P, Kosakovsky Pond SL, Drummond AJ, Pybus OG, Shapiro B, Barroso H, Taveira N, Rambaut A. Synonymous substitution rates predict HIV disease progression as a result of underlying replication dynamics. PLoS Comput Biol. 2007;3:e29. doi: 10.1371/journal.pcbi.0030029. [DOI] [PMC free article] [PubMed] [Google Scholar]
- Li Y, Luo L, Rasool N, Kang CY. Glycosylation is necessary for the correct folding of human immunodeficiency virus gp120 in CD4 binding. J Virol. 1993;67:584–588. doi: 10.1128/jvi.67.1.584-588.1993. [DOI] [PMC free article] [PubMed] [Google Scholar]
- Lindenbach BDaR, C M. Flaviviridae: the viruses and their replication. In: Knipe DM, Howley PM, editors. Fields Virology. 4th ed. Philadelphia, PA: Lippincott Williams & Wikins; 2001. pp. 991–1041. [Google Scholar]
- Lu L, Nakano T, Orito E, Mizokami M, Robertson BH. Evaluation of accumulation of hepatitis C virus mutations in a chronically infected chimpanzee: comparison of the core, E1, HVR1, and NS5b regions. J Virol. 2001;75:3004–3009. doi: 10.1128/JVI.75.6.3004-3009.2001. [DOI] [PMC free article] [PubMed] [Google Scholar]
- Lyra AC, Fan X, Lang DM, Yusim K, Ramrakhiani S, Brunt EM, Korber B, Perelson AS, Di Bisceglie AM. Evolution of hepatitis C viral quasispecies after liver transplantation. Gastroenterology. 2002;123:1485–1493. doi: 10.1053/gast.2002.36546. [DOI] [PubMed] [Google Scholar]
- Martell M, Esteban JI, Quer J, Genesca J, Weiner A, Esteban R, Guardia J, Gomez J. Hepatitis C virus (HCV) circulates as a population of different but closely related genomes: quasispecies nature of HCV genome distribution. J Virol. 1992;66:3225–3229. doi: 10.1128/jvi.66.5.3225-3229.1992. [DOI] [PMC free article] [PubMed] [Google Scholar]
- McAllister J, Casino C, Davidson F, Power J, Lawlor E, Yap PL, Simmonds P, Smith DB. Long-term evolution of the hypervariable region of hepatitis C virus in a common-source-infected cohort. J Virol. 1998;72:4893–4905. doi: 10.1128/jvi.72.6.4893-4905.1998. [DOI] [PMC free article] [PubMed] [Google Scholar]
- McMahon BJ, Hennessy TW, Christensen C, Bruden D, Sullivan DG, Homan C, Deubner H, Bruce MG, Livingston S, Williams J, Gretch DR. Epidemiology and risk factors for hepatitis C in Alaska Natives. Hepatology. 2004;39:325–332. doi: 10.1002/hep.20046. [DOI] [PubMed] [Google Scholar]
- Meunier JC, Fournillier A, Choukhi A, Cahour A, Cocquerel L, Dubuisson J, Wychowski C. Analysis of the glycosylation sites of hepatitis C virus (HCV) glycoprotein E1 and the influence of E1 glycans on the formation of the HCV glycoprotein complex. J Gen Virol. 1999;80(Pt 4):887–896. doi: 10.1099/0022-1317-80-4-887. [DOI] [PubMed] [Google Scholar]
- Morishima C, Polyak SJ, Ray R, Doherty MC, Di Bisceglie AM, Malet PF, Bonkovsky HL, Sullivan DG, Gretch DR, Rothman AL, Koziel MJ, Lindsay KL. Hepatitis C virus-specific immune responses and quasi-species variability at baseline are associated with nonresponse to antiviral therapy during advanced hepatitis C. J Infect Dis. 2006;193:931–940. doi: 10.1086/500952. [DOI] [PubMed] [Google Scholar]
- Nei M, Gojobori T. Simple methods for estimating the numbers of synonymous and nonsynonymous nucleotide substitutions. Mol Biol Evol. 1986;3:418–426. doi: 10.1093/oxfordjournals.molbev.a040410. [DOI] [PubMed] [Google Scholar]
- Neumann AU, Lam NP, Dahari H, Gretch DR, Wiley TE, Layden TJ, Perelson AS. Hepatitis C viral dynamics in vivo and the antiviral efficacy of interferon-alpha therapy. Science. 1998;282:103–107. doi: 10.1126/science.282.5386.103. [DOI] [PubMed] [Google Scholar]
- Nowak M, May RM. Virus dynamics. New York: Oxford University Press; 2000. [Google Scholar]
- Op De Beeck A, Montserret R, Duvet S, Cocquerel L, Cacan R, Barberot B, Le Maire M, Penin F, Dubuisson J. The transmembrane domains of hepatitis C virus envelope glycoproteins E1 and E2 play a major role in heterodimerization. J Biol Chem. 2000;275:31428–31437. doi: 10.1074/jbc.M003003200. [DOI] [PubMed] [Google Scholar]
- Pal S, Shuhart MC, Thomassen L, Emerson SS, Su T, Feuerborn N, Kae J, Gretch DR. Intrahepatic hepatitis C virus replication correlates with chronic hepatitis C disease severity in vivo. J Virol. 2006;80:2280–2290. doi: 10.1128/JVI.80.5.2280-2290.2006. [DOI] [PMC free article] [PubMed] [Google Scholar]
- Pawlotsky JM, Pellerin M, Bouvier M, Roudot-Thoraval F, Germanidis G, Bastie A, Darthuy F, Remire J, Soussy CJ, Dhumeaux D. Genetic complexity of the hypervariable region 1 (HVR1) of hepatitis C virus (HCV): influence on the characteristics of the infection and responses to interferon alfa therapy in patients with chronic hepatitis C. J Med Virol. 1998;54:256–264. [PubMed] [Google Scholar]
- Pazos F, Ranea JA, Juan D, Sternberg MJ. Assessing protein co-evolution in the context of the tree of life assists in the prediction of the interactome. J Mol Biol. 2005;352:1002–1015. doi: 10.1016/j.jmb.2005.07.005. [DOI] [PubMed] [Google Scholar]
- Pazos F, Valencia A. Similarity of phylogenetic trees as indicator of protein-protein interaction. Protein Eng. 2001;14:609–614. doi: 10.1093/protein/14.9.609. [DOI] [PubMed] [Google Scholar]
- Pelletier SJ, Raymond DP, Crabtree TD, Iezzoni JC, Sawyer RG, Hahn YS, Pruett TL. Pretransplantation hepatitis C virus quasispecies may be predictive of outcome after liver transplantation. Hepatology. 2000;32:375–381. doi: 10.1053/jhep.2000.9089. [DOI] [PubMed] [Google Scholar]
- Penin F, Combet C, Germanidis G, Frainais PO, Deleage G, Pawlotsky JM. Conservation of the conformation and positive charges of hepatitis C virus E2 envelope glycoprotein hypervariable region 1 points to a role in cell attachment. J Virol. 2001;75:5703–5710. doi: 10.1128/JVI.75.12.5703-5710.2001. [DOI] [PMC free article] [PubMed] [Google Scholar]
- Polyak SJ, Faulkner G, Carithers RL, Jr, Corey L, Gretch DR. Assessment of hepatitis C virus quasispecies heterogeneity by gel shift analysis: correlation with response to interferon therapy. J Infect Dis. 1997;175:1101–1107. doi: 10.1086/516448. [DOI] [PubMed] [Google Scholar]
- Polyak SJ, McArdle S, Liu SL, Sullivan DG, Chung M, Hofgartner WT, Carithers RL, Jr, McMahon BJ, Mullins JI, Corey L, Gretch DR. Evolution of hepatitis C virus quasispecies in hypervariable region 1 and the putative interferon sensitivity-determining region during interferon therapy and natural infection. J Virol. 1998;72:4288–4296. doi: 10.1128/jvi.72.5.4288-4296.1998. [DOI] [PMC free article] [PubMed] [Google Scholar]
- Poynard T, Bedossa P, Opolon P. Natural history of liver fibrosis progression in patients with chronic hepatitis C. The OBSVIRC, METAVIR, CLINIVIR, and DOSVIRC groups. Lancet. 1997;349:825–832. doi: 10.1016/s0140-6736(96)07642-8. [DOI] [PubMed] [Google Scholar]
- Qin H, Shire NJ, Keenan ED, Rouster SD, Eyster ME, Goedert JJ, Koziel MJ, Sherman KE. HCV quasispecies evolution: association with progression to end-stage liver disease in hemophiliacs infected with HCV or HCV/HIV. Blood. 2005;105:533–541. doi: 10.1182/blood-2004-04-1452. [DOI] [PubMed] [Google Scholar]
- Ray SC, Wang YM, Laeyendecker O, Ticehurst JR, Villano SA, Thomas DL. Acute hepatitis C virus structural gene sequences as predictors of persistent viremia: hypervariable region 1 as a decoy. J Virol. 1999;73:2938–2946. doi: 10.1128/jvi.73.4.2938-2946.1999. [DOI] [PMC free article] [PubMed] [Google Scholar]
- International Committee on Virus Taxonomy. Robertson B, Myers G, Howard C, Brettin T, Bukh J, Gaschen B, Gojobori T, Maertens G, Mizokami M, Nainan O, Netesov S, Nishioka K, Shin i T, Simmonds P, Smith D, Stuyver L, Weiner A. Classification, nomenclature, and database development for hepatitis C virus (HCV) and related viruses: proposals for standardization. Arch Virol. 1998;143:2493–2503. doi: 10.1007/s007050050479. [DOI] [PubMed] [Google Scholar]
- Rosa D, Campagnoli S, Moretto C, Guenzi E, Cousens L, Chin M, Dong C, Weiner AJ, Lau JY, Choo QL, Chien D, Pileri P, Houghton M, Abrignani S. A quantitative test to estimate neutralizing antibodies to the hepatitis C virus: cytofluorimetric assessment of envelope glycoprotein 2 binding to target cells. Proc Natl Acad Sci U S A. 1996;93:1759–1763. doi: 10.1073/pnas.93.5.1759. [DOI] [PMC free article] [PubMed] [Google Scholar]
- Rosen HR, Hinrichs DJ, Gretch DR, Koziel MJ, Chou S, Houghton M, Rabkin J, Corless CL, Bouwer HG. Association of multispecific CD4(+) response to hepatitis C and severity of recurrence after liver transplantation. Gastroenterology. 1999;117:926–932. doi: 10.1016/s0016-5085(99)70352-5. [DOI] [PubMed] [Google Scholar]
- Saitou N, Nei M. The neighbor-joining method: a new method for reconstructing phylogenetic trees. Mol Biol Evol. 1987;4:406–425. doi: 10.1093/oxfordjournals.molbev.a040454. [DOI] [PubMed] [Google Scholar]
- Sanchez-Fueyo A, Gimenez-Barcons M, Puig-Basagoiti F, Rimola A, Sanchez-Tapias JM, Saiz JC, Rodes J. Influence of the dynamics of the hypervariable region 1 of hepatitis C virus (HCV) on the histological severity of HCV recurrence after liver transplantation. J Med Virol. 2001;65:266–275. doi: 10.1002/jmv.2029. [DOI] [PubMed] [Google Scholar]
- Scheuer PJ, Standish RA, Dhillon AP. Scoring of chronic hepatitis. Clin Liver Dis. 2002;6:335–347. doi: 10.1016/s1089-3261(02)00009-0. v–vi. [DOI] [PubMed] [Google Scholar]
- Seo TK, Kishino H, Thorne JL. Estimating absolute rates of synonymous and nonsynonymous nucleotide substitution in order to characterize natural selection and date species divergences. Mol Biol Evol. 2004;21:1201–1213. doi: 10.1093/molbev/msh088. [DOI] [PubMed] [Google Scholar]
- Serfaty L, Aumaitre H, Chazouilleres O, Bonnand AM, Rosmorduc O, Poupon RE, Poupon R. Determinants of outcome of compensated hepatitis C virus-related cirrhosis. Hepatology. 1998;27:1435–1440. doi: 10.1002/hep.510270535. [DOI] [PubMed] [Google Scholar]
- Sheridan I, Pybus OG, Holmes EC, Klenerman P. High-resolution phylogenetic analysis of hepatitis C virus adaptation and its relationship to disease progression. J Virol. 2004;78:3447–3454. doi: 10.1128/JVI.78.7.3447-3454.2004. [DOI] [PMC free article] [PubMed] [Google Scholar]
- Shimizu YK, Hijikata M, Iwamoto A, Alter HJ, Purcell RH, Yoshikura H. Neutralizing antibodies against hepatitis C virus and the emergence of neutralization escape mutant viruses. J Virol. 1994;68:1494–1500. doi: 10.1128/jvi.68.3.1494-1500.1994. [DOI] [PMC free article] [PubMed] [Google Scholar]
- Shimizu YK, Igarashi H, Kiyohara T, Cabezon T, Farci P, Purcell RH, Yoshikura H. A hyperimmune serum against a synthetic peptide corresponding to the hypervariable region 1 of hepatitis C virus can prevent viral infection in cell cultures. Virology. 1996;223:409–412. doi: 10.1006/viro.1996.0497. [DOI] [PubMed] [Google Scholar]
- Simmonds P. Variability of hepatitis C virus. Hepatology. 1995;21:570–583. doi: 10.1002/hep.1840210243. [DOI] [PMC free article] [PubMed] [Google Scholar]
- Sobolev BN, Poroikov VV, Olenina LV, Kolesanova EF, Archakov AI. Comparative analysis of amino acid sequences from envelope proteins isolated from different hepatitis C virus variants: possible role of conservative and variable regions. J Viral Hepat. 2000;7:368–374. doi: 10.1046/j.1365-2893.2000.00242.x. [DOI] [PubMed] [Google Scholar]
- Sullivan DG, Bruden D, Deubner H, McArdle S, Chung M, Christensen C, Hennessy T, Homan C, Williams J, McMahon BJ, Gretch DR. Hepatitis C Virus Dynamics during Natural Infection Are Associated with Long-Term Histological Outcome of Chronic Hepatitis C Disease. J Infect Dis. 2007;196:239–248. doi: 10.1086/518895. [DOI] [PubMed] [Google Scholar]
- Sullivan DG, Wilson JJ, Carithers RL, Jr, Perkins JD, Gretch DR. Multigene tracking of hepatitis C virus quasispecies after liver transplantation: correlation of genetic diversification in the envelope region with asymptomatic or mild disease patterns. J Virol. 1998;72:10036–10043. doi: 10.1128/jvi.72.12.10036-10043.1998. [DOI] [PMC free article] [PubMed] [Google Scholar]
- Thompson JD, Higgins DG, Gibson TJ. CLUSTAL W: improving the sensitivity of progressive multiple sequence alignment through sequence weighting, position-specific gap penalties and weight matrix choice. Nucleic Acids Res. 1994;22:4673–4680. doi: 10.1093/nar/22.22.4673. [DOI] [PMC free article] [PubMed] [Google Scholar]
- van Doorn LJ, Capriles I, Maertens G, DeLeys R, Murray K, Kos T, Schellekens H, Quint W. Sequence evolution of the hypervariable region in the putative envelope region E2/NS1 of hepatitis C virus is correlated with specific humoral immune responses. J Virol. 1995;69:773–778. doi: 10.1128/jvi.69.2.773-778.1995. [DOI] [PMC free article] [PubMed] [Google Scholar]
- Villano SA, Vlahov D, Nelson KE, Cohn S, Thomas DL. Persistence of viremia and the importance of long-term follow-up after acute hepatitis C infection. Hepatology. 1999;29:908–914. doi: 10.1002/hep.510290311. [DOI] [PubMed] [Google Scholar]
- Wack A, Soldaini E, Tseng C, Nuti S, Klimpel G, Abrignani S. Binding of the hepatitis C virus envelope protein E2 to CD81 provides a co-stimulatory signal for human T cells. Eur J Immunol. 2001;31:166–175. doi: 10.1002/1521-4141(200101)31:1<166::aid-immu166>3.0.co;2-l. [DOI] [PubMed] [Google Scholar]
- Wang XH, Netski DM, Astemborski J, Mehta SH, Torbenson MS, Thomas DL, Ray SC. Progression of fibrosis during chronic hepatitis C is associated with rapid virus evolution. J Virol. 2007;81:6513–6522. doi: 10.1128/JVI.02276-06. [DOI] [PMC free article] [PubMed] [Google Scholar]
- Wei X, Decker JM, Wang S, Hui H, Kappes JC, Wu X, Salazar-Gonzalez JF, Salazar MG, Kilby JM, Saag MS, Komarova NL, Nowak MA, Hahn BH, Kwong PD, Shaw GM. Antibody neutralization and escape by HIV-1. Nature. 2003;422:307–312. doi: 10.1038/nature01470. [DOI] [PubMed] [Google Scholar]
- Weiner AJ, Brauer MJ, Rosenblatt J, Richman KH, Tung J, Crawford K, Bonino F, Saracco G, Choo QL, Houghton M, et al. Variable and hypervariable domains are found in the regions of HCV corresponding to the flavivirus envelope and NS1 proteins and the pestivirus envelope glycoproteins. Virology. 1991;180:842–848. doi: 10.1016/0042-6822(91)90104-j. [DOI] [PubMed] [Google Scholar]
- Weiner AJ, Geysen HM, Christopherson C, Hall JE, Mason TJ, Saracco G, Bonino F, Crawford K, Marion CD, Crawford KA, et al. Evidence for immune selection of hepatitis C virus (HCV) putative envelope glycoprotein variants: potential role in chronic HCV infections. Proc Natl Acad Sci U S A. 1992;89:3468–3472. doi: 10.1073/pnas.89.8.3468. [DOI] [PMC free article] [PubMed] [Google Scholar]
- WHO. Global surveillance and control of hepatitis C. J Viral Hepat. 1999;6:35–47. [PubMed] [Google Scholar]
- Wilson JJ, Polyak SJ, Day TD, Gretch DR. Characterization of simple and complex hepatitis C virus quasispecies by heteroduplex gel shift analysis: correlation with nucleotide sequencing. J Gen Virol. 1995;76(Pt 7):1763–1771. doi: 10.1099/0022-1317-76-7-1763. [DOI] [PubMed] [Google Scholar]
- Wu Z, Kayman SC, Honnen W, Revesz K, Chen H, Vijh-Warrier S, Tilley SA, McKeating J, Shotton C, Pinter A. Characterization of neutralization epitopes in the V2 region of human immunodeficiency virus type 1 gp120: role of glycosylation in the correct folding of the V1/V2 domain. J Virol. 1995;69:2271–2278. doi: 10.1128/jvi.69.4.2271-2278.1995. [DOI] [PMC free article] [PubMed] [Google Scholar]
- Yagnik AT, Lahm A, Meola A, Roccasecca RM, Ercole BB, Nicosia A, Tramontano A. A model for the hepatitis C virus envelope glycoprotein E2. Proteins. 2000;40:355–366. doi: 10.1002/1097-0134(20000815)40:3<355::aid-prot20>3.0.co;2-k. [DOI] [PubMed] [Google Scholar]
- Zibert A, Meisel H, Kraas W, Schulz A, Jung G, Roggendorf M. Early antibody response against hypervariable region 1 is associated with acute self-limiting infections of hepatitis C virus. Hepatology. 1997;25:1245–1249. doi: 10.1002/hep.510250530. [DOI] [PubMed] [Google Scholar]
- Zibert A, Schreier E, Roggendorf M. Antibodies in human sera specific to hypervariable region 1 of hepatitis C virus can block viral attachment. Virology. 1995;208:653–661. doi: 10.1006/viro.1995.1196. [DOI] [PubMed] [Google Scholar]