

Abstract
The short-range stiffness (SRS) of skeletal muscles is a critical property for understanding muscle contributions to limb stability, since it represents a muscle’s capacity to resist external perturbations before reflexes or voluntary actions can intervene. A number of studies have demonstrated that a simple model, consisting of a force-dependent active stiffness connected in series with a constant passive stiffness, is sufficient to characterize the SRS of individual muscles over the entire range of obtainable forces. The purpose of this study was to determine if such a model could be used to characterize the SRS-force relationship in a number of architecturally distinct muscles. Specifically, we hypothesized that the active and passive stiffness components for a specific muscle can be estimated from anatomical measurements, assuming uniform active and passive stiffness properties across all muscles. This hypothesis was evaluated in six feline lower hindlimb muscle types with different motor unit compositions and architectures. The SRS-force relationships for each muscle type were predicted based on anatomical measurements and compared to experimental data. The model predictions were accurate to within 30%, when uniform scaling properties were assumed across all muscles. Errors were greatest for the extensor digitorum longus (EDL). When this muscle was removed from the analysis, prediction errors dropped to less than 8%. Subsequent analyses suggested that these errors may have resulted from differences in the tendon elastic modulus, as compared to the other muscles tested.
Keywords: Stiffness, Force, Model, Architecture, Muscle
INTRODUCTION
The initial response of an isometrically contracting muscle to short, quick stretches or releases is characterized by a linear relationship between the change in muscle force and the change in muscle length. This property, referred to as short-range stiffness (SRS), describes the initial response of a muscle to external perturbations of length, prior to changes in activation mediated through reflexive or voluntary mechanisms. SRS plays an important role in the control of muscle and limb stability (Kirsch et al. 1994; Perreault et al. 2004). However, estimating muscle contributions to limb stiffness remains difficult, since these contributions cannot be measured directly in an intact system. If the stiffness properties of muscle and tendon are uniform across a wide range of muscles, it may be possible to estimate SRS from architectural parameters that can be measured noninvasively, thereby providing a means to characterize the contributions of individual muscles to the stiffness and stability properties of a limb. Current muscle models commonly used in musculoskeletal simulations do not predict this important property. If SRS can be successfully estimated from anatomical parameters, then the series elastic elements used in these models could be appropriately adapted.
The SRS of a muscle depends on the force-dependent SRS of its contractile elements and the material properties of its passive tendinous structures. Morgan (1977) proposed a simple model based on muscle fibers in series with a tendon. This model worked well in cat soleus (SOL) (Morgan 1977) and medial gastrocnemius (MG) (Cui et al. 2007) muscles.
A number of studies indicate that it may be possible to assume uniform active and passive stiffness properties for a wide range of muscles. Muscle fiber stiffness varies linearly with muscle force (Morgan 1977), and the force generating capacity of individual muscles can be estimated from architectural measurements alone (Powell et al. 1984; Sacks and Roy 1982). Although SRS varies with muscle fiber type (Horchollebossavit et al. 1990; Malamud et al. 1996; Proske and Rack 1976), these differences do not play a significant role at the whole muscle level (Cui et al. 2007). Together, these findings suggest that anatomical properties may be sufficient for estimating the active stiffness contributions of a muscle. This also may be true for the passive components. Tendinous structures contribute to passive stiffness and the stiffness of these tissues is determined by their material properties and geometry. Studies on excised mammalian tendons (Bennett et al. 1986; Pollock and Shadwick 1994) have shown that the average elastic modulus is relatively constant, ranging from 0.9 GPa to 1.8 GPa. Less is known about the material properties of the aponeurosis, which often has been assumed to have properties similar to the external tendon (Scott and Loeb 1995). Since the stiffness of tendinous structures contributes mainly at higher muscle forces (Cui et al. 2007), these uncertainties may not be critical for many muscles.
The purpose of the study was to evaluate how well SRS could be estimated from the architectural parameters of a muscle and its tendinous structures. Specifically, we tested the hypothesis that the active and passive stiffness components for a given muscle can be estimated from anatomical measurements, assuming that active and passive stiffness properties are uniform across all muscles. If so, this would allow SRS to be estimated for muscles that cannot be measured directly, as is necessary for most human studies.
METHODS
Data were collected from 13 adult cats (weight: 2.7 – 4.1 kg; either sex). All procedures were approved by the Animal Care Committee of Northwestern University and conformed to policies set by the National Institutes of Health. 16 experiments were conducted on 6 different muscles types: 2 SOL, 3 MG, 2 plantaris (PLA), 2 tibialis anterior (TA), 5 extensor digitorum longus (EDL), and 2 flexor hallicis longus (FHL). A group of 8 muscles (see Table 1A), for which all anatomical parameters were measured, was used to derive the model parameters (group A). Because measuring fiber length is difficult a second group of muscles was studied (group B). Here, fiber length was estimated from muscle weight. Because group B muscle were taken from different cats than group A muscles, analysis of group B increases the sample size and helps assure the results were not a result of experimental error or anomalies in experimental procedures. However, because group B was comprised of the same muscle types as in group A, they can’t be considered as independent verification of the model.
Table 1.
Table 1-A: Muscles with fascicle length measurements;
Table 1-B: Muscles with fascicle length scaled;
| Muscles | ID | W (g) | lF (mm) | lT (mm) | AT1 (mm2) | AT2 (mm2) | θ* (deg) | Po (N) | stress at Po (MPa) |
|---|---|---|---|---|---|---|---|---|---|
| SOL | 1 | 4.30 | 36.63±3.42 | 64.94 | 2.83 | - | 7 | 24.4 | 8.6 |
| EDL | 2 | 4.10 | 29.92±0.60 | 109.05 | 2.98 | 2.75±0.62 | 8 | 29.6 | 9.9 |
| 3 | 3.78 | 32.74±2.37 | 103.51 | 2.76 | - | 8 | 24.1 | 8.7 | |
| 4 | 3.43 | 28.45±1.52 | 100.89 | 2.15 | - | 8 | 21.3 | 9.9 | |
| TA | 5 | 7.62 | 55.23±6.67 | 68.78 | 2.06 | 2.40±0.55 | 7 | 31.9 | 15.5 |
| PLA | 6 | 6.61 | 20.19±0.86 | 96.06 | 5.06 | 4.95±1.22 | 14 | 46.2 | 9.1 |
| MG | 7 | 9.90 | 21.57±1.31 | 98.36 | 5.67 | 5.71±2.34 | 21 | 97.9 | 17.3 |
| FHL | 8 | 4.21 | 13.50±0.81 | 57.40 | 2.85 | 2.75±0.59 | 7 | 52.5 | 18.4 |
| Muscles | ID | W (g) | lF ** (mm) | lT (mm) | AT1 (mm2) | AT2 (mm2) | θ* (deg) | Po (N) | stress at Po (MPa) |
| SOL | 9 | 4.20 | 36.43 | 53.39 | 2.80 | - | 7 | 20.1 | 7.2 |
| EDL | 10 | 4.10 | 30.97 | 104.25 | 2.85 | - | 8 | 30.4 | 10.7 |
| 11 | 3.95 | 30.71 | 100.53 | 2.81 | - | 8 | 22.7 | 8.1 | |
| TA | 12 | 7.12 | 54.37 | 50.86 | 1.73 | - | 7 | 29.1 | 16.8 |
| PLA | 13 | 7.70 | 20.91 | 90.03 | 5.25 | - | 14 | 87.5 | 16.7 |
| MG | 14 | 16.20 | 24.16 | 83.97 | 9.65 | - | 21 | 152.6 | 15.8 |
| 15 | 8.30 | 20.71 | 94.22 | 5.25 | - | 21 | 87.9 | 16.7 | |
| FHL | 16 | 4.65 | 13.81 | 57.76 | 3.16 | - | 7 | 54.8 | 17.3 |
Table 1. The anatomical parameters (lF: mean ± SD) used in the model. Maximum experimental force (Po) and estimated tendon stress at Po included. Muscles, of which fascicle lengths were measured, were grouped into Table 1-A; the ones, of which fascicle lengths were scaled, were grouped into Table 1-B.
Approach 1, calculated by weight of external tendon.
Approach 2, calculated based on digital caliper measurements and interpolation.
Scaled from the measured mean fascicle length of the homologous muscle in Table 1-A.
Surgical Procedures
Initial surgical preparations were done under deep gaseous anesthesia (1.5 – 3.0% isoflurane in a 3:1 mixture of O2 and NO2). Sodium pentobarbital (i.v.) was used for the rest of the experiment (Sandercock and Heckman 2001). The cat was mounted in a rigid frame with the femur and foot secured with metal pins. The target muscle was carefully isolated from the surrounding tissues, preserving the innervation and blood supply. For MG, SOL, TA and PLA, a piece of bone was left attached to the distal tendon to secure it to the testing apparatus. For EDL and FHL, the tendon was cut from the insertion site, looped and tied to the testing apparatus. The exposed muscle and tendon were kept moist with saline. Radiant heat and a heating pad were used to maintain hindlimb and core temperatures within physiological limits.
Experimental Protocols
SRS was measured (Kmeas) using ramp displacements of the muscle-tendon unit (MTU) during the plateau phase of an isometric contraction (Cui et al. 2007). Muscle contraction was controlled using supramaximal electrical stimulation applied through intramuscular electrodes. A linear puller (Copley ThrustTube TB3806; Copley Controls Corp) was used to control and measure (RGH24; Renishaw,) MTU length. A force transducer (Model 31; Honeywell Sensotec) in series with the puller was used to measure the resulting force. The stiffness of the linear puller in series with the force transducer was 250 N/mm and, therefore, considered to be negligible for assessment of SRS.
For each SRS trial, the muscle was excited by a 100 Hz stimulation train for 0.5 seconds. Muscle stretches (amplitude 2 mm, velocity 100 mm/sec) were imposed 0.4 seconds after stimulation onset, when muscle force had reached a steady level. A 60-s rest period was imposed between all trials to minimize muscle fatigue. Fatigue was monitored by replication and comparison of trials. SRS was measured at various forces, obtained by changing MTU length. The range of MTU lengths used depended on the length-tension relationship of the specific muscle, but lengths that involved substantial passive forces were not included. Previous experiments have shown that the SRS is only force dependent, but not length dependent (Morgan 1977). SRS was measured from the constant-velocity portion of the applied perturbation before the onset of yielding (Fig. 1).
Figure 1.
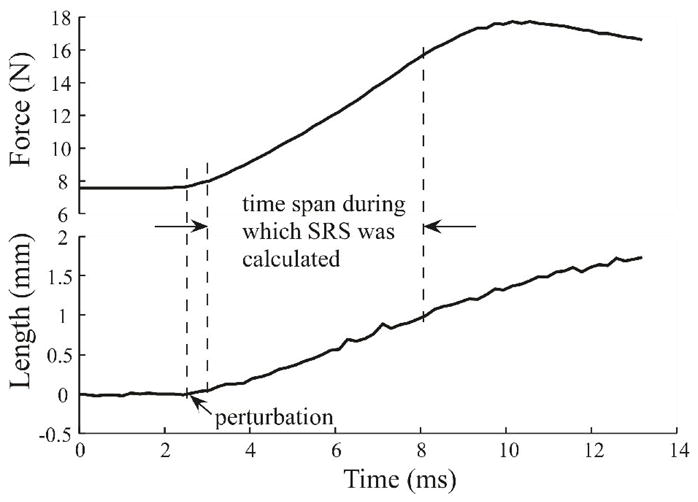
Calculation of SRS. Figure shows muscle force and length as a function of time during the perturbation. A linear regression was conducted between the force data and the length data during the indicated linear portion of the force-time waveform. SRS was calculated as the slope of the linear regression line.
Anatomical Measurements
MTU length (lMTU), distal external tendon length (lEXT) and distal aponeurosis length (lA) were measured at optimal muscle length (L0) using a digital caliper. The average cross-sectional area (CSA) of the external tendon (AT) was determined using two methods: (i) The distal external tendon was surgically removed and weighed (WT) to estimate AT:
| (1) |
where ρT is the density of the tendon, 1.12g × 10−3/mm3 (Ker 1981); (ii) The CSA was measured at 5 equally spaced locations along the distal external tendon (Fig. 2) and the results were averaged to obtain AT (n = 5 muscles).
Figure 2.

Determination of the tendon cross-sectional area (the second approach). The diameter of the external tendon was measured at 45° intervals around the circumference at five locations evenly distributed along the external tendon. The measured diameters were interpolated to obtain the approximated tendon CSA at each location and an average tendon CSA was then calculated from these five estimates.
After each experiment, the muscle was fixed for at least 24 hours in a 10% formalin solution. Subsequently, the connective tissue was mildly digested in a 30% nitric acid solution for 24 hours. Three complete fascicle bundles were removed from the distal, middle and proximal regions of the muscle belly. Fascicle lengths for each bundle were normalized to optimum feline sarcomere length (2.43 μm, Burkholder and Lieber 2001). Using light microscopy (×640), sarcomere length was measured at five different locations along the length of each fascicle and then averaged to obtain a single normalization factor for each fascicle. This procedure was used to obtain optimal fascicle length (lF) in 8 muscles (Group A, Table 1-A). The lF of the 8 other muscles (Group B) was estimated from muscle wet weight W by the following scaling relationship:
| (2) |
For each muscle, the proportionality constant was determined using the measured lF and W of the same muscle in group A. This relationship has been reported for scaling muscle fascicle length to animal body weight (Alexander et al. 1979). We assumed that muscle weight scales proportionally with respect to animal body weight. The pennation angles were obtained from the literature (Sacks and Roy 1982).
Modeling
SRS (Kmdl) was modeled over a range of muscle forces (P), i.e. from 0 to predicted optimum force, P0 (see equation 8). It was assumed that SRS arises from the serial linkage of muscle fiber stiffness, KM, and tendon stiffness, KT (Cui et al. 2007; Morgan 1977):
| (3) |
Muscle fiber stiffness was assumed to be inversely proportional to lF and directly proportional to P (Walmsley and Proske 1981), as indicated by the following equation:
| (4) |
Tendon stiffness was assumed to be a function of the effective tendon length (lT) and AT, as shown below, where E is the tendon elastic modulus:
| (5) |
lT was used to consider the external tendon and the aponeurosis; AT was assumed to be the same for both of these tendinous structures. For all muscles except FHL, lT was defined as the total tendinous tissue length connected in series with a single muscle fiber (Fig. 3A):
| (6) |
Figure 3.
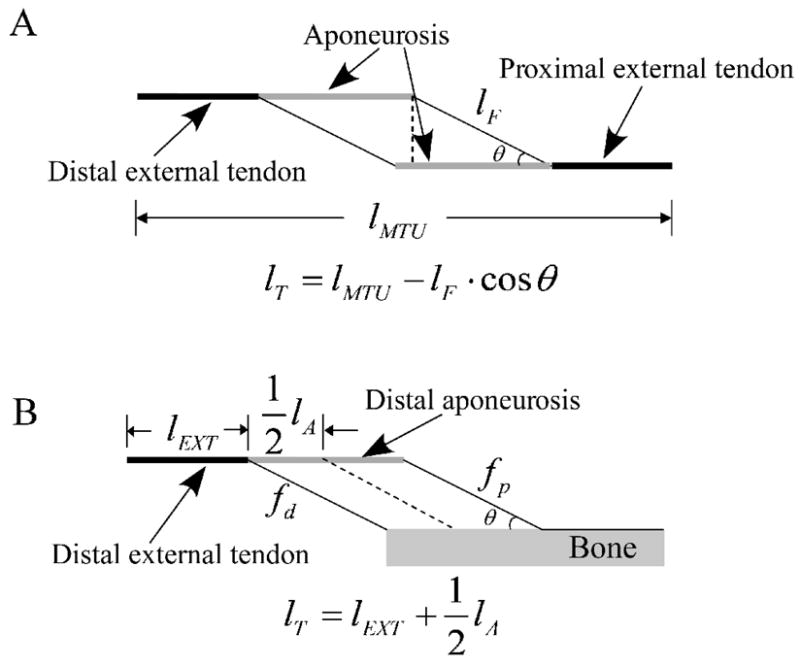
The effective tendon length calculation. A: Muscles except FHL. The effective tendon length was assumed to be the total tendon length in series with one muscle fiber; B: FHL. Since the muscle fibers originate from rigid bone structures, the effective tendon length was assumed to be the mean tendon length in series with one muscle fiber.
In contrast to the other muscles tested, most proximal FHL fibers directly originate from the bones underneath the muscle. As a result, lT varies between fibers (Fig. 3B). Therefore, we used the mean lT for this muscle:
| (7) |
The optimum force (P0) of each muscle was estimated using the same method presented by Powell et al. (1984):
| (8) |
where θ is the pennation angle, ρM is the density of the muscle (1.0564 g/cm3) and ps is the specific tension (22.5 N/cm2).
Parameter Estimation
A nonlinear optimization algorithm was used to estimate a single set of parameters, γ and E, to describe the SRS-force data measured from all Group A muscles. The error function used in the optimization is shown in Eq. 9, in which i indicates the muscle type, j the separate experiments for each muscle type and k the data points for each specific experiment. To give each muscle type equal weight during the optimization process, the error between the modeled ( ) and measured ( ) SRS was scaled by the maximum SRS from each experiment ( ). The squared error also was scaled by the number of data points collected from each experiment (mi,j) and the number of muscles tested for each muscle type (ni). This latter parameter only was relevant for the EDL, for which three muscles were evaluated.
| (9) |
The estimated parameters, γ and E, were then used to predict the SRS-force relationship of the muscles in Group B for which lF was not measured directly. This analysis had multiple purposes: (1) to add another 8 muscles for which the measured and modeled results were compared; (2) to indirectly assess how accurate lF was estimated based on muscle weight (Eq. 2).
Error bounds were calculated to evaluate the sensitivity of the model to measurement errors in optimal fascicle length and tendon CSA. The error of lF and AT was approximated by the mean coefficient of variation (COV) of these measurements. For Group A and B, the relative error for the estimated SRS and optimum force was defined as the magnitude of the difference between modeled and measured values normalized by measured value. The ability of a single set of parameters to generalize across muscle types was assessed using a jackknife analysis (Politis 1998), whereby different subsets of muscles were used for parameter estimation and model validation.
Statistics
The two methods to assess AT were compared using a paired t-test. Linear regression was used to compare the measured and modeled SRS (normalized by the maximum value) for all muscles. The regressed line was compared to the identity line (slope of 1.0 and intercept of 0.0) to determine if there was a significant difference between the modeled and measured data. The same statistical analysis was done to compare the anatomically estimated and experimentally measured P0. Note that PLA (#6) was excluded from this analysis because the muscle was stimulated submaximally, which resulted in a much lower maximum isometric force than the model predicted (Eq. 8). All numerical analyses were conducted in MATLAB (The Mathworks, Natick, MA) and all statistical tests were conducted with a significance level of 0.05.
RESULTS
The anatomical muscle parameters used to predict SRS are shown in Table 1. We found no significant difference between both methods for assessing AT (p = 0.91). The COV for lF (Table 1-A) within muscles ranged from 2.0% to 12.1% with a mean of 7.2%. The COV for AT (Table 1-A) ranged from 21% to 41% with a mean of 27%. The mean COV for lF and AT were used to calculate modeling errors attributable to experimental variability (grey areas in Fig. 4 and 6).
Figure 4.

Model fitting results of SRS-force relationship for all muscles in Group A. In each figure, the gray area represents estimated model accuracy due to error in fascicle length and external tendon cross-sectional area measurements. From A to F: SOL, EDL (muscle #4 in Table 1-A), TA, PLA, MG and FHL. Two model parameters γ = 23.4 and E = 522 MPa were used to fit the data from all muscles.
Figure 6.

Model fitting results of SRS-force relationship for EDL muscle (#3) in Group A, obtained by allowing a separate E for each muscle, but still maintaining a constant γ. The parameters used for this muscle were: γ = 24.5 and E = 1104 MPa.
The anatomical model predicted the SRS-force relationship reasonably well for all muscles in Group A (Fig. 4). Using the optimized parameters, γ (23.4) and E (522 MPa), the average relative error across all eight muscles in Group A was 12.9±12.3% (mean ± SD). The EDL muscles had the highest relative error, 26.1±10.3%, whereas that for the other muscles was only 5.1±1.9%. Except for EDL, the differences between the measured and modeled stiffness data were within the range of experimental variability. Model accuracy across all muscles was assessed using linear regression between the measured and modeled stiffness values. Two data clusters were noted: those from EDL and those from other muscles (Fig. 5). Therefore, separate regressions were used for each cluster. The regression for the non-EDL muscles was not significantly different from the identity line (r2 = 0.92, p=0.76), indicating that the model provided accurate and unbiased estimates for these muscles. Based on the number of collected data points and the accuracy of the regression analysis, it would have been possible to detect significant differences between the measured and modeled SRS of less than 4% with a statistical power of 0.8, indicating that any significant model biases are likely to be within that range. In contrast, data from the EDL muscles differed substantially from the identity line (r2=0.89, p<0.001); the stiffness from this muscle was consistently underestimated by the model. The optimization process was repeated without the EDL muscles to determine if its inclusion affected the outcome for other muscles. This yielded slightly different values for γ (24.7) and E (523 MPa), but had no significant effect on the overall model accuracy (relative error = 5.5±3.3%).
Figure 5.

Model predictions versus experimental data for normalized SRS. The modeled and measured SRS values for each muscle are normalized by the maximum value measured experimentally. The error bounds (the gray areas) represent the 95% prediction intervals. All EDL muscles are clustered under the identity line, separate from other muscles. Separate regressions were done for the EDL muscles and all other muscles.
A jackknife analysis (Politis 1998) was used to estimate the accuracy of the model for non-EDL muscles not used during the estimation process. This was accomplished by using all possible combinations of 3 muscles to fit the model parameters and the remaining two muscles to evaluate the accuracy of this fit. This resulted in parameter estimates of γ =24.1±2.4 and E=508±30 MPa, and an average relative error for the cross-validations of 7.7±3.1%. These values are similar to those obtained when a single set of parameters was estimated for all muscles.
One explanation for the poor EDL predictions is a difference in the elastic moduli of the EDL tendons and those of the other muscles tested. To evaluate this possibility, we modified the model to allow the E to vary across muscles, rather than to remain fixed for all muscles, as assumed in the original analysis. This improved the fit of the experimental data for all muscles in Group A (average relative error = 5.0±3.5%), but most profoundly for the EDL muscles. An example of the change in the EDL SRS predictions is provided in Fig. 6, which can be contrasted to Fig. 4B. For this specific muscle, the average relative error decreased from 26.4% to 7.2%. The mean E for all EDL muscles in Group A was 1114 MPa, which is more than twice the previous value. The mean E for the other muscles was 496 MPa, which is similar to the previous value.
Using the two parameters estimated from the fit to all muscles in Group A, it also was possible to predict the SRS for the muscles in Group B. The average relative error for all muscles in Group B was 13±8% (mean ± SD), which is similar to Group A. Excluding the EDL muscles in Group B, the relative error was 10.0±7.7%. This indicates that the model can predict the SRS-force relationship even when lF is estimated from scaling relationships instead of directly measured.
As reported previously, anatomical measurements also were sufficient to predict P0 for muscles in Group A and B. A linear relationship was found between predicted and measured P0 (Fig. 7). The slope was less than 1 (0.85±0.11; mean ± 95% confidence intervals), suggesting that the average specific tension for the muscles in this study was slightly greater than that assumed a priori. Nevertheless, the observed value (ps =26.5 N/cm2) is well within the range of results reported previously (Powell et al. 1984).
Figure 7.

Model predictions versus experimental data of optimum force. Force was predicted using the average specific tension reported by Powell (1984). The slope of the line between the predicted and observed values was 0.85±0.11 (mean ± 95% confidence intervals) suggesting that the average specific tension of these muscles was less than that reported by Powell.
DISCUSSION
The purpose of this study was to determine if a simple model, based on anatomical parameters, could predict SRS. The model, first proposed by Morgan (1977), has and active component representing muscle fibers in series with a passive elastic component representing the aponeurosis and tendon. SRS was experimentally measured in 6 different feline hindlimb muscles and compared to the model estimates. The architectural parameters considered were: muscle physiological cross-sectional area (PCSA), optimal fascicle length, tendon cross-sectional area and effective tendon length. The active contribution to SRS was characterized as scaling linearly with muscle force, which had a maximum value proportional to PCSA. The in-series passive contribution was scaled according to the geometrical properties of the external tendon. It was hypothesized that the active and passive scaling factors were uniform across all muscles. While the effect of muscle architecture on SRS has been documented previously (Walmsley and Proske 1981), this was the first systematic attempt to predict SRS from architectural measurements in a variety of muscles. Using a common set of scaling factors (E and γ) for all muscles, it was possible to predict the SRS-force relationship from muscle specific architectural parameters with a relative error less than 30% (Group A). The relative error was below 8% when EDL was excluded from the analysis. These results provide bounds on the accuracy within which SRS can be estimated from architectural parameters and suggest that this accuracy can be improved substantially when muscle specific parameters are obtained.
Previous studies on mammalian tendons have reported a range of elastic moduli that correspond well with the value of E used in this study (Bennett et al. 1986; Pollock and Shadwick 1994). Bennett et al. conclude the elastic moduli approaches about 1.5 GPa at stresses greater than 30 MPa. While this is greater than the value of the optimized parameter E=0.52 GPa from our model, the difference probably results from the lower stresses used in this study. Here, peak tendon stress occurred at Po and ranged form 6.7 to 19.2 MPa (see Table 1). Values reported by Bennett et al. (see Fig. 3 in Bennett et al. 1986) ranged from about 0.4 to 1.4 at stresses from 6 to 20 MPa. EDL is an exception in our study. An E of 1.11 GPa produced the best fit. This higher value can’t be explained by the stress at which it was measured, since at Po, EDL had one of the lowest stresses of any muscle (6.7 MPa). It also should be noted that the tendon mechanical properties of those previous studies were assessed with an in vitro preparation. In a recent study (article in preparation), we have measured the elastic modulus for feline MG, TA and EDL tendons using an in situ approach and found values that were very similar to those obtained with the model.
There are few estimates of muscle stiffness reported in the literature that allow direct comparison with γ. Huxley and Simmons (1971) studied frog fibers and reported a fast and a slow response to quick perturbations. The fast response was considerably stiffer than that corresponding to γ used in this study. Rack and Westbury (1974) concluded the slow response was the more appropriate response to compare to cat muscle, however the shape of response is so different that comparison is probably invalid. Several other groups measured whole muscle stiffness in cats using ramp stretches similar to those used in this study. Reported values for whole muscle stiffness are similar to this study, but a direct comparison is difficult since full anatomical parameters were not reported. Morgan (1977) measured a stiffness in cat SOL of 15N/mm at 30N compared to a values of 9.2 N/mm at 21N reported here. Kirsch et al. (1994) reported stiffness in a partially activated cat SOL of 7 N/mm at 12N compared to 6.0 N/mm at 12.7N measured in this study.
The model contains several simplifying assumptions and potential sources of error with respect to the considered architectural parameters. Fascicle length varies (Felder et al. 2005; Friden et al. 2004), but this was approximated by a mean value. Further inaccuracies may have arisen from the muscle fixation length and from changes in fascicle length during the transition to rigor. This variability was compensated by normalizing according to sarcomere length, but sarcomere length is itself subject to measurement errors (Burkholder and Lieber 2001). Tendon CSA also varies along its length, and was represented by an average value. Furthermore, this value also was assumed to represent the CSA of the aponeurosis, which is difficult to measure directly.
Our data suggest that a model using uniform scaling parameters across muscles is too simple for applications that require errors less than 30%. In addition to the measurement errors described above, several unmodeled features of the MTU also may have contributed to the observed inaccuracies. Significant pennation angles could have altered the SRS-force relationship. However, the muscle with the largest angle, MG, had a prediction accuracy that was among the highest of all tested muscles. This argues against pennation angle contributing substantially for the tested muscles. The tendon was modeled as a linear elastic element and the well-known nonlinear elasticity known to occur at low force levels (Fung 1993) also may have contributed to model errors. Our previous studies, however, have demonstrated that whole muscle SRS is not sensitive to variations in tendon stiffness at low muscle forces (Cui et al. 2007), suggesting that nonlinear tendon elasticity was not a major contributor to the errors reported in the present study.
An alternative explanation for the errors is that the stiffness scaling parameters were different for the EDL than for the other muscles tested. Estimating separate elastic modulus (E) for each muscle significantly improved the model prediction accuracies, especially for EDL. The EDL may have a higher E than the other muscles. The EDL has a unique architecture that may contribute to its stiffness. It has a single proximal origin from which emerge four muscle heads, each with a separate aponeurosis and tendon (Maas et al. 2003). However, it is not readily apparent why this parallel architecture would produce a stiffer muscle or tendon.
Our results may have important implications for more complete models of muscle force generation. Although SRS is an important property of whole muscle, it only describes one component of the complex muscle response to imposed changes in length, the initial elastic response. This component is not characterized by the ubiquitous Hill-type model (Zajac 1989), which predicts a SRS that is invariant with changes in muscle force. In contrast, Hill-type models do characterize some of the nonlinear and velocity-dependent properties of muscle that are important to describe responses to larger, slower changes in muscle length. By replacing the series-elastic element of typical Hill-type models with our model of SRS, it may be possible to generate computationally efficient models that improve the range of conditions over which muscle force generation can be predicted.
Acknowledgments
NIAMS R01-AR-041531 (TGS), NICHD K25-HD-044720 (EJP).
Footnotes
Publisher's Disclaimer: This is a PDF file of an unedited manuscript that has been accepted for publication. As a service to our customers we are providing this early version of the manuscript. The manuscript will undergo copyediting, typesetting, and review of the resulting proof before it is published in its final citable form. Please note that during the production process errors may be discovered which could affect the content, and all legal disclaimers that apply to the journal pertain.
References
- Alexander RM, Jayes AS, Maloiy GMO, Wathuta EM. Allometry of the Limb Bones of Mammals from Shrews (Sorex) to Elephant (Loxodonta) Journal of Zoology. 1979;189(v):305–314. [Google Scholar]
- Bennett MB, Ker RF, Dimery NJ, Alexander RM. Mechanical-Properties of Various Mammalian Tendons. Journal of Zoology. 1986;209:537–548. [Google Scholar]
- Burkholder TJ, Lieber RL. Sarcomere length operating range of vertebrate muscles during movement. J Exp Biol. 2001;204(Pt 9):1529–36. doi: 10.1242/jeb.204.9.1529. [DOI] [PubMed] [Google Scholar]
- Cui L, Perreault EJ, Sandercock TG. Motor unit composition has little effect on the short-range stiffness of feline medial gastrocnemius muscle. J Appl Physiol. 2007 doi: 10.1152/japplphysiol.01451.2006. [DOI] [PMC free article] [PubMed] [Google Scholar]
- Felder A, Ward SR, Lieber RL. Sarcomere length measurement permits high resolution normalization of muscle fiber length in architectural studies. Journal of Experimental Biology. 2005;208(17):3275–3279. doi: 10.1242/jeb.01763. [DOI] [PubMed] [Google Scholar]
- Friden J, Lovering RM, Lieber RL. Fiber length variability within the flexor carpi ulnaris and flexor carpi radialis muscles: implications for surgical tendon transfer. J Hand Surg [Am] 2004;29(5):909–14. doi: 10.1016/j.jhsa.2004.04.028. [DOI] [PubMed] [Google Scholar]
- Fung YC. Mechanical Properties of Living Tissues. Springer-Verlag; New York: 1993. Biomechanics. [Google Scholar]
- Horchollebossavit G, Jami L, Petit J, Vejsada R, Zytnicki D. Ensemble Discharge from Golgi Tendon Organs of Cat Peroneus-Tertius Muscle. Journal of Neurophysiology. 1990;64(3):813–821. doi: 10.1152/jn.1990.64.3.813. [DOI] [PubMed] [Google Scholar]
- Huxley AF, Simmons RM. Proposed Mechanism of Force Generation in Striated Muscle. Nature. 1971;233(5321):533. doi: 10.1038/233533a0. [DOI] [PubMed] [Google Scholar]
- Ker RF. Dynamic Tensile Properties of the Plantaris Tendon of Sheep (Ovis-Aries) Journal of Experimental Biology. 1981 Aug;93:283–302. doi: 10.1242/jeb.93.1.283. [DOI] [PubMed] [Google Scholar]
- Kirsch RF, Boskov D, Rymer WZ. Muscle-Stiffness during Transient and Continuous Movements of Cat Muscle - Perturbation Characteristics and Physiological Relevance. Ieee Transactions on Biomedical Engineering. 1994;41(8):758–770. doi: 10.1109/10.310091. [DOI] [PubMed] [Google Scholar]
- Maas H, Jaspers RT, Baan GC, Huijing PA. Myofascial force transmission between a single muscle head and adjacent tissues: length effects of head III of rat EDL. J Appl Physiol. 2003;95(5):2004–13. doi: 10.1152/japplphysiol.00220.2003. [DOI] [PubMed] [Google Scholar]
- Malamud JG, Godt RE, Nichols TR. Relationship between short-range stiffness and yielding in type-identified, chemically skinned muscle fibers from the cat triceps surae muscles. J Neurophysiol. 1996;76(4):2280–9. doi: 10.1152/jn.1996.76.4.2280. [DOI] [PubMed] [Google Scholar]
- Morgan DL. Separation of Active and Passive Components of Short-Range Stiffness of Muscle. American Journal of Physiology. 1977;232(1):C45–C49. doi: 10.1152/ajpcell.1977.232.1.C45. [DOI] [PubMed] [Google Scholar]
- Perreault EJ, Kirsch RF, Crago PE. Multijoint dynamics and postural stability of the human arm. Experimental Brain Research. 2004;157(4):507–17. doi: 10.1007/s00221-004-1864-7. [DOI] [PubMed] [Google Scholar]
- Politis DN. Computer-intensive methods in statistical analysis. Ieee Signal Processing Magazine. 1998;15(1):39–55. [Google Scholar]
- Pollock CM, Shadwick RE. Relationship between body mass and biomechanical properties of limb tendons in adult mammals. Am J Physiol. 1994;266(3 Pt 2):R1016–21. doi: 10.1152/ajpregu.1994.266.3.R1016. [DOI] [PubMed] [Google Scholar]
- Powell PL, Roy RR, Kanim P, Bello MA, Edgerton VR. Predictability of skeletal muscle tension from architectural determinations in guinea pig hindlimbs. J Appl Physiol. 1984;57(6):1715–21. doi: 10.1152/jappl.1984.57.6.1715. [DOI] [PubMed] [Google Scholar]
- Proske U, Rack PM. Short-range stiffness of slow fibers and twitch fibers in reptilian muscle. Am J Physiol. 1976;231(2):449–53. doi: 10.1152/ajplegacy.1976.231.2.449. [DOI] [PubMed] [Google Scholar]
- Rack PM, Westbury DR. The short range stiffness of active mammalian muscle and its effect on mechanical properties. Journal of Physiology. 1974;240(2):331–50. doi: 10.1113/jphysiol.1974.sp010613. [DOI] [PMC free article] [PubMed] [Google Scholar]
- Sacks RD, Roy RR. Architecture of the hind limb muscles of cats: functional significance. Journal of Morphology. 1982;173(2):185–95. doi: 10.1002/jmor.1051730206. [DOI] [PubMed] [Google Scholar]
- Sandercock TG, Heckman CJ. Whole muscle length-tension properties vary with recruitment and rate modulation in areflexive cat soleus. Journal of Neurophysiology. 2001;85(3):1033–1038. doi: 10.1152/jn.2001.85.3.1033. [DOI] [PubMed] [Google Scholar]
- Scott SH, Loeb GE. Mechanical properties of aponeurosis and tendon of the cat soleus muscle during whole-muscle isometric contractions. Journal of Morphology. 1995;224(1):73–86. doi: 10.1002/jmor.1052240109. [DOI] [PubMed] [Google Scholar]
- Walmsley B, Proske U. Comparison of stiffness of soleus and medial gastrocnemius muscles in cats. Journal of Neurophysiology. 1981;46(2):250–9. doi: 10.1152/jn.1981.46.2.250. [DOI] [PubMed] [Google Scholar]
- Zajac FE. Muscle and tendon: properties, models, scaling, and application to biomechanics and motor control. Crit Rev Biomed Engin. 1989;17:359–411. [PubMed] [Google Scholar]