Figure 1.
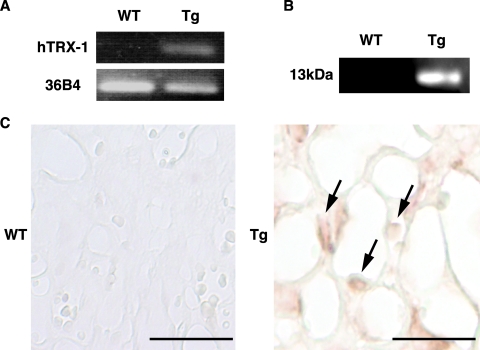
RT-PCR (A), Western blotting (B), and immunohistochemical analysis (C) of hTRX-1 expression in the placentas of WT mice and hTRX-1 Tg mice. A and B, In hTRX-1 Tg mice, a strong signal for hTRX-1 is detected, whereas no signal for hTRX-1 is seen in WT mice. The hTRX-1 mouse antibody recognized hTRX-1 as a single band of 13 kDa. C, Expression of hTRX-1 protein was detected in hTRX-1 Tg mice (arrows), but not in WT mice. Scale bars, 50 μm.

