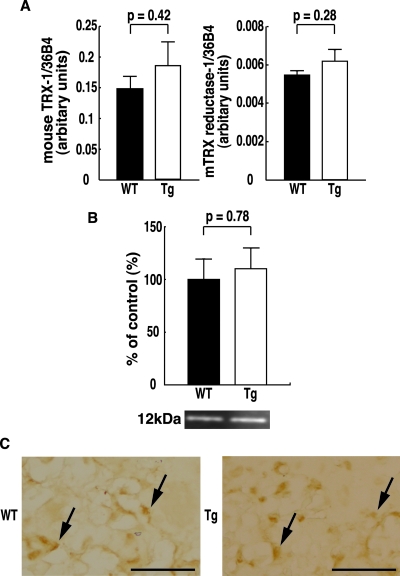
Figure 2.
Quantitative RT-PCR (A) analysis of mTRX-1 and mTRX reductase-1 mRNA expression in the placenta, and Western blot (B) and immunohistochemical (C) analysis of mTRX-1 protein expression in the placentas of WT and hTRX-1 Tg mice. A and B, WT placentas are indicated by the closed column, and Tg placentas are indicated by the open column. Comparisons were made by the unpaired Student’s t test. The mTRX-1 rabbit antibody recognized mTRX-1 as a single band of 12 kDa. C, Expression of mTRX-1 protein was observed in both hTRX-1 Tg and WT placentas (arrows). Scale bar, 50 μm.

