

Abstract
Mutations in the NPHS2 gene, which encodes podocin, are responsible for some cases of sporadic and familial autosomal recessive steroid-resistant nephrotic syndrome. Inter- and intrafamilial variability in the progression of renal disease among patients bearing NPHS2 mutations suggests a potential role for modifier genes. Using a mouse model in which the podocin gene is constitutively inactivated, we sought to identify genetic determinants of the development and progression of renal disease as a result of the nephrotic syndrome. We report that the evolution of renal disease as a result of nephrotic syndrome in Nphs2-null mice depends on genetic background. Furthermore, the maternal environment significantly interacts with genetic determinants to modify survival and progression of renal disease. Quantitative trait locus mapping suggested that these genetic determinants may be encoded for by genes on the distal end of chromosome 3, which are linked to proteinuria, and on the distal end of chromosome 7, which are linked to a composite trait of urea, creatinine, and potassium. These loci demonstrate epistatic interactions with other chromosomal regions, highlighting the complex genetics of renal disease progression. In summary, constitutive inactivation of podocin models the complex interactions between maternal and genetically determined factors on the progression of renal disease as a result of nephrotic syndrome in mice.
Podocin is a 42-kD protein localized to the slit diaphragms of terminally differentiated epithelial cells called podocytes,1 serving both structural and signaling functions.2,3 Mutations in the NPHS2 gene, encoding podocin, are responsible for 42% of familial autosomal recessive and 10% of sporadic cases of steroid-resistant nephrotic syndrome.4,5 Most patients present with nephrotic syndrome between 3 mo and 5 yr of age, rapidly progress to ESRD, and have no recurrence after transplantation.4
Interestingly, both inter- and intrafamilial variability in the renal disease among patients bearing NPHS2 mutations have been reported by several groups.6–8 For instance, Ruf et al.9 described three families in which sibling pairs bearing the same podocin mutations had different ages of onset of proteinuria and of ESRD. These reflect genetic modifiers and environmental factors influencing the rates of progression of renal disease. In mice, inactivation of podocin leads to rapid development of diffuse mesangial sclerosis, massive proteinuria, and other sequelae of nephrotic syndrome, ultimately leading to early, terminal renal failure.10 We previously showed that the survival of Nphs2 null mice is significantly longer in the 129S2/SvPas (129) strain, as compared with mice of mixed C57BL/6 (B6):129 genetic background, consistent with genetic modification.10
The determinants of progression of renal disease in patients with nephrotic syndrome are poorly understood. Mouse models have proved invaluable in revealing genetic loci that affect renal disease severity in polycystic kidney disease,11,12 Alport syndrome,13 and viral14 and toxic15 nephropathies. To understand better the genetic determinants of nephrotic syndrome, we characterized the renal phenotypes of podocin inactivation in three different mouse genetic backgrounds and carried out a genetic modifier screen. Our data revealed that the maternal lactational environment interacts with innate genetic determinants elaborated by genes located within several modifier loci; hence, modeling combined gene–environment effects on renal disease evolution.
RESULTS
Early Survival and Evolution of Renal Disease Depend on Genetic Background
We previously showed that Nphs2 inactivation resulted in an earlier demise of mixed B6:129 background mice than of congenic 129 mice, suggesting a role for genetic modifiers.10 The null Nphs2 allele was, thus, additionally backcrossed onto glomerulosclerosis-resistant B616 and glomerulosclerosis-sensitive FVB/N (FVB)17 strains, and the phenotypes of congenic null Nphs2 mice were characterized. Death occurred by postnatal (P) days P2, P5, and P18 on average in congenic B6, FVB, and 129 Nphs2 null mice, respectively (P < 0.0001 by log-rank test; Figure 1). Careful characterization at P1 showed comparable serum urea (Supplemental Figure S1) and light and electron microscopic findings (Supplemental Figures S2 and S3) in the three strains. Foot processes were effaced in both immature cortical and mature juxtamedullary glomeruli (Supplemental Figure S3); however, albuminuria levels, body weight reduction, and decreases in nephrin and Trpc6 mRNA levels (Supplemental Figure S1) reflected more severe disease in B6 mice.
Figure 1.
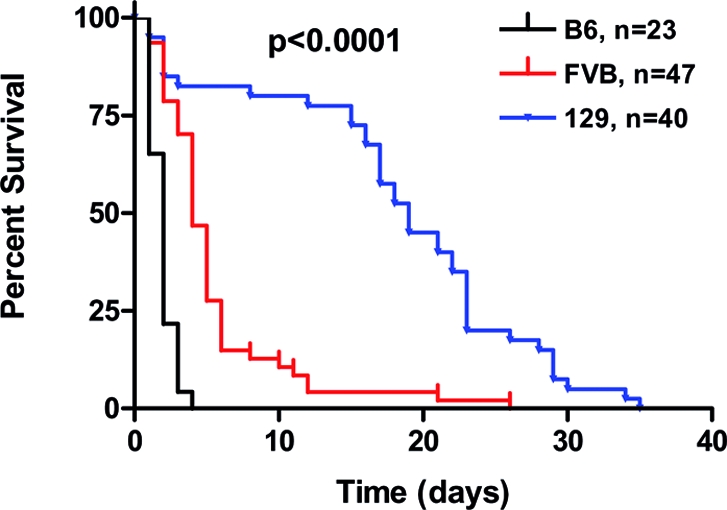
Survival of Nphs2 null mice depends on genetic background. Kaplan-Meier survival curve of cohorts of podocin null mice in the B6, FVB, and 129 genetic backgrounds followed until the time of death.
For observation of the evolution of renal disease, cohorts of congenic FVB and 129 mice were killed at P5, P12, and P28. In congenic FVB and 129 null mice at P5 and P12, mesangiolysis, representing loss of mesangial cells or of the matrix they synthesize, was the predominant glomerular lesion (Figure 2 and Supplemental Figure S3). After quantification using a modified mesangiolysis scoring system (Supplemental Figure S4), FVB null mice had renal lesions of moderate (score 2.0) to severe (score 3.0) mesangiolysis at P5, with a mean (± SEM) mesangiolysis score of 2.50 ± 0.03 (Figure 2), reflecting 3.7% of glomeruli having no (score 0) or mild (score 1) mesangial injury. In rare FVB null mice that survived to P12 (representing 10% of the cohort), the mean mesangiolysis score of 2.70 ± 0.04 represented further worsening of glomerular lesions (Figure 2). Moreover, FVB null mice at P5 had marked growth retardation, proteinuria, and an elevated plasma creatinine (56.2 ± 5.5 versus 17.2 ± 0.7 μmol/L in controls; P < 0.001), suggesting renal insufficiency (Supplemental Table S1). At P12, plasma creatinine remained elevated (51.3 ± 8.0 μmol/L), but proteinuria could not be quantified because of paucity or absence of urine in the bladder.
Figure 2.

Evolution of renal disease in podocin null mice differs in the FVB and 129 strains. Severe mesangiolysis in both FVB and 129 null mice at P5 is followed by continued progression in the FVB null mice at P12 and, in contrast, by improvement in the 129 strain. At P28, a change from mesangiolysis to diffuse glomerulosclerosis in the 129 null mice is seen. FVB control mice (data not shown) have renal histology identical to 129 controls at each time point. Four-micron-thick sections were stained with periodic acid- Schiff. Magnification, ×1000.
A similar degree of mesangiolysis (score 2.50 ± 0.04) was observed at P5 in 129 null mice (Figure 2). In contrast, the mean mesangiolysis score decreased at P12 to 1.60 ± 0.06 (P < 0.001), indicating significant improvement because 58% of glomeruli had mild or no mesangial injury (Figure 2). Ultrastructurally, foot processes at P12 remained diffusely effaced (data not shown). Subsequently, progressive glomerulosclerosis ensued, initially in a focal segmental and later in a diffuse pattern by P28 (Figure 2). Severe tubular dilation and atrophy and interstitial deposition of collagen were notable at this time (data not shown). At P5, 129 null mice demonstrated body weight loss (NS), proteinuria, and an elevated plasma creatinine (35.1 ± 2.2 versus 21.2 ± 0.9 μmol/L in controls; P < 0.001) but less than in FVB mice (Supplemental Table S1). Concordant with the improvement in glomerular lesions, plasma creatinine decreased significantly by P12 to 26.1 ± 2.1 μmol/L, before increasing again at the time of death (127.0 ± 13.1 μmol/L; n = 7). We have, therefore, observed that the evolution of renal disease resulting from podocin loss depends on genetic background.
Maternal Environment Alters Survival and Progression of Renal Lesions
In preparation for a modifier screen to identify genetic loci that modify renal disease evolution in Nphs2 null mice, F1 generations of mice were generated, via reciprocal crosses between 129 and FVB Nphs2 heterozygotes. Surprising, F1 null mice obtained via matings between FVB mothers and 129 fathers (F1-FVB) died on average at 8 d, whereas F1 null mice from 129 mothers and FVB fathers (F1-129) died at 22 d (log-rank test P < 0.0001). F1-FVB mice had significantly higher plasma urea, potassium (K), and proteinuria levels at P12 (Figure 3). In addition, mesangiolysis was significantly more severe in F1-FVB null mice than in F1-129 null mice, with mesangiolysis scores of 2.90 ± 0.02 and 2.00 ± 0.05 (P < 0.001), respectively, corresponding to 0.67 versus 29.30% of glomeruli with no or mild lesions (Figure 4A).
Figure 3.

Phenotypes of F1 mice before and after cross-fostering experiments demonstrating effects of maternal environment. (A) Reciprocal crosses between FVB and 129 Nphs2 heterozygotes generated two F1 cohorts of mice, both having identical genetic content. The phenotypes of F1-129 and F1-FVB null mice depend on the maternal environment and are shown in the presence of the genetic mother or the adoptive mother after fostering experiments at P1. (B through F) Significant differences in survival (B), urea (C), creatinine (D), K (E), and proteinuria (F) are shown. Comparisons between F1-129 and F1-FVB in the presence of their genetic mothers are noted in black lines, and significant differences in phenotypes between F1-FVB mice raised with genetic FVB versus adoptive 129 mothers are shown with red lines. Data are means ± SEM. §P < 0.01; +P < 0.001.
Figure 4.

The maternal environment affects renal disease progression of F1 mice. (A) Mesangiolysis is more severe in null F1-FVB mice, offspring of an FVB mother, killed at P12, as compared with F1-129 mice, born from 129 mothers. (B) Adoption at P1 by foster 129 or FVB mothers results in a marked improvement in mesangiolysis in FVB null mice by P12 and a mild worsening of lesions in 129 null mice. (C) Cross-fostering experiment in congenic mice demonstrated an improvement in the renal histology of FVB null mice. Histology is shown for single surviving 129 null mouse fostered to an FVB mother. Four-micron-thick sections were stained with periodic acid-Schiff. Magnification, ×1000.
These differences between the F1 groups may result from parent-of-origin effects as a result of genetic imprinting or gender-linked or mitochondrial inheritance or from the maternal environment in which the pups are nourished and nurtured. To test the possible contribution of the maternal environment, we performed maternal cross-fostering experiments, in which litters of F1-FVB pups were fostered to a 129 mother at P1, and vice versa. When F1-FVB mice were fostered by a 129 mother, 12-d survival improved; urea, K, and proteinuria decreased (Figure 3); and the average mesangiolysis score improved to 1.80 ± 0.05 (P < 0.001), reflecting 35% of glomeruli with little to no lesions (Figures 4B). Conversely, F1-129 mice adopted by a foster FVB mother had lower survival (Figure 3) and a higher mesangiolysis score of 2.40 ± 0.04 (P < 0.001), indicating a decrease in the percentage of glomeruli with no or only mild lesions from 29.3 to 13.0% (Figure 4B), despite unchanged biochemical parameters (Figure 3).
In parallel, maternal cross-fostering experiments between the congenic FVB and 129 cohorts resulted in a marked improvement in P12 survival of FVB null mice from 10.6% (five of 47) to 100% (nine of nine; χ2 = 13.6, P = 0.0002) and in the renal histology (Figure 4C). Only 10% (one of 10) of 129 null mice survived upon adoption by an FVB mother, as opposed to 80% (32 of 40) in the presence of the native 129 mother (χ2 = 6.90, P = 0.014). Although we cannot exclude the potential contribution of parent-of-origin effects, it seems that a maternal environmental (likely lactational) factor exerts a marked impact on survival and renal disease progression in podocin null mice.
Genetic Background Interacts with Maternal Environmental Factors
For verification that genetic background effects are distinct from those of the maternal environment, reciprocal backcrosses were generated between F1-129 offspring and either 129 or FVB parental strains. Four groups of 129 and FVB backcross Nphs2−/− mice were, thus, generated (Table 1), and those that survived to P12 were killed and characterized. No significant phenotypic differences were noted between male and female Nphs2 null mice in any of the crosses, making gender-linked inheritance less likely.
Table 1.
Phenotypes of four backcross cohorts of podocin null mice demonstrate gene–maternal environment interactiona
| Parameter | 129 Backcross Mice (Approximately 75% 129, 25% FVB)
|
FVB Backcross Mice (Approximately 75% FVB, 25% 129)
|
||
|---|---|---|---|---|
| Group 1 | Group 2 | Group 3 | Group 4 | |
| Mating pair | 129 ♀ × F1–129 ♂ | F1–129 ♀ × 129 ♂ | F1–129 ♀ × FVB ♂ | FVB ♀ × F1–129 ♂ |
| Total mice | 1503 | 1993 | 1907 | 2561 |
| Total null mice | 340 | 530 | 489 | 676 |
| Survival of null mice to P12 | 229 (67.4%) | 354 (66.8%) | 229 (46.8%)e | 226 (33.4%)f |
| Urea (mmol/L) | 43.0 ± 2.1 (n = 183) | 43.3 ± 1.5 (n = 299) | 49.6 ± 1.8 (n = 188)c | 62.9 ± 2.1 (n = 174)f |
| Creatinine (μmol/L) | 34.8 ± 1.7 (n = 187) | 38.4 ± 1.5 (n = 291)a | 46.5 ± 1.6 (n = 188)e | 46.0 ± 1.5 (n = 178) |
| K (mmol/L) | 8.02 ± 0.18 (n = 142) | 8.21 ± 0.13 (n = 263) | 8.39 ± 0.18 (n = 165) | 8.04 ± 0.13 (n = 127) |
| Proteinuria (mg/mg) | 228 ± 13 (n = 150) | 298 ± 12 (n = 253)b | 554 ± 14 (n = 144)d | 372 ± 23 (n = 96)f |
Survival and biochemical parameters from plasma and urine of controls (not shown and not different) were characterized in two 129 backcross and two FVB backcross populations. Data are means ± SEM. One-way ANOVA or χ2 test was used to compare groups.
Group 1 versus group 2,aP < 0.05;
P < 0.01.
Group 2 versus group 3,
P < 0.05,
P = 0.02,
P < 0.001.
Group 3 versus group 4,
P < 0.001.
Consistent with genetic modification and trait heritability, phenotypic variances (σ2 = square of the SD) were greater in group 1 129 backcross mice, having a variable admixture of FVB and 129 alleles, than in F1-129 mice, which have fixed genetic content, in the setting of the same 129 maternal environment (Supplemental Figure S5). The distinct effects of genetic background were also evidenced by phenotypic differences between groups 2 and 3 backcross mice, raised in identical F1-129 maternal environments. The excess of FVB alleles in group 3 mice led to lower survival, higher plasma urea and creatinine, and lower proteinuria (Table 1). Additional differences in creatinine and proteinuria between the two 129 backcross groups (groups 1 and 2) and in urea and proteinuria levels between the FVB backcross cohorts (groups 3 and 4; Table 1) were noted and likely reflect genotype–maternal environment interaction, as well as potential parent-of-origin effects that we cannot rule out at this time.
Genome-wide Scan Reveals Several Genetic Loci Associated with Renal Disease Severity
A genome-wide scan was conducted to identify genetic loci that modify the renal phenotypes in the two 129 backcross cohorts. A total of 125 informative microsatellite markers were initially genotyped at an average interval of 10 cM, and an additional 12 were added for fine mapping. In total, 191 mice obtained from crosses between 129 females and F1 males (group 1) and 294 mice from crosses between F1 females and 129 males (group 2) were analyzed. The two groups were analyzed separately and in combination to control for the effects of the maternal environment on phenotypic variability.
In group 1 mice, the genome-wide scan revealed linkage of a locus centered around markers D3Mit352 through D3Mit19 on chromosome 3 to proteinuria, explaining 9.8% phenotypic variance (logarithm of odds [LOD] score 2.91; P = 0.033; Figure 5A). Threshold levels of significance (P < 0.05) were estimated empirically using permutation testing, according to the method established by Churchill and Doerge18 and accepted by the Complex Trait Consortium.19 Consistent with the effects of genetic background previously shown in the backcross cohorts, heterozygosity (V/F) at the D3Mit352 locus decreased proteinuria by 86 mg/mg as compared with homozygosity (V/V) for the 129 allele (Figure 5B).
Figure 5.

Genome-wide scan revealed modifier loci on distal chromosomes 3 and 7. (A) Linkage obtained by genome-wide QTL mapping in 153 group 1 mice and empirical threshold calculated by permutation testing. Genetic distance calculated on the basis of recombination frequencies observed in the cohort. Yellow and black hatched lines represent empirical genome-wide thresholds for suggestive (P = 0.40) and significant (P = 0.05) linkage. (B) Heterozygosity at the D3Mit352 locus decreases proteinuria. Data are means ± SEM. (C) Linkage obtained by genome-wide QTL mapping in 243 group 2 mice and empirical threshold calculated by permutation testing. Yellow and black hatched lines represent empirical genome-wide thresholds for suggestive (P = 0.40) and significant (P = 0.05) linkage. (D and E) Heterozygosity at D7Mit44 locus leads to significant increases in plasma urea, creatinine, and K. Data are means ± SEM.
The different maternal environment in which group 2 mice were raised permitted us to identify a locus on distal chromosome 7 (LOD score 3.45; P = 0.0083) linked to a composite trait derived from principal components analysis of three correlated phenotypes of plasma urea, creatinine, and K, each of which was suggestively linked to the same locus (Figure 5C). This locus, centered on markers D7Mit44 and D7Mit259, explains 8.9% variability of this composite trait. Heterozygosity at the D7Mit44 locus significantly increased the mean levels of urea (8.3 mmol/L), of creatinine (7.1 μmol/L), and of plasma K (0.8 mmol/L; Figure 5, D and E).
When the two groups were analyzed together, proteinuria remained linked to the chromosome 3 locus (LOD score 2.71; P = 0.051). The locus on chromosome 7 maintained significant linkage (LOD score 3.82; P = 0.0032) but accounted for only 6.7% of phenotypic variance. Secondary analysis revealed epistatic interactions between several loci and together with additional suggestively linked genetic loci are detailed in Supplemental Tables S2 and S3 and Supplemental Figure S6. In addition, genome-wide analysis was performed comparing the 294 group 2 mice that survived to P12 with 46 nonsurvivors. χ2 analysis revealed linkage of two loci centered around markers D4Mit39 through D4Mit275 and D8Mit215 through D8Mit93 with survival, but the corresponding P values of 0.025 and 0.01 failed to achieve significance upon correction for multiple testing.
DISCUSSION
The determinants of renal disease progression have long been presumed to involve both genetic and environmental factors but remain poorly understood. We therefore characterized a murine model of nephrotic syndrome as a result of podocin inactivation in three different genetic backgrounds as a tool to understand better the genetic determinants. In this model, constitutive podocin loss led either to early postnatal death (in B6 mice) or to lesions of mesangiolysis and death (in FVB and 129 mice). In humans20 and experimental animal models,21 mesangiolysis occurs in the setting of immune-mediated or toxic renal injury or with loss of podocyte-derived vascular endothelial growth factor during the period of glomerular development.22 In contrast, we observed that podocyte-specific inactivation of podocin in the mature mouse kidney does not result in mesangiolysis, rather in FSGS as seen in humans,23 therein pointing to a developmental stage dependence of this phenotype. Nephrogenesis in mice continues during the first 2 postnatal weeks of life, whereas it is completed in humans at the time of birth and may explain the absence of lesions of mesangiolysis in kidneys of patients bearing NPHS2 mutations.4 Biopsies of recently described NPHS2 patients with early-onset disease may need further analysis.24
Surprising, we identified a significant role for the postnatal maternal environment in the evolution of renal disease upon podocin loss. Cross-fostering experiments in genetically homogeneous congenic FVB and 129 mice and the F1 generation showed beneficial effects of 129 mothers on survival, glomerular lesions, and biochemical measures of renal disease severity and deleterious effects of FVB mothers on survival. In particular, urea and proteinuria levels were lower in mice nursed by 129 mothers and may reflect effects on intrinsic renal and/or prerenal hemodynamic factors. Interestingly, the average litter size for FVB females is 10 pups, which is significantly larger than the mean of six pups for 129 female mice (based on 10 litters; P < 0.0002). Despite this, the overall mortality rate during the first 3 d of life (irrespective of genotype) for FVB mice was 3.0 versus 12.9% for 129 mice (six of 200 versus 38 of 295; χ2 = 14.37, P < 0.001), suggesting that the beneficial impact of a 129 foster mother is unlikely to be secondary to inherently superior nurturing/maternal skills. Estimates of heritability of levels of urea, creatinine, and proteinuria in the different mouse cohorts, reflecting the genetic determinants of trait variation, suggest that nongenetic factors, including the maternal environment, may account for 14 to 77% of phenotypic variability.
The possible contributions of parent-of-origin effects mediated via epigenetic, sex chromosome–linked, or mitochondrial genetic mechanisms cannot be definitively excluded, but cross-fostering experiments suggest the importance of the lactational environment. Wlodek et al.25 recently showed that the reduction in nephron numbers and predisposition to adult-onset hypertension in rats exposed to uteroplacental insufficiency can be corrected by providing a normal lactational environment in the postnatal period. These effects may be mediated by growth factors that are abundant in milk.26 We investigated a potential role for lactadherin (encoded by the Mfge8 gene), a secreted αvβ3 integrin-binding protein found in the milk-fat globule and involved in phagocytosis of apoptotic cells27 and vascular endothelial growth factor–dependent neovascularization,28 but found that concomitant inactivation of the Mfge8 gene in 129 Nphs2 null mice and nursing by an Mfge8 null mother modified neither the survival nor the renal phenotype (E.L.E. and C.A., unpublished data). Additional studies will need to be carried out to identify the maternal factor(s) that affect pathophysiologic mechanisms disturbed in nephrotic syndrome.
Genotype–maternal environment interactions have previously been described in vascular development29 and intestinal length determination30 but not in renal disease. In our model, innate genetic factors resulted in distinctly different patterns of renal disease evolution in Nphs2 null mice of three genetic backgrounds. In the B6 strain, inactivation of podocin led to a perinatal-lethal phenotype as in mouse models in which the proteins nephrin,31 protocadherin mFAT1,32 podocalyxin,33 and NEPH134 have been inactivated. In the FVB and 129 strains, null mice escaped early death and developed mesangiolysis; however, whereas mesangiolysis is progressive and lethal in FVB null mice, it improves in 129 nulls by P12, around the time when kidney development is completed. Thereafter, a focal segmental pattern of sclerosis progressing to diffuse glomerulosclerosis develops in 129 mice, ultimately surviving at least three times longer than FVB nulls. This partial repair of mesangiolysis in 129 nulls is similar to the renal disease seen in the anti-Thy1.1 glomerulonephritis model.35 Interestingly, the maternal environment may intervene, thereby permitting the same process to occur in FVB nulls upon adoption by a 129 mother. These results suggest that the maternal environment may be important not only in development but also in renal injury and repair.
Finally, using quantitative trait locus (QTL) mapping methods, we successfully identified several modifier loci in two different 129 backcross populations. We determined that an excess of FVB alleles leads to a greater impairment of renal function, as measured by urea, creatinine, and plasma K levels, and is linked to a locus on distal chromosome 7. In addition, proteinuria was decreased in mice with more FVB alleles and is significantly linked to a modifier locus on distal chromosome 3. Our finding of genetic loci separately controlling proteinuria and indirect measures of renal function is consistent with several human studies.36,37 It is likely that the strength of the maternal effect on renal disease progression curtailed our ability to identify genetic loci with more robust linkage. In addition, the demise of approximately 30% of the cohort before P12 skewed the population to those with less severe renal disease and may have weakened the power of the study to establish stronger evidence of genetic linkage. Furthermore, genetic determination of renal disease progression is complex: Several small-effect loci control traits and rampant epistatic interactions exist. Moreover, the clinically relevant renal phenotypes we have used as QTL are intrinsically complex, and assays in mice, such as that for serum creatinine, may be subject to inaccuracies from interfering substances. The level of proteinuria, for instance, reflects not only factors determining glomerular permeability38 but also hemodynamic factors and renal tubular reabsorptive processes.39 Until such time that clinically validated intermediate renal phenotypes amenable to QTL mapping (e.g., expression QTL) are available, complex trait mapping efforts will continue to be hampered by inherent limitations of existing surrogate markers of renal disease severity.
In summary, we have shown that the interaction between genetic factors and the maternal environment influences renal disease progression in the nephrotic syndrome as a result of podocin inactivation. Our findings likewise underscore the importance of phenotypic characterization of knockout models in different genetic backgrounds. Further studies will need to be carried out to elucidate the components of the lactational environment that engage pathophysiologic mechanisms important in renal disease development.
CONCISE METHODS
Animal Breeding
Three congenic Nphs2 lines were generated by backcrossing the Nphs2 null allele10 at least eight generations (ensuring 99.6% enrichment) against the B6, FVB, and 129 strains, purchased from Charles River Laboratories (L'Arbresle, France). F1 progeny were produced by reciprocal crosses between heterozygotes of the FVB and 129 parental strains (i.e., (FVB ♀ × 129 ♂ and 129 ♀ × FVB ♂, designated F1-FVB and F1-129, respectively). F1-129 offspring were further mated to either the 129 or the FVB parental strains to generate a cohort of 129 and FVB backcross populations on which a modifier screen was conducted. Mice were maintained in a specific pathogen-free environment, and experiments were conducted in compliance with ethical standards established by the French government and by the ethical committee of the INSERM, Paris, and Hôpital Necker-Enfants Malades.
Phenotypic Characterization
Survival was initially assessed by following a cohort of mice until the time of death. Thereafter, mice were killed at P12, and survival for each group was reported as the percentage of mice surviving to P12. When the mice were killed, body weight was measured and blood and urine were obtained. For mice killed at P1, 5 μl of urine was loaded on a 12% SDS-PAGE gel and stained with Coomassie blue, and albumin was quantified against a standard curve. Serum and urine chemistries were performed using an Olympus (Rungis, France) AU-400 multiparametric analyzer. Serum and urine creatinine levels were measured using the Jaffe assay. Total urinary protein was measured using the autoanalyzer and indexed to urinary creatinine.
Histologic Characterization
Kidneys were harvested, fixed in alcoholic Bouin solution, and embedded in paraffin. Four-micron-thick sections were prepared and stained with periodic acid-Schiff or Masson Trichrome. Renal histology was scored independently by two investigators (E.L.E. and A.O.M.) blinded to genetic background, parental strains, and other phenotypic traits. Mesangiolysis in 30 glomeruli per mouse was quantified on a scale from 0 to 3, according to a quantitative scale presented in Supplemental Figure S4.
Cross-Fostering Experiments
Experiments in which a litter of mice were adopted by a foster mother of a different genetic background were carried out on the P1. One to two adoptive lactating mothers were provided to each swapped litter to ensure adequate lactation. Survival was monitored, and phenotypic characterization was carried out at P12, as described previously.
Genotyping and Analysis of Linkage
Microsatellite markers polymorphic between the FVB/N and 129 strains were obtained from the Center for Inherited Disease Research (http://www.cidr.jhmi.edu) and Mouse Genome Informatics (http://www.informatics.jax.org) databases, confirmed by PCR, and resolved on ethidium bromide–stained 4% agarose gels. We initially genotyped 125 microsatellite markers (average spacing of 10 to 20 cM) in a cohort of 495 129 backcross mice (groups 1 and 2) and added 12 markers for fine-mapping.
Pairwise and multipoint LOD scores and the proportion of trait variance explained by each trait locus were calculated by using either the MapMaker/QTL (Whitehead Institute, Cambridge, MA) or MapManager QTX (Roswell Park Cancer Institute, Buffalo, NY) programs, under an additive model. For determination of the empirical significance of the linkage findings, thresholds for significance in each backcross were calculated for each phenotypic trait, and permutation tests were done in 1-cM steps for 10,000 permutations using the MapManager QTX program, as proposed by Churchill and Doerge.18
Real-Time PCR
Gene expression was quantified in duplicate using real-time PCR on an Applied Biosystems 7700 system, using commercially available and optimized TaqMan Assays-on-Demand primer and probe sets (Applied Biosystems, Foster City, CA). Target gene expression levels, normalized to 18S rRNA, were calculated using the 2−ΔΔCT method40 and are reported as fold change over control mice of the same genetic background.
Statistical Analysis
Survival among groups was compared using the log-rank test. The comparison of two groups was performed using two-tailed t test or Mann-Whitney test, depending on the normality of the distribution of values. When more than two groups were compared, a one-way ANOVA was performed. The threshold for significance was set at P < 0.05. GraphPad Prism 3 software (San Diego, CA) was used for statistical analyses.
DISCLOSURES
This work has been partially funded by a grant from the Genzyme Corporation to C.A. and E.L.E.
Supplementary Material
Acknowledgments
Financial support for this work was provided by grants from INSERM, the GIS-Institut des maladies rares (to C.A. and E.L.E.), the Genzyme Renal Innovations Program (to C.A. and E.L.E.), the Ministère de l'Enseignement Supérieur et de la Recherche (PhD grant to J.R.), the Association pour l'Utilization du Rein Artificiel (to C.A.), and a Ruth Kirchstein National Research Service Award to E.L.E. (DK065409). This study was also part of the EuReGene Project, an integrated project (5085) of the 6th Framework Program of the European Commission (to C.A.).
We thank Viviane Beau (INSERM U574) and Jacqueline Bauchet and Nicholas Sorhaindo (Hôpital Bichat, Paris, France) for technical expertise. In addition, Fabiola Terzi and Laurence Heidet provided helpful scientific advice.
Published online ahead of print. Publication date available at www.jasn.org.
J.R. and T.A.L. contributed equally to this work.
Supplemental information for this article is available online at http://www.jasn.org/.
REFERENCES
- 1.Roselli S, Gribouval O, Boute N, Sich M, Benessy F, Attie T, Gubler MC, Antignac C: Podocin localizes in the kidney to the slit diaphragm area. Am J Pathol 160: 131–139, 2002 [DOI] [PMC free article] [PubMed] [Google Scholar]
- 2.Huber TB, Kottgen M, Schilling B, Walz G, Benzing T: Interaction with podocin facilitates nephrin signaling. J Biol Chem 276: 41543–41546, 2001 [DOI] [PubMed] [Google Scholar]
- 3.Schwarz K, Simons M, Reiser J, Saleem MA, Faul C, Kriz W, Shaw AS, Holzman LB, Mundel P: Podocin, a raft-associated component of the glomerular slit diaphragm, interacts with CD2AP and nephrin. J Clin Invest 108: 1621–1629, 2001 [DOI] [PMC free article] [PubMed] [Google Scholar]
- 4.Boute N, Gribouval O, Roselli S, Benessy F, Lee H, Fuchshuber A, Dahan K, Gubler MC, Niaudet P, Antignac C: NPHS2, encoding the glomerular protein podocin, is mutated in autosomal recessive steroid-resistant nephrotic syndrome. Nat Genet 24: 349–354, 2000 [DOI] [PubMed] [Google Scholar]
- 5.Weber S, Gribouval O, Esquivel EL, Moriniere V, Tete MJ, Legendre C, Niaudet P, Antignac C: NPHS2 mutation analysis shows genetic heterogeneity of steroid-resistant nephrotic syndrome and low post-transplant recurrence. Kidney Int 66: 571–579, 2004 [DOI] [PubMed] [Google Scholar]
- 6.Fuchshuber A, Gribouval O, Ronner V, Kroiss S, Karle S, Brandis M, Hildebrandt F: Clinical and genetic evaluation of familial steroid-responsive nephrotic syndrome in childhood. J Am Soc Nephrol 12: 374–378, 2001 [DOI] [PubMed] [Google Scholar]
- 7.Karle SM, Uetz B, Ronner V, Glaeser L, Hildebrandt F, Fuchshuber A: Novel mutations in NPHS2 detected in both familial and sporadic steroid-resistant nephrotic syndrome. J Am Soc Nephrol 13: 388–393, 2002 [DOI] [PubMed] [Google Scholar]
- 8.Caridi G, Bertelli R, Di Duca M, Dagnino M, Emma F, Onetti Muda A, Scolari F, Miglietti N, Mazzucco G, Murer L, Carrea A, Massella L, Rizzoni G, Perfumo F, Ghiggeri GM: Broadening the spectrum of diseases related to podocin mutations. J Am Soc Nephrol 14: 1278–1286, 2003 [DOI] [PubMed] [Google Scholar]
- 9.Ruf RG, Lichtenberger A, Karle SM, Haas JP, Anacleto FE, Schultheiss M, Zalewski I, Imm A, Ruf EM, Mucha B, Bagga A, Neuhaus T, Fuchshuber A, Bakkaloglu A, Hildebrandt F: Patients with mutations in NPHS2 (podocin) do not respond to standard steroid treatment of nephrotic syndrome. J Am Soc Nephrol 15: 722–732, 2004 [DOI] [PubMed] [Google Scholar]
- 10.Roselli S, Heidet L, Sich M, Henger A, Kretzler M, Gubler MC, Antignac C: Early glomerular filtration defect and severe renal disease in podocin-deficient mice. Mol Cell Biol 24: 550–560, 2004 [DOI] [PMC free article] [PubMed] [Google Scholar]
- 11.Mrug M, Li R, Cui X, Schoeb TR, Churchill GA, Guay-Woodford LM: Kinesin family member 12 is a candidate polycystic kidney disease modifier in the cpk mouse. J Am Soc Nephrol 16: 905–916, 2005 [DOI] [PubMed] [Google Scholar]
- 12.Woo DD, Nguyen DK, Khatibi N, Olsen P: Genetic identification of two major modifier loci of polycystic kidney disease progression in pcy mice. J Clin Invest 100: 1934–1940, 1997 [DOI] [PMC free article] [PubMed] [Google Scholar]
- 13.Andrews KL, Mudd JL, Li C, Miner JH: Quantitative trait loci influence renal disease progression in a mouse model of Alport syndrome. Am J Pathol 160: 721–730, 2002 [DOI] [PMC free article] [PubMed] [Google Scholar]
- 14.Gharavi AG, Ahmad T, Wong RD, Hooshyar R, Vaughn J, Oller S, Frankel RZ, Bruggeman LA, D'Agati VD, Klotman PE, Lifton RP: Mapping a locus for susceptibility to HIV-1-associated nephropathy to mouse chromosome 3. Proc Natl Acad Sci U S A 101: 2488–2493, 2004 [DOI] [PMC free article] [PubMed] [Google Scholar]
- 15.Zheng Z, Schmidt-Ott KM, Chua S, Foster KA, Frankel RZ, Pavlidis P, Barasch J, D'Agati VD, Gharavi AG: A Mendelian locus on chromosome 16 determines susceptibility to doxorubicin nephropathy in the mouse. Proc Natl Acad Sci U S A 102: 2502–2507, 2005 [DOI] [PMC free article] [PubMed] [Google Scholar]
- 16.Zheng F, Plati AR, Potier M, Schulman Y, Berho M, Banerjee A, Leclercq B, Zisman A, Striker LJ, Striker GE: Resistance to glomerulosclerosis in B6 mice disappears after menopause. Am J Pathol 162: 1339–1348, 2003 [DOI] [PMC free article] [PubMed] [Google Scholar]
- 17.Pillebout E, Burtin M, Yuan HT, Briand P, Woolf AS, Friedlander G, Terzi F: Proliferation and remodeling of the peritubular microcirculation after nephron reduction: Association with the progression of renal lesions. Am J Pathol 159: 547–560, 2001 [DOI] [PMC free article] [PubMed] [Google Scholar]
- 18.Churchill GA, Doerge RW: Empirical threshold values for quantitative trait mapping. Genetics 138: 963–971, 1994 [DOI] [PMC free article] [PubMed] [Google Scholar]
- 19.Abiola O, Angel JM, Avner P, Bachmanov AA, Belknap JK, Bennett B, Blankenhorn EP, Blizard DA, Bolivar V, Brockmann GA, Buck KJ, Bureau JF, Casley WL, Chesler EJ, Cheverud JM, Churchill GA, Cook M, Crabbe JC, Crusio WE, Darvasi A, de Haan G, Dermant P, Doerge RW, Elliot RW, Farber CR, Flaherty L, Flint J, Gershenfeld H, Gibson JP, Gu J, Gu W, Himmelbauer H, Hitzemann R, Hsu HC, Hunter K, Iraqi FF, Jansen RC, Johnson TE, Jones BC, Kempermann G, Lammert F, Lu L, Manly KF, Matthews DB, Medrano JF, Mehrabian M, Mittlemann G, Mock BA, Mogil JS, Montagutelli X, Morahan G, Mountz JD, Nagase H, Nowakowski RS, O'Hara BF, Osadchuk AV, Paigen B, Palmer AA, Peirce JL, Pomp D, Rosemann M, Rosen GD, Schalkwyk LC, Seltzer Z, Settle S, Shimomura K, Shou S, Sikela JM, Siracusa LD, Spearow JL, Teuscher C, Threadgill DW, Toth LA, Toye AA, Vadasz C, Van Zant G, Wakeland E, Williams RW, Zhang HG, Zou F: The nature and identification of quantitative trait loci: A community's view. Nat Rev Genet 4: 911–916, 2003 [DOI] [PMC free article] [PubMed] [Google Scholar]
- 20.Morita T, Yamamoto T, Churg J: Mesangiolysis: An update. Am J Kidney Dis 31: 559–573, 1998 [DOI] [PubMed] [Google Scholar]
- 21.Bagchus WM, Hoedemaeker PJ, Rozing J, Bakker WW: Glomerulonephritis induced by monoclonal anti-Thy 1.1 antibodies: A sequential histological and ultrastructural study in the rat. Lab Invest 55: 680–687, 1986 [PubMed] [Google Scholar]
- 22.Eremina V, Cui S, Gerber H, Ferrara N, Haigh J, Nagy A, Ema M, Rossant J, Jothy S, Miner JH, Quaggin SE: Vascular endothelial growth factor a signaling in the podocyte-endothelial compartment is required for mesangial cell migration and survival. J Am Soc Nephrol 17: 724–735, 2006 [DOI] [PubMed] [Google Scholar]
- 23.Esquivel E, Mollet G, Lavin TA, Ratelade J, Beau V, Ayadi A, Bugeon L, Gubler MC, and Antignac C: A novel mouse model of podocin inactivation in the adult mouse, using a tamoxifen-inducible cre recombinase, develops nephrotic syndrome and glomerulosclerosis [Abstract]. J Am Soc Nephrol 17: 24A, 2006 [Google Scholar]
- 24.Hinkes BG, Mucha B, Vlangos CN, Gbadegesin R, Liu J, Hasselbacher K, Hangan D, Ozaltin F, Zenker M, Hildebrandt F: Nephrotic syndrome in the first year of life: Two thirds of cases are caused by mutations in 4 genes (NPHS1, NPHS2, WT1, and LAMB2). Pediatrics 119: e907–e919, 2007 [DOI] [PubMed] [Google Scholar]
- 25.Wlodek ME, Mibus A, Tan A, Siebel AL, Owens JA, Moritz KM: Normal lactational environment restores nephron endowment and prevents hypertension after placental restriction in the rat. J Am Soc Nephrol 18: 1688–1696, 2007 [DOI] [PubMed] [Google Scholar]
- 26.Hamosh M: Bioactive factors in human milk. Pediatr Clin North Am 48: 69–86, 2001 [DOI] [PubMed] [Google Scholar]
- 27.Hanayama R, Tanaka M, Miwa K, Shinohara A, Iwamatsu A, Nagata S: Identification of a factor that links apoptotic cells to phagocytes. Nature 417: 182–187, 2002 [DOI] [PubMed] [Google Scholar]
- 28.Silvestre JS, Thery C, Hamard G, Boddaert J, Aguilar B, Delcayre A, Houbron C, Tamarat R, Blanc-Brude O, Heeneman S, Clergue M, Duriez M, Merval R, Levy B, Tedgui A, Amigorena S, Mallat Z: Lactadherin promotes VEGF-dependent neovascularization. Nat Med 11: 499–506, 2005 [DOI] [PubMed] [Google Scholar]
- 29.Tang Y, McKinnon ML, Leong LM, Rusholme SA, Wang S, Akhurst RJ: Genetic modifiers interact with maternal determinants in vascular development of Tgfb1(−/−) mice. Hum Mol Genet 12: 1579–1589, 2003 [DOI] [PubMed] [Google Scholar]
- 30.Aubin-Houzelstein G, Da Silva NR, Bellier S, Salaun P, Montagutelli X, Panthier JJ: Genetic interaction between a maternal factor and the zygotic genome controls the intestine length in PRM/Alf mice. Physiol Genomics 16: 82–89, 2003 [DOI] [PubMed] [Google Scholar]
- 31.Putaala H, Soininen R, Kilpelainen P, Wartiovaara J, Tryggvason K: The murine nephrin gene is specifically expressed in kidney, brain and pancreas: Inactivation of the gene leads to massive proteinuria and neonatal death. Hum Mol Genet 10: 1–8, 2001 [DOI] [PubMed] [Google Scholar]
- 32.Ciani L, Patel A, Allen ND, ffrench-Constant C: Mice lacking the giant protocadherin mFAT1 exhibit renal slit junction abnormalities and a partially penetrant cyclopia and anophthalmia phenotype. Mol Cell Biol 23: 3575–3582, 2003 [DOI] [PMC free article] [PubMed] [Google Scholar]
- 33.Doyonnas R, Kershaw DB, Duhme C, Merkens H, Chelliah S, Graf T, McNagny KM: Anuria, omphalocele, and perinatal lethality in mice lacking the CD34-related protein podocalyxin. J Exp Med 194: 13–27, 2001 [DOI] [PMC free article] [PubMed] [Google Scholar]
- 34.Donoviel DB, Freed DD, Vogel H, Potter DG, Hawkins E, Barrish JP, Mathur BN, Turner CA, Geske R, Montgomery CA, Starbuck M, Brandt M, Gupta A, Ramirez-Solis R, Zambrowicz BP, Powell DR: Proteinuria and perinatal lethality in mice lacking NEPH1, a novel protein with homology to NEPHRIN. Mol Cell Biol 21: 4829–4836, 2001 [DOI] [PMC free article] [PubMed] [Google Scholar]
- 35.Hugo C, Shankland SJ, Bowen-Pope DF, Couser WG, Johnson RJ: Extraglomerular origin of the mesangial cell after injury: A new role of the juxtaglomerular apparatus. J Clin Invest 100: 786–794, 1997 [DOI] [PMC free article] [PubMed] [Google Scholar]
- 36.Turner ST, Kardia SL, Mosley TH, Rule AD, Boerwinkle E, de Andrade M: Influence of genomic loci on measures of chronic kidney disease in hypertensive sibships. J Am Soc Nephrol 17: 2048–2055, 2006 [DOI] [PubMed] [Google Scholar]
- 37.Leon JM, Freedman BI, Miller MB, North KE, Hunt SC, Eckfeldt JH, Lewis CE, Kraja AT, Djousse L, Arnett DK: Genome scan of glomerular filtration rate and albuminuria: The HyperGEN study. Nephrol Dial Transplant 22: 763–771, 2007 [DOI] [PubMed] [Google Scholar]
- 38.Deen WM: What determines glomerular capillary permeability? J Clin Invest 114: 1412–1414, 2004 [DOI] [PMC free article] [PubMed] [Google Scholar]
- 39.Birn H, Christensen EI: Renal albumin absorption in physiology and pathology. Kidney Int 69: 440–449, 2006 [DOI] [PubMed] [Google Scholar]
- 40.Livak KJ, Schmittgen TD: Analysis of relative gene expression data using real-time quantitative PCR and the 2(-Delta Delta C(T)) method. Methods 25: 402–408, 2001 [DOI] [PubMed] [Google Scholar]
Associated Data
This section collects any data citations, data availability statements, or supplementary materials included in this article.