

Abstract
Renal injury in the Dahl salt-sensitive rat mimics human salt-sensitive forms of hypertension that are particularly prevalent in black individuals, but the mechanisms that lead to the development of this injury are incompletely understood. We studied the impact of renal perfusion pressure (RPP) on the development of renal injury in this model. During the development of salt-induced hypertension over 2 wk, the RPP to the left kidney was maintained at control levels (125 ± 2 mmHg) by continuous servocontrol inflation of an aortic balloon implanted between the renal arteries; during the same period, the RPP to the right kidney rose to 164 ± 8 mmHg. After 2 wk of a 4% salt diet, DNA microarray and real-time PCR identified genes related to fibrosis and epithelial-to-mesenchymal transition in the kidneys exposed to hypertension. The increased RPP to the right kidney accounted for differences in renal injury between the two kidneys, measured by percentage of injured cortical and juxtamedullary glomeruli, quantified proteinaceous casts, number of ED-1–positive cells per glomerular tuft area, and interstitial fibrosis. Interlobular arteriolar injury was not increased in the kidney exposed to elevated pressure but was reduced in the control kidney. We conclude that elevations of RPP contribute significantly to the fibrosis and epithelial-to-mesenchymal transition found in the early phases of hypertension in the salt-sensitive rat.
Rapid development of renal injury is a prominent feature of salt-induced hypertension in the Dahl salt-sensitive (SS) rat. Within a few weeks of high salt exposure, SS rats develop substantial injuries in preglomerular vessels, glomeruli, and the tubulointerstitial compartment.1–3 This prominence of renal injury in the SS rat mimics human salt-sensitive forms of hypertension that are particularly prevalent in black individuals.4
The extent of renal injury is known to vary widely in various forms of hypertension. Rapid development of renal injury in SS rats is in sharp contrast with that observed in spontaneously hypertensive rats (SHR), another commonly used rat model of hypertension. Hypertension in the SHR of a magnitude and duration similar to that seen in SS rats results in little or no renal injury.5–8 Moreover, although it is recognized that hypertension is a strong independent risk factor for renal failure, the effectiveness of BP control in the reduction of renal injury varies greatly between subpopulations of hypertensive patients.9–11 These observations have clouded the question of how much physical factors related to the elevation of renal perfusion pressure (RPP) actually contribute to renal injury in hypertension. This issue has not been easily clarified given the difficulty in sustaining a chronic increase of arterial pressure without concomitantly altering the systemic neurohormonal factors such as circulating levels of angiotensin II (AngII) and other factors known to cause tissue injury independent of elevated arterial pressure.12
In this study, we applied unique techniques that enabled us to determine the contribution of RPP in the development of renal injury in SS rats. We used a chronic pressure servocontrol technique that we previously used in an AngII + high-salt model of hypertension.12 The system maintained the RPP to the left kidney of the SS rat at control levels for several weeks, whereas RPP to the right kidney increased in response to a high-salt diet (4.0% NaCl). Both the left and the right kidney were therefore exposed to an identical systemic neurohormonal and metabolic environment, but different levels of RPP with the left kidney protected from the high pressure. A functional genomic approach using microarrays was applied to identify molecular pathways potentially mediating the injurious effects of the elevated perfusion pressure, whereas histologic methods were used to validate these pathways and quantify the differential injury between these two kidneys in the SS rat.
RESULTS
RPP to Left and Right Kidneys
The average pressure values of the servocontrolled (n = 6) and sham rats (n = 6) are summarized in Figure 1A. After switching from the 0.4 to 4.0% salt diet, average 24-h right kidney RPP (measured from the carotid artery) increased significantly by the third day of high salt when compared with the last day of 0.4% salt diet of 129± 2 and continued to rise to 164 ± 8 mmHg by day 14 of 4.0% high-salt diet. Two of the rats were terminated on day 10 of high salt for technical reasons and the remaining four on day 14. Kidney tissue from these six rats was used for all subsequent histologic and microarray analyses. The RPP to the left kidney of the same rats (measured from the femoral artery) was servocontrolled to within ±4 mmHg of baseline pressure values, which averaged 125± 2 during the control period and remained unchanged after switching to 4.0% high-salt diet. Baseline mean arterial pressure of a separate group of sham rats (n = 6) averaged 126± 1.5 mmHg and stayed relatively constant throughout the study with day 14 averaging 131± 3 mmHg while maintained on the 0.4% salt diet. A representative pressure tracing of the RPP to the right and left kidneys in a single servocontrolled rat is shown in Figure 1B. Typically in the SS rats, diurnal variations of >50 mmHg were observed, becoming especially prominent during the period of 4.0% high salt. RPP fell to levels almost equal to those of the controlled left RPP during the resting (daylight) phase of the cycle.
Figure 1.

(A) In SS rats (n = 6), the femoral arterial pressure (○) was monitored to reflect the perfusion pressure of the left kidney, which was continuously servocontrolled at the baseline level after initiation of the 4.0% NaCl diet. The carotid arterial pressure of the same rats (•), reflecting the perfusion pressure of the right kidney, was allowed to increase in response to the increased salt diet. A separate sham group of SS rats (n = 6; ▴) were maintained on 0.4% salt diet throughout the study. Means ± SEM of 24 h averages are summarized for each day of study. (B) A representative pressure tracing of 3-min averages is shown from a single rat.
Chronically Elevated RPP Altered the Gene Expression Profile of the Outer Medulla
The approximately 20,000-element cDNA microarray was used to identify differences of gene expression profiles between the outer medulla of the right uncontrolled and the left servocontrolled kidneys (n = 6) and provide insights into the molecular effect of high RPP. Six biologic replicates with two technical replicates (dye switching) were examined. The criteria for differential expression were an absolute mean log2 ratio >0.4465, corresponding to three times the SD of log2 ratios of all genes and a P < 0.03. With these criteria, 57 genes (Table 1) were identified as differentially expressed, with a false discovery rate of 2% based on permutations (see the Concise Methods section).
Table 1.
Genes differentially expressed between the outer medulla of the uncontrolled right kidney (high pressure) and the servocontrolled left kidney (normal pressure)
| Gene Name | GenBank Accession No. | UniGene ID | Log2 Ratioa | SEM | Pb |
|---|---|---|---|---|---|
| Early growth response 1 | AA956793 | Rn0.9096 | 1.3020 | 0.4141 | 0.0256 |
| EST | AI029704 | Rn0.18303 | 1.0688 | 0.2897 | 0.0142 |
| Serine (or cysteine) proteinase inhibitor, member 1 | AA965232 | Rn0.29367 | 1.0539 | 0.2103 | 0.0041 |
| Steroid sensitive gene 1 | AA819770 | Rn0.2193 | 0.9211 | 0.2350 | 0.0112 |
| α2-Macroglobulin | AA859825 | Rn0.780 | 0.9027 | 0.0778 | 0.0001 |
| Jun B proto-oncogene | AI044131 | Rn0.15806 | 0.8913 | 0.1859 | 0.0049 |
| Tissue inhibitor of metalloproteinase 1 | AA957593 | Rn0.25754 | 0.7872 | 0.1760 | 0.0066 |
| EST, highly similar to A32296 ubiquinol–cytochrome c reductase | AA859146 | Rn0.2603 | 0.7759 | 0.1537 | 0.0039 |
| EST | AI045219 | Rn0.13884 | 0.7347 | 0.1856 | 0.0108 |
| EST, weakly similar to S23094 β-amyloid protein precursor | AA963987 | Rn0.2157 | 0.7069 | 0.1734 | 0.0096 |
| B cell translocation gene 2 | AA925277 | Rn0.27923 | 0.6945 | 0.1531 | 0.0062 |
| EST | AA899165 | Rn0.13782 | 0.6847 | 0.1788 | 0.0123 |
| Glycosylation-dependent cell adhesion molecule 1 | AI070974 | Rn0.10939 | 0.6618 | 0.1103 | 0.0018 |
| EST, moderately similar to T30249 cell proliferation antigen Ki-67 | AA997800 | Rn0.12774 | 0.6565 | 0.1510 | 0.0074 |
| EST, weakly similar to mouse small inducible cytokine B13 precursor | AA899765 | Rn0.6917 | 0.6555 | 0.2031 | 0.0233 |
| EST, highly similar to S34839 collagen α1(VI) | AA964429 | Rn0.40577 | 0.6514 | 0.0997 | 0.0013 |
| EST, highly similar to S34839 collagen α1(VI) | AA955473 | Rn0.40577 | 0.6370 | 0.0806 | 0.0005 |
| EST | AA819208 | Rn0.16630 | 0.6343 | 0.1023 | 0.0016 |
| Regulator of G-protein signaling protein 2 | AI045777 | Rn0.1892 | 0.6181 | 0.0605 | 0.0002 |
| EST, highly similar to tropomyosin, fibroblast isoform 1 | AA858875 | Rn0.17580 | 0.6134 | 0.1323 | 0.0057 |
| EST, weakly similar to serine protease inhibitor 1 | AA859286 | Rn0.16993 | 0.6115 | 0.1069 | 0.0023 |
| Cysteine-rich protein 61 | AA956209 | Rn0.22129 | 0.6088 | 0.1017 | 0.0019 |
| EST | AA859181 | Rn0.22294 | 0.6065 | 0.0845 | 0.0008 |
| DEXRAS1 (Dexras1) | AA899689 | Rn0.7500 | 0.6052 | 0.0777 | 0.0006 |
| EST | AA956659 | Rn0.9050 | 0.5683 | 0.1243 | 0.0060 |
| Procollagen, type I, α2 | AA859538 | Rn0.16629 | 0.5663 | 0.1352 | 0.0086 |
| EST | AA957270 | Rn0.8543 | 0.5644 | 0.0998 | 0.0024 |
| Zinc finger protein 36 | AA858882 | Rn0.82737 | 0.5433 | 0.1345 | 0.0099 |
| EST, highly similar to S32604 collagen α2(VI) | AA998676 | Rn0.11889 | 0.5382 | 0.1284 | 0.0086 |
| Macrophage galactose N-acetyl-galactosamine specific lectin | AA859824 | Rn0.779 | 0.5298 | 0.0453 | 0.0001 |
| EST, moderately similar to T19347 hypothetical protein | AA964242 | Rn0.23878 | 0.5276 | 0.1082 | 0.0046 |
| EST | AA998822 | Rn0.13204 | 0.5228 | 0.1101 | 0.0051 |
| Fatty acid binding protein 5, epidermal | AA900919 | Rn0.4064 | 0.5178 | 0.1296 | 0.0104 |
| EST, weakly similar to S23094 beta-amyloid protein precursor | AA819676 | Rn0.2157 | 0.5142 | 0.0852 | 0.0018 |
| EST | AI715219 | Rn0.41184 | 0.5142 | 0.1583 | 0.0227 |
| Rattus norvegicus LIM-domain protein LMP-1 | AA901403 | Rn0.7274 | 0.5127 | 0.1703 | 0.0297 |
| α2-Macroglobulin | AA900582 | Rn0.780 | 0.5032 | 0.1029 | 0.0045 |
| EST | AA858974 | Rn0.2513 | 0.5027 | 0.1148 | 0.0072 |
| EST, moderately similar to A37098 human gelation factor ABP-280, long form | AA924461 | Rn0.4213 | 0.5013 | 0.1361 | 0.0142 |
| EST | AA956677 | Rn0.40162 | 0.4984 | 0.1331 | 0.0134 |
| Growth arrest specific 7 | AI029758 | Rn0.17160 | 0.4967 | 0.1503 | 0.0213 |
| EST | AA963919 | Rn0.8543 | 0.4941 | 0.1499 | 0.0216 |
| Rattus norvegicus gelatinase A | AI044835 | Rn0.6422 | 0.4909 | 0.0837 | 0.0020 |
| EST | AA998563 | Rn0.13118 | 0.4842 | 0.1088 | 0.0067 |
| EST, highly similar to T02435 probable human oxysterol-binding protein | AA899675 | Rn0.40484 | 0.4839 | 0.0803 | 0.0018 |
| Solute carrier family 34 (sodium phosphate), member 2 | AA858973 | Rn0.16933 | 0.4766 | 0.1081 | 0.0070 |
| EST, highly similar to mouse collagen alpha 1 (IV) | AA964281 | Rn0.11762 | 0.4765 | 0.1451 | 0.0219 |
| EST, highly similar to A37100 myosin regulatory light chain A, smooth muscle | AA819419 | Rn0.6870 | 0.4706 | 0.1165 | 0.0099 |
| EST | AA875185 | Rn0.23088 | 0.4611 | 0.1008 | 0.0060 |
| EST | AA859186 | Rn0.32019 | 0.4575 | 0.1098 | 0.0088 |
| Transgelin (smooth muscle 22 protein) | AA819452 | Rn0.34397 | 0.4575 | 0.1187 | 0.0120 |
| Complement component 4 | AA965125 | Rn0.30176 | 0.4571 | 0.1073 | 0.0080 |
| EST | AI511382 | Rn0.34704 | −0.4602 | 0.1471 | 0.0260 |
| EST | AI713223 | Rn0.41379 | −0.4707 | 0.1033 | 0.0061 |
| EST | AI043947 | Rn0.64283 | −0.5448 | 0.1670 | 0.0224 |
| Insulin-like growth factor–binding protein 5 | AI070577 | Rn0.9994 | −0.578 | 0.1604 | 0.0155 |
Log2 ratio of right over left kidney averaged across six rats.
From t tests comparing the log2 ratios for each gene to 0. See the Concise Methods section for additional explanations of the criteria for differential expression.
Real-time PCR analysis was performed for eight of the identified genes using the same RNA samples used in the microarray studies. These eight genes spanned the entire ranges of log2 ratio and P value of the identified genes. The real-time PCR results were directionally consistent with the microarray data for all eight genes (Figure 2). Moreover, the differential expression of five of the eight genes was statistically significant on the basis of real-time PCR, thus supporting the overall reliability of the microarray data.
Figure 2.

Eight of the 57 genes found by microarray to be differentially expressed between the outer medulla of the uncontrolled right kidney (high pressure) and controlled left kidney (normal pressure) were analyzed using real-time PCR. Ratios of higher pressure kidneys (right kidneys) over lower pressure kidneys (left kidneys) for mRNA expression level are shown for the microarray (▪) and real-time PCR methods ( ); n = 6 for microarray, n = 6 for real-time PCR; *P < 0.05. C4, complement C4; Col IVα1, collagen type IV α1; EGR1, early growth response 1; GPSP2, regulator of G-protein signaling protein 2; IGFBP5, insulin-like growth factor-binding protein 5; MM2, matrix metalloproteinase 2; Myl9, myosin regulatory light chain Myl9; TIMP-1, tissue inhibitor of metalloproteinase 1.
Functional Pathways within Renal Medulla Activated by Elevated RPP
Functional annotation of the identified genes suggested several pathways in the outer medulla of the uncontrolled right kidney that might lead to increased levels of fibrosis and epithelial-to-mesenchymal transition (EMT). Specifically, tissue inhibitor of metalloproteinase 1, serine protease inhibitor, and α2-macroglobulin, all inhibitors of local proteolysis, were upregulated in the medulla of the hypertensive right kidney. Smooth muscle protein 22 (transgelin, a smooth muscle–specific protein) and collagen IV α1, a basement membrane component, were also upregulated. As described next, results obtained from immunohistochemical preparations and quantification of tissue for smooth muscle actin (SMA) strongly supported the predictions of these microarray data.
Chronically Elevated RPP Exacerbates Renal Injury in Dahl S Rats
Interstitial Fibrosis.
The uncontrolled right kidneys exposed to the elevated RPP showed prominent interstitial fibrosis compared with the servocontrolled left kidney as determined by SMA and collagen IV staining (Figure 3). Together, the gene expression data confirmed by the results of the immunohistochemistry indicate that the outer medulla of the right kidney underwent EMT and extracellular matrix formation that was driven specifically by the elevation of RPP to that kidney.
Figure 3.

Positive immunostaining of SMA (▪), a marker of epithelial transdifferentiation, and collagen IV () was greater in the outer medulla of the uncontrolled right kidney than the controlled left kidney (n = 6; *P < 0.05).
Tubular Injury.
Gomori trichrome staining showed casts predominately in medullary thick ascending limbs and was observed in both servocontrolled and uncontrolled kidneys, as shown in Figure 4, top. The protein cast region of the outer medulla was quantified from the Gomori trichrome–stained sections, as summarized in Figure 5A. Cast formation tended to be higher in the uncontrolled right kidney than in the servocontrolled left kidney (P = 0.052). Sham data of the left kidney of 0.4% salt fed SS rats, shown in Table 2, did not differ significantly from the servocontrolled left kidney of the 4.0% salt-fed rats. Osteopontin (OPN) expression was also determined as an index of tubular injury with staining for OPN in the juxtamedullary region (Figure 4C). OPN staining was also observed in Bowman's capsule, cortical proximal tubules, thick ascending limb, distal tubules, and collecting ducts (Figure 4, bottom). Quantification of the number of OPN-positive tubules as summarized in Figure 5B indicated a significantly higher number of positive proximal tubules in the cortex of the uncontrolled right kidneys compared with the servocontrolled (P < 0.05) left kidneys. A similar tendency was observed in the outer medullary tubules, but this difference did not reach statistical significance.
Figure 4.

Representative images demonstrating the renal injury in uncontrolled right kidney and the servocontrolled left kidney. (A) Casts demonstrated with Gomori's trichrome staining. (B) Interstitial fibrosis in the renal outer medulla determined by immunostaining with SMA antibody. (C) Tubular injury in the renal juxtamedullary region determined by immunostaining with OPN antibody.
Figure 5.

(A) The percentage of the outer medulla containing blocked tubules filled with protein (percentage of cast region) was determined from Gomori trichrome–stained kidney sections. The uncontrolled right kidney tended to be higher than the servocontrolled left kidney (P = 0.052). (B) Positive immunostaining of OPN was quantified in both cortex and outer medulla. OPN expression was significantly increased in the cortex of uncontrolled high-pressure right kidney compared with the servocontrolled left kidney (n = 6; *P < 0.05). No sham data were obtained for this measurement.
Table 2.
Comparison of left servocontrolled kidney from 4.0% NaCl-fed SS rats with the left sham kidney from 0.4% NaCl-fed SS rats
| Measurement | Left Servo (4.0%; Mean ± SEM [n]) | Left Sham (0.4%; Mean ± SEM [n]) |
|---|---|---|
| SMA analysis (positive area) | 1.88 ± 0.49 (6) | 1.62 ± 0.35 (6) |
| % of cast region | 2.83 ± 0.93 (6) | 3.27 ± 0.79 (6) |
| % injured cortical glomeruli (score >2) | 24.74 ± 3.55 (6) | 21.55 ± 2.77 (6) |
| % injured juxtamedullary glomeruli (score >2) | 21.36 ± 1.39 (6) | 15.96 ± 2.45 (6) |
| ED-1–positive cells/glomerular tuft | 1.56 ± 0.15 (6) | 1.28 ± 0.12 (9) |
| Wall thickness ratio | 0.76 ± 0.03 (6) | 0.85 ± 0.02 (6)a |
Significantly different from Left Servo; P < 0.05.
Glomerular Injury.
As illustrated in Figure 6, >40% of the glomeruli of kidneys exposed to the hypertension exhibited some degree of abnormality (scores >2 on a scale of 1 to 4). In the outer cortical region and the juxtamedullary region of the uncontrolled right kidneys, there was a significantly greater percentage of glomeruli with scores >2 than in the pressure-controlled left kidneys. Glomerular injury of the sham kidneys was similar to that of servocontrolled kidneys in both the outer cortical and juxtamedullary regions. These results show that glomerular injury in both of these regions was significantly determined by the elevated RPP.
Figure 6.

A glomerulus visualized by Gomori trichrome stain was considered injured when its injury score was >2 on a scale of 0 to 4. The percentage of glomeruli with an injury score >2 was determined for the cortical (▪) and the juxtamedullary () glomeruli. The protected, servocontrolled left kidney had significantly fewer injured glomeruli in both regions than in the uncontrolled, high-pressure right kidney (n = 6; *P < 0.05). Sham left kidney was not significantly different from the servocontrolled left kidney (Table 2).
Glomerular macrophage infiltration was observed most predominantly in the outer cortical glomeruli as indicated by the number of ED-1–positive cells in these glomerular tufts, as summarized in Figure 7. The average number of ED-1–positive cells was higher in the right uncontrolled kidney compared with the left controlled kidney. Sham kidney ED-1 cells did not differ significantly from the servocontrolled left kidney.
Figure 7.

Kidneys were immunostained with ED-1 antibody, and the number of ED-1–positive cells in the glomerular tuft was determined as an indication of macrophage infiltration. Consistent with the glomerular injury shown in Figure 6, there were fewer ED-1 cells observed in the servocontrolled left kidney compared with those of the uncontrolled right kidney (n = 6; *P < 0.05). ED-1–positive cells of sham left kidneys (Table 2) were not different from those of controlled left kidney.
Preglomerular Vascular Injury.
In examination of tissue for vascular injury, there was minimal fibrinoid necrosis, thrombosis, or myointimal proliferation in the interlobular artery. Differences in median wall thickness were therefore determined as shown in Figure 8. The median wall thickness ratio of the left servocontrolled kidneys was significantly (P < 0.05) less than that of the uncontrolled right kidneys; however, the median wall thickness ratio of sham kidneys was similar to those of uncontrolled right kidneys, indicating that the vessels of the hypertensive right kidney were not hypertrophied but that the vessels of the servocontrolled left kidney had undergone a reduction in wall thickness.
Figure 8.
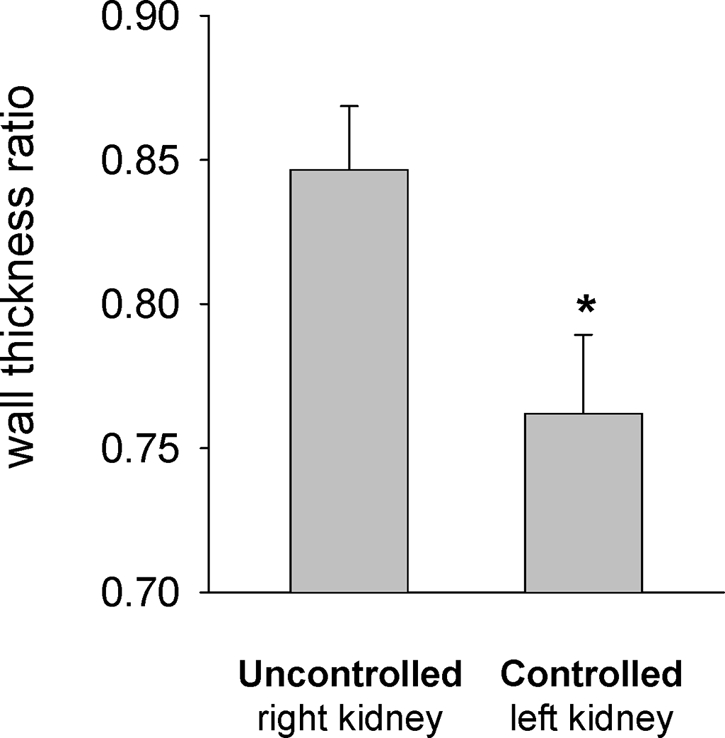
Interlobular arterial injury was determined by tracing the inner and outer circumferences with image analysis software and determining the ratio of the area of the inner lumen to the area of the outer circumference of the vessel. Median wall thickness ratio of the servocontrolled left kidney was significantly less than uncontrolled right kidney (n = 6; *P < 0.05). The ratio for the sham kidney (Table 2) was significantly higher than the uncontrolled left kidney.
DISCUSSION
These results demonstrate that chronic elevation of RPP contributes significantly to the renal injury seen in SS rats during the early phase of salt-induced hypertension. These elevations of RPP alter expression of genes in the outer medulla of the hypertensive kidney that contribute to EMT and fibrotic injuries in this region of the kidney.
Possible Mechanisms Responsible for Pressure-Induced Renal Injury
The combination of physiologic and genomic techniques used in this study enabled the examination of some of the complex biologic processes that responded to the chronic elevations of RPP.13–15 The analysis of differentially expressed genes predicted that the chronic elevations in RPP to the right kidney would induce EMT and fibrotic injuries. The immunohistochemical analyses carried out confirmed the functional pathways predicted by the microarray analysis. Results from other studies in our laboratory indicate that even in the prehypertensive (0.4% salt diet) state, the renal medulla of the SS rat exhibits a profibrotic gene expression profile compared with the salt-insensitive consomic SS.13BN and the BN strains.16,17 This study demonstrated that the elevation of RPP in the SS rat greatly enhanced this profibrotic gene expression profile and was responsible for the rapid EMT, matrix synthesis, and interstitial fibrosis. We could not distinguish between pressure-induced changes in gene expression and those related to secondary downstream responses associated with renal injury in this study because it was not practical to examine multiple time points by microarray. We believe that we are observing a downstream response to pressure-induced injury, and the pattern of gene expression points to EMT.
More specific, expression of the tissue metalloproteinase inhibitor (MMP-2) was significantly higher in the outer medulla of the uncontrolled right kidneys, a gene that has been reported to be enhanced during the acute ischemic renal injury and 8 wk after reperfusion but then reduced after 16 to 24 wk.18 An early increase in MMP-2 has also been observed in a ureteral obstruction.18 MMP-2 initiates the proteolytic digestion of epithelial basement membrane and induces EMT.19 The greater expression of this gene and the associated increases of SMA in the outer medulla of the uncontrolled right kidney suggest that the increase in RPP stimulated MMP, which in turn induced EMT, resulting in the pronounced interstitial fibrosis.
The precise mechanism(s) whereby elevations of RPP can alter the observed changes of gene expression remains to be determined. In wound healing, it has been found that mechanical forces stimulate TGF-β associated EMT.20,21 TGF-β is also known to stimulate MMP-2 and SMA in tubular epithelial cells,19 although differential expression of the TGF-β gene was not observed in our microarray study. Because we previously observed that TGF-β protein is strongly expressed in the renal injury of high RPP kidney of AngII + salt hypertensive rats,12 it seems that the microarray assay was not sufficiently sensitive to distinguish differences in the expression of this gene.
Elevations of RPP that increase sodium and fluid delivery to the medullary thick ascending limb (mTAL) and distal tubule may be responsible for initiating some of the observed responses. The SS rat has a defective pressure-natriuresis mechanism22,23 and exhibits increased reabsorption of NaCl in the mTAL.24,25 A high-salt diet with increased filtration would be expected to lead to an increased delivery of NaCl to the mTAL and therefore to abnormally high levels of transport and metabolic activities in the distal nephron. We have found that increasing the amount of sodium in the superfusion24 or perfusion25 solution in a tissue strip preparation increases production of superoxide in the mTAL, and we hypothesized that this could trigger inflammation, EMT, and fibrotic injuries in the outer medulla.
It is also possible that the servocontrolled left kidney of the SS rats experienced a reduction of renal blood flow and excess renin release. Although renal blood flow was not measured in these studies, we believe this reduction is unlikely. It has been reported that SS rats exhibit reductions of renal blood flow at pressures below 120 mmHg.26 In this study, because the servocontrol pressures to the left kidney averaged 125 mmHg, blood flow probably remained within the autoregulatory range. In our previous study using Sprague-Dawley rats, we did not observe an increase in plasma renin activity, suggesting there was adequate blood flow to the servocontrolled kidney.12
Perfusion-Induced Stimulation of Renal Inflammatory Changes
In an effort to understand better the inflammatory pathways that could be stimulated in this model, we probed tissue for OPN and ED-1. OPN is a secreted glycoprotein that is present in normal kidney,27 although its constitutive expression differs between tubular segments and between species. It has been reported that OPN is expressed primarily in the thin limb of Henle in rats27 and is overexpressed in many models of renal injury, such as in AngII-induced hypertension,28 streptozotocin-induced diabetes,29 five-sixths nephrectomy–high-salt hypertension,30 and ureteral obstruction.31 This is consistent with the results of this study in which OPN expression was increased in Bowman's capsule, cortical proximal tubules, thick ascending limb, distal tubules, and collecting ducts.
Elevated RPP was also associated with macrophage infiltration as determined by the number of ED-1–positive cells in the glomerular tuft of the uncontrolled hypertensive kidneys. This response could be secondary to the pressure-induced rise in OPN expression because others have found that OPN levels correlate with macrophage infiltration.28 Long-term administration of an anti-OPN antibody has also been found to reduce macrophage infiltration and renal injury in a rat model of crescentic glomerulonephritis.32 Our results therefore suggest that the elevated RPP stimulated inflammatory changes in Bowman's capsule and tubules as evidenced by the increased OPN and macrophage infiltration observed in the uncontrolled right kidney.
Oxidative stress has been shown to be elevated in kidneys of SS rats,33–35 and we have shown that it is enhanced specifically in the outer medulla even before the high-salt diet.34 Enhanced production of superoxide in this region can cause reduction in medullary blood flow and hypoxia,36 which in turn may stimulate renal injury. It seems from this study that the development of renal injury that progresses naturally in the outer medulla of the SS rats (as shown in a previous study37 and by the sham rats of this study) was significantly accelerated in the kidneys subjected to the elevated arterial pressure.
Differences in Vulnerability of Kidneys to Pressure-Induced Injury in Various Forms of Hypertension
Comparisons of the results of this study with those obtained in our previous analysis of the AngII + salt-induced model of hypertension indicate that neurohormonal, metabolic, and physiologic differences between different models of hypertension can determine the extent to which an elevation of perfusion pressure contributes to renal injury. The AngII model had minimal outer cortical glomerular injury when compared with the SS rats in this study. Nearly 75% of the injury in juxtamedullary glomeruli, interstitial fibrosis, and interlobular arteriole hypertrophy could be attributed to elevations of RPP in the uncontrolled hypertensive right kidney in the AngII model.12 In this study in SS rats (a low renin model of hypertension), the differences between the renal injury of the left servocontrolled and right uncontrolled kidneys as determined by percentage of injured cortical and juxtamedullary glomeruli, percentage of cast region, ED-1–positive cells per glomerular tuft area, and interstitial fibrosis (SMA and collagen IV) could be accounted for by the increased renal perfusion pressure to the uncontrolled right kidney. This is concluded because we could find no differences in any of these parameters when comparing the sham left kidneys of the SS rats fed 0.4% salt diet with the servocontrolled left kidneys of SS rats fed the 4% salt diet.
Both the SS and AngII models of hypertension differ from the SHR in which hypertension of the same magnitude and duration has been found to cause little or no renal injury.5–8,38 This is thought to be a consequence of predominant preglomerular vasoconstriction in the SHR that protects the glomeruli from the elevated perfusion pressure.39,40 In contrast, reduced levels of preglomerular vasoconstriction are thought to exist in the SS rat.41 Curiously, the servocontrolled SS kidney protected from the elevated RPP exhibited a reduced median wall thickness when compared with the sham control rats. Although we can only speculate about the reasons for this, it is possible that the blunted arterial pulse pressure distal to the aortic balloon occluder in the hypertensive rats may have resulted in an adaptive remodeling of these vessels.
It should be noted that precise calculation of the extent to which sodium intake, independent of the hypertension, accounted for renal injury was not possible because most of the indices of injury found in the sham control SS rats were nearly as great as those found in the left kidneys of the servocontrolled rats (glomerular injury, SMA, and ED-1) and in some cases exceeded that found in the servocontrolled kidney (as with median wall thickness); however, it is evident that nearly all of the additional renal injury of the right hypertensive kidney was pressure dependent.
Clinical Implications
The findings of this study have important clinical implications because the effectiveness of antihypertensive therapies on the reduction of renal injury remains a point of considerable debate. Some drugs, such as angiotensin-converting enzyme inhibitors and angiotensin receptor blockers, seem to have renoprotective effects beyond what can be explained by the reduction of BP in certain patient populations.42 Conversely, in mega-trials such as Antihypertensive and Lipid-Lowering Treatment to Prevent Heart Attack Trial (ALLHAT), no major differences in the number of cardiovascular events and ESRD have been found among calcium channel blockers, angiotensin-converting enzyme inhibitors, and diuretics.43,44 Ogawa et al.45 reported that although renin-angiotensin system blockers, when compared with calcium antagonists had a greater effect in reducing proteinuria in patients with diabetic nephropathy and in whom pressure was relatively high, while no difference was found in patients in whom the BP was relatively normal. Comparison of this study with our previous AngII + salt study12 suggests that the relative contributions of physical and biochemical factors to hypertensive renal injury may vary in different types of hypertension. Accordingly, the effectiveness of various antihypertensive treatments on renoprotection would be expected to depend on the type of neurohormonal and metabolic imbalance that underlies the development of hypertension and the susceptibility of the kidney to injury.
CONCISE METHODS
Experimental Animals
All studies were performed on 8- to 9-wk-old male inbred Dahl SS rats (Dahl SS/JrHsdMcwi) that were provided water ad libitum and maintained on an AIN-76 rodent diet with 0.4% NaCl (Dyets, Bethlehem, PA) from weaning. All protocols were approved by the Medical College of Wisconsin Institutional Animal Care and Use Committee.
Surgical Preparation
Rats were anesthetized with a mixture of ketamine (30 mg/kg, intramuscularly), xylazine (2 mg/kg, intramuscularly), and acepromazine (2 mg/kg, intramuscularly). The surgical preparation was performed as described previously12 and completed in 75 min with 7 d of recovery before study. Indwelling catheters were implanted in the right carotid and left femoral arteries and the left femoral vein. An inflatable silastic vascular occluder (1.5 mm lumen diameter, 2.5 mm width; Kent Scientific Corp., Torrington, CT) was positioned around the aorta between the left and right renal arteries through a midsagittal abdominal incision. The occluder cuff was attached to an 80-cm length of flexible Tygon tubing (0.76 mm inner and 2.29 mm outer diameter) that was exteriorized at the back of the neck with the vascular catheters and attached to a servocontrolled pump for inflation. The sham group was prepared in an identical manner, but the occluder cuff was never inflated.
Hemodynamic Measurements and Servocontrol of RPP
As described previously,12 a bidirectional turntable cage system (Rodent workstation with Raturn system; Bioanalytical Systems, West Lafayette, IN) enabled free movement of the rat throughout the study while protecting the catheter and occluder lines lightly tethered above the cage. Rats were conditioned to the turntable cage for several days before surgery. Arterial pressure above (carotid artery; right kidney RPP) and below (femoral artery; left kidney RPP) the aortic occluder cuff was continuously recorded (24 h/d) throughout the study with the pressure signals from the left femoral artery relayed to a computerized servocontrol unit to adjust the inflation of the aortic occluder cuff to servocontrol the RPP to the left kidney.
Experimental Design
After recovery from surgery, BP was measured for at least 3 control days of stable pressures before changing the diet on the servocontrol group from 0.4 to 4.0% NaCl, and measurements were continued for 14 d. Left RPP, as determined by femoral arterial pressure, was set to the average pressure obtained during the 3 d of baseline measurement and servocontrolled for 10 to 14 d during the development of the salt-induced hypertension. The sham group was maintained on the 0.4% NaCl diet for the duration of the study.
The contribution of RPP to the renal injury was determined by comparing the right uncontrolled kidney with the left servocontrolled kidney. The contribution of pressure-independent injury that is associated with the natural progression of renal disease in the SS strain on a 4% salt diet was determined by comparing the renal injury in the servocontrolled left kidney with the left kidney of the sham rats fed only the 0.4% salt diet.
Rats were killed by excess sodium pentobarbital (100 mg/kg) at the end of the study, and the kidneys were removed. Half of the kidney was immersion-fixed in 10% neutral buffered formalin and paraffin embedded. The outer medulla of the other half of the kidney was snap-frozen and stored at −80°C for isolation of RNA for gene expression profiling. The kidney tissue collected from the six servocontrolled rats was used for all subsequent histologic and microarray analyses.
Gene Expression Profiling
A microarray containing 17,664 elements of rat cDNA probes and 768 elements of control solutions was constructed and hybridized using a two-color (Cy3 and Cy5) method as described previously.16,17,46–49 cDNA products prepared from the outer medulla of the uncontrolled right and the controlled left kidneys of the same hypertensive rat were labeled with Cy3 and Cy5, respectively, and co-hybridized to a microarray. The hybridization was repeated on a second microarray with the two fluorescence dyes switched between the two kidneys.50 A total of 12 microarrays were used to examine six pairs of outer medulla samples. The fluorescence intensity was extracted using Imagene 4.1 and categorized, filtered, adjusted, log transformed, and normalized to generate “qualified data” using the software ADAB based on the algorithms described previously.16 A mean log2 ratio of right over left kidney and a P value based on paired t test were generated by ADAB for each gene that had qualified data in all 12 microarrays. A log2 ratio value and a P value were selected as tentative criteria of differential expression. False discovery rate was determined by permutations as described previously.48 The criteria of differential expression were then adjusted until an acceptable false discovery rate was obtained. The differentially expressed genes were annotated as described previously.16,17,48,49
Real-Time PCR
Real-time quantitative PCR was carried out with the same RNA used in the microarray studies using the ABI Prism 7900HT sequence detection system and SYBR Green reagents from Applied Biosystems (Foster City, CA) as described previously.48,49 The sequences of the primers used in this study are shown in Table 3.
Table 3.
Real-time PCR primersa
| Gene | GenBank Accession No. | Primer Sequences | Amplicon Position |
|---|---|---|---|
| EGR1 | AA956793 | Forward: AAGGCCGAGATGCAATTGAT | 271 to 349 |
| Reverse: TGTCCATGGTGGGTGAGTGA | |||
| TIMP1 | AA957593 | Forward: TCAGAGCCCATGAGGATCTGA | 184 to 246 |
| Reverse: CCCTTGCAAACTGGAGAGTGA | |||
| Col IVα1 | AA964281 | Forward: GGAGCGCCATTTGGAGTGT | 48 to 126 |
| Reverse: TTCGTTGGCCTCTGTTTGCT | |||
| GPSP2 | NM_053453 | Forward: ATTGATTCAATGTTGGGTAGTGAATC | 777 to 855 |
| Reverse: TCACACAGCAAGGGAAACTTCTC | |||
| IGFBP5 | AI070577 | Forward: CTTTAATCCTTGCAATTGGGACTT | 144 to 223 |
| Reverse: CTGTCCTCCAAACACTTGCAAA | |||
| MM2 | NM_031054 | Forward: AAGTGGGACAAGAACCAGATCAC | 825 to 903 |
| Reverse: AAGCATCATCCACGGTTTCAG | |||
| Myl9 | XM_215905 | Forward: CAAGGCCAAGACCACCAAGA | 432 to 510 |
| Reverse: CTGGATCTGGGACTGGTCAAA | |||
| C4 | AY149995 | Forward: TGGATGGTGCCAAGGAGTATC | 1718 to 1796 |
| Reverse: AGTGCCACCAGGGCTTCAG |
See legend of Figure 2 for definition of gene abbreviations.
Histologic Analysis
A robotic DAKO autostainer (S3400; Dako Cytomation, Carpinteria, CA) was used for all immunostaining procedures so that all samples were stained under the same conditions in parallel. For quantification of vascular, tubular, and glomerular injury, histology sections were stained with Gomori's trichrome stain to highlight the casts and the fibrotic tissue. Median wall thickness of interlobular arteries was determined by the ratio of the area of the inner lumen to the total area of the vessel with image analysis software as described previously.12 Glomerulosclerosis and mesangial matrix expansion were scored on a scale of 0 to 4 as described previously.12 Approximately 75 superficial cortical and 45 juxtamedullary glomeruli were scored (blindly) from a randomly chosen section, and the average was used for statistical analysis. Interstitial fibrosis was determined by immunostaining with antibodies for α-SMA (Dako Cytomation) and collagen type IV (Iowa Hybridoma Bank, University of Iowa, Iowa City, IA). SMA was detected with an Envision/HRP detection kit (Dako Cytomation), and collagen IV had an FITC-labeled secondary antibody. Adjoining serial sections were also immunostained with OPN (Santa Cruz Biotechnology, Santa Cruz, CA) to indicate tubular injury and ED-1 (AbD Serotec, Raleigh, NC) to indicate macrophage infiltration. The percentage of the outer medullary region positive for SMA or collagen type IV was determined in 20 randomly chosen frames at ×20 magnification captured by either a Leica 1000 microscope (Leica, Bannackburn, IL) or a Nikon E600 (Fryer Co., Chicago, IL) microscope equipped with a Spot Insight color CCD camera (Diagnostic Instruments, Sterling Heights, MI) and quantified using Metamorph image analysis software (version 4.6; Universal Imaging Systems Corp., MDS Analytical Technologies, Downingtown, PA). Adjacent serial sections stained with Gomori trichrome were magnified with this same setup, and the percentage of the outer medullary tissue containing blocked tubules filled with protein was quantified as percentage cast by determining the proportion of red-stained structures in this region using the Metamorph software as we have described previously.51 For OPN immunostaining, deparaffinized sections were retrieved by microwaving in 10 mM citrate buffer (pH 7.0) for 5 min, staining with anti-OPN (1:100; Santa Cruz Biotechnology), and visualized with diaminobenzidine containing nickel chloride. The number of OPN-positive tubules was counted in approximately 25 randomly chosen frames. For ED-1–immunostained slides, images of 100 randomly chosen superficial cortical glomeruli were captured to ascertain the macrophage cell infiltration per area of glomerular tuft, measured using ImageJ software (National Institutes of Health, Bethesda, MD). The data were analyzed as the number of ED-1–positive cells divided by the area of glomerular tuft as determined by tracing the outer circumference with the ImageJ software.
Statistical Analysis
Data are expressed at means ± SE. Daily BP changes were determined by a one-way repeated measures ANOVA followed by a Tukey post hoc test to determine the differences between the baseline period and the 4.0% salt-induced hypertensive period. Paired t tests were used to evaluate differences between the controlled and uncontrolled kidneys of the servocontrolled rats. Unpaired t test were used to compare the left servocontrolled kidney with the left sham kidney.
DISCLOSURES
None.
Acknowledgments
This work was supported by the National Institutes of Health, National Heart, Lung, and Blood Institute grants HL-29587, HL-81091, HL-66579, HL-54998, HL-49219, and HL-082798 and Grants-in-Aid for Scientific Research from the Ministry of Education, Culture, Sports, Science and Technology of Japan (17590181).
We thank Greg McQuestion, John Govin, Dave Eick, Mike Kloehn, and Bonnie Freudinger for expert assistance with the servocontrol unit and analysis programs; Nan Jiang and Yu Han for assistance with the microarray analysis; Carol Bobrowitz and Yoshimi Yoneki for histologic technical assistance; Adewumni Adeyemo and Glenn Slocum for the trichrome staining and analysis method; and Meredith Skelton for careful review of the manuscript. We also thank Dr. Sadayoshi Ito for professional support and tutorial on histologic analysis.
Published online ahead of print. Publication date available at www.jasn.org.
REFERENCES
- 1.Rapp JP, Dene H: Development and characteristics of inbred strains of Dahl salt-sensitive and salt-resistant rats. Hypertension 7: 340–349, 1985 [PubMed] [Google Scholar]
- 2.Cowley AW Jr., Roman RJ, Kaldunski ML, Dumas P, Dickhout JG, Greene AS, Jacob HJ: Brown Norway chromosome 13 confers protection from high salt to consomic Dahl S rat. Hypertension 37: 456–461, 2001 [DOI] [PubMed] [Google Scholar]
- 3.Chen PY, St. John PL, Kirk KA, Abrahamson DR, Sanders PW: Hypertensive nephrosclerosis in the Dahl/Rapp rat Initial sites of injury and effect of dietary L-arginine administration. Lab Invest 68: 174–184, 1993 [PubMed] [Google Scholar]
- 4.Rostand GS, Kirk KA, Rutsky EA, Pate BA. Racial differences in the incidence of treatment for end-stage renal disease. N Engl J Med 306: 1276–1279, 1982 [DOI] [PubMed] [Google Scholar]
- 5.Siegel AK, Kossmehl P, Planert M, Schulz A, Wehland M, Stoll M, Bruijn JA, de Heer E, Kreutz R: Genetic linkage of albuminuria and renal injury in Dahl salt-sensitive rats on a high-salt diet: Comparison with spontaneously hypertensive rats. Physiol Genomics 18: 218–225, 2004 [DOI] [PubMed] [Google Scholar]
- 6.Raij L, Azar S, Keane WF: Role of hypertension in progressive glomerular immune injury. Hypertension 7: 398–404, 1985 [PubMed] [Google Scholar]
- 7.Karlsen FM, Andersen CB, Leyssac PP, Holstein-Rathlou NH: Dynamic autoregulation and renal injury in Dahl rats. Hypertension 30: 975–983, 1997 [DOI] [PubMed] [Google Scholar]
- 8.Ishimitsu T, Uehara Y, Numabe A, Tsukada H, Ogawa Y, Iwai J, Ikeda T, Matsuoka H, Sugimoto T, Yagi S: Interferon gamma attenuates hypertensive renal injury in salt-sensitive Dahl rats. Hypertension 19: 804–808, 1992 [DOI] [PubMed] [Google Scholar]
- 9.Walker WG, Neaton JD, Cutler JA, Neuwirth R, Cohen JD, for the MRFIT Research Group: Renal function change in hypertensive members of the Multiple Risk Factor Intervention Trial: Racial and treatment effects. JAMA 268: 3085–3091, 1992 [PubMed] [Google Scholar]
- 10.Peterson JC, Adler S, Burkart JM, Greene T, Hebert LA, Hunsicker LG, King AJ, Klahr S, Massry SG, Seifter JL, for the Modification of Diet in Renal Disease (MDRD) Study Group: Blood pressure control, proteinuria and the progression of renal disease: The Modification of Diet in Renal Disease Study. Ann Intern Med 123: 754–762, 1995 [DOI] [PubMed] [Google Scholar]
- 11.Hebert LA, Kusek JW, Greene T, Agodoa LY, Jones CA, Levey AS, Breyer JA, Faubert P, Rolin HA, Wang SR: Effects of blood pressure control on progressive renal disease in blacks and whites. Modification of Diet in Renal Disease Study Group. Hypertension 30: 428–435, 1997 [DOI] [PubMed] [Google Scholar]
- 12.Mori T, Cowley AW Jr: Role of pressure in angiotensin II-induced renal injury: Chronic servo-control of renal perfusion pressure. Hypertension 43: 752–759, 2004 [DOI] [PubMed] [Google Scholar]
- 13.Cowley AW Jr, Mori T, Mattson D, Zou AP: Role of renal NO production in the regulation of medullary blood flow. Am J Physiol 284: R1355–R1369, 2003 [DOI] [PubMed] [Google Scholar]
- 14.Liang M, Cowley AW, Greene AS: High throughput gene expression profiling: A molecular approach to integrative physiology. J Physiol 554: 22–30, 2004 [DOI] [PMC free article] [PubMed] [Google Scholar]
- 15.Liang M, Cowley AW Jr, Hessner MJ, Lazar J, Basile DP, Pietrusz JL: Transcriptome analysis and kidney research: Toward systems biology. Kidney Int 67: 2114–2122, 2005 [DOI] [PubMed] [Google Scholar]
- 16.Liang M, Yuan B, Rute E, Greene AS, Zou AP, Soares P, McQuestion GD, Slocum GR, Jacob HJ, Cowley AW Jr: Renal medullary genes in salt-sensitive hypertension: A chromosomal substitution and cDNA microarray study. Physiol Genomics 8: 139–149, 2002 [DOI] [PubMed] [Google Scholar]
- 17.Liang M, Yuan B, Rute E, Greene AS, Olivier M, Cowley AW Jr: Insights into Dahl salt-sensitive hypertension revealed by temporal patterns of renal medullary gene expression. Physiol Genomics 12: 229–237, 2003 [DOI] [PubMed] [Google Scholar]
- 18.Catania JM, Chen G, Parrish AR: Role of matrix metalloproteinases in renal pathophysiologies. Am J Physiol 292: F905–F911, 2007 [DOI] [PubMed] [Google Scholar]
- 19.Yang J, Liu Y: Dissection of key events in tubular epithelial to myofibroblast transition and its implications in renal interstitial fibrosis. Am J Pathol 159: 1465–1475, 2001 [DOI] [PMC free article] [PubMed] [Google Scholar]
- 20.Tomasek JJ, Gabbiani G, Hinz B, Chaponnier C, Brown RA: Myofibroblasts and mechano-regulation of connective tissue remodelling. Nat Rev Mol Cell Biol 3: 349–363, 2002 [DOI] [PubMed] [Google Scholar]
- 21.Kalluri R, Neilson EG: Epithelial-mesenchymal transition and its implications for fibrosis. J Clin Invest 112: 1776–1784, 2003 [DOI] [PMC free article] [PubMed] [Google Scholar]
- 22.Roman RJ: Abnormal renal hemodynamics and pressure-natriuresis relationship in Dahl salt-sensitive rats. Am J Physiol 251: F57–F65, 1986 [DOI] [PubMed] [Google Scholar]
- 23.Roman RJ, Kaldunski ML: Enhanced chloride reabsorption in the loop of Henle in Dahl salt-sensitive rats. Hypertension 17: 1018–1024, 1991 [DOI] [PubMed] [Google Scholar]
- 24.Mori T, Cowley AW Jr: Renal oxidative stress in medullary thick ascending limbs produced by elevated NaCl and glucose. Hypertension 43: 341–346, 2004 [DOI] [PubMed] [Google Scholar]
- 25.Abe M, O'Connor P, Kaldunski M, Liang M, Roman RJ, Cowley AW Jr: Effect of sodium delivery on superoxide and nitric oxide in the medullary thick ascending limb. Am J Physiol 291: F350–F357, 2006 [DOI] [PubMed] [Google Scholar]
- 26.Roman RJ, Kaldunski M: Pressure natriuresis and cortical and papillary blood flow in inbred Dahl rats. Am J Physiol 261: R595–R602, 1991 [DOI] [PubMed] [Google Scholar]
- 27.Xie Y, Sakatsume M, Nishi S, Narita I, Arakawa M, Gejyo F: Expression, roles, receptors, and regulation of osteopontin in the kidney. Kidney Int 60: 1645–1657, 2001 [DOI] [PubMed] [Google Scholar]
- 28.Giachelli CM, Pichler R, Lombardi D, Denhardt DT, Alpers CE, Schwartz SM, Johnson RJ: Osteopontin expression in angiotensin II-induced tubulointerstitial nephritis. Kidney Int 45: 515–524, 1994 [DOI] [PubMed] [Google Scholar]
- 29.Fischer JW, Tschope C, Reinecke A, Giachelli CM, Unger T: Upregulation of osteopontin expression in renal cortex of streptozotocin-induced diabetic rats is mediated by bradykinin. Diabetes 47: 1512–1518, 1998 [DOI] [PubMed] [Google Scholar]
- 30.Yu XQ, Wu LL, Huang XR, Yang N, Gilbert RE, Cooper ME, Johnson RJ, Lai KN, Lan HY: Osteopontin expression in progressive renal injury in remnant kidney: Role of angiotensin II. Kidney Int 58: 1469–1480, 2000 [DOI] [PubMed] [Google Scholar]
- 31.Diamond JR, Kees-Folts D, Ricardo SD, Pruznak A, Eufemio M: Early and persistent up-regulated expression of renal cortical osteopontin in experimental hydronephrosis. Am J Pathol 146: 1455–1466, 1995 [PMC free article] [PubMed] [Google Scholar]
- 32.Yu XQ, Nikolic-Paterson DJ, Mu W, Giachelli CM, Atkins RC, Johnson RJ, Lan HY: A functional role for osteopontin in experimental crescentic glomerulonephritis in the rat. Proc Assoc Am Physicians 110: 50–64, 1998 [PubMed] [Google Scholar]
- 33.Meng S, Roberts LJ 2nd, Cason GW, Curry TS, Manning RD Jr: Superoxide dismutase and oxidative stress in Dahl salt-sensitive and -resistant rats. Am J Physiol 283: R732–R738, 2002 [DOI] [PubMed] [Google Scholar]
- 34.Taylor NE, Glocka P, Liang M, Cowley AW Jr: NADPH oxidase in the renal medulla causes oxidative stress and contributes to salt-sensitive hypertension in Dahl S rats. Hypertension 47: 692–698, 2006 [DOI] [PubMed] [Google Scholar]
- 35.Mori T, O'Connor PM, Abe M, Cowley AW Jr: Enhanced superoxide production in renal outer medulla of Dahl salt-sensitive rats reduces nitric oxide tubular-vascular cross-talk. Hypertension 49: 1336–1341, 2007 [DOI] [PubMed] [Google Scholar]
- 36.Zou AP, Li N, Cowley AW Jr: Production and actions of superoxide in the renal medulla. Hypertension 37: 547–553, 2001 [DOI] [PubMed] [Google Scholar]
- 37.Johnson RJ, Gordon KL, Giachelli C, Kurth T, Skelton MM, Cowley, AW Jr: Tubulointerstitial injury and loss of nitric oxide synthases parallel the development of hypertension in the Dahl-SS rat. J Hypertens 18: 1497–1505, 2000 [DOI] [PubMed] [Google Scholar]
- 38.Hayakawa H, Raij L: Nitric oxide synthase activity and renal injury in genetic hypertension. Hypertension 31: 266–270, 1998 [DOI] [PubMed] [Google Scholar]
- 39.Arendshorst WJ, Beierwaltes WH: Renal and nephron hemodynamics in spontaneously hypertensive rats. Am J Physiol 236: F246–F251, 1979 [DOI] [PubMed] [Google Scholar]
- 40.Ito S, Juncos LA, Carretero OA: Pressure-induced constriction of the afferent arteriole of spontaneously hypertensive rats. Hypertension 19[Suppl]: II164–II170, 1992 [DOI] [PubMed] [Google Scholar]
- 41.Takenaka T, Forster H, De Micheli A, Epstein M: Impaired myogenic responsiveness of renal microvessels in Dahl salt-sensitive rats. Circ Res 71: 471–480, 1992 [DOI] [PubMed] [Google Scholar]
- 42.Wright JT Jr, Bakris G, Greene T, Agodoa LY, Appel LJ, Charleston J, Cheek D, Douglas-Baltimore JG, Gassman J, Glassock R, Hebert L, Jamerson K, Lewis J, Phillips RA, Toto RD, Middleton JP, Rostand SG; African American Study of Kidney Disease and Hypertension Study Group: Effect of blood pressure lowering and antihypertensive drug class on progression of hypertensive kidney disease: Results from the AASK trial. JAMA 288: 2421–2431, 2002 [DOI] [PubMed] [Google Scholar]
- 43.ALLHAT Officers and Coordinators for the ALLHAT Collaborative Research Group: The Antihypertensive and Lipid-Lowering Treatment to Prevent Heart Attack Trial. Major outcomes in high-risk hypertensive patients randomized to angiotensin-converting enzyme inhibitor or calcium channel blocker vs diuretic: The Antihypertensive and Lipid-Lowering Treatment to Prevent Heart Attack Trial (ALLHAT). JAMA 288: 2981–2997, 2002 [DOI] [PubMed] [Google Scholar]
- 44.Rahman M, Pressel S, Davis BR, Nwachuku C, Wright JT Jr, Whelton PK, Barzilay J, Batuman V, Eckfeldt JH, Farber M, Henriquez M, Kopyt N, Louis GT, Saklayen M, Stanford C, Walworth C, Ward H, Wiegmann T: Renal outcomes in high-risk hypertensive patients treated with an angiotensin-converting enzyme inhibitor or a calcium channel blocker vs a diuretic: A report from the Antihypertensive and Lipid-Lowering Treatment to Prevent Heart Attack Trial (ALLHAT). Arch Intern Med 165: 936–946, 2005 [DOI] [PubMed] [Google Scholar]
- 45.Ogawa S, Takeuchi K, Mori T, Nako K, Tsubono Y, Ito S: Effects of monotherapy of temocapril or candesartan with dose increments or combination therapy with both drugs on the suppression of diabetic nephropathy. Hypertens Res 30: 325–334, 2007 [DOI] [PubMed] [Google Scholar]
- 46.Hessner MJ, Wang X, Hulse K, Meyer L, Wu Y, Nye S, Guo SW, Ghosh S: Three color cDNA microarrays: Quantitative assessment through the use of fluorescein-labeled probes. Nucleic Acids Res 31: e14, 2003 [DOI] [PMC free article] [PubMed] [Google Scholar]
- 47.Hessner MJ, Wang X, Khan S, Meyer L, Schlicht M, Tackes J, Datta MW, Jacob HJ, Ghosh S: Use of a three-color cDNA microarray platform to measure and control support-bound probe for improved data quality and reproducibility. Nucleic Acids Res 31: e60, 2003 [DOI] [PMC free article] [PubMed] [Google Scholar]
- 48.Morrison J, Knoll K, Hessner MJ, Liang M: Effect of high glucose on gene expression in mesangial cells: Upregulation of the thiol pathway is an adaptational response. Physiol Genomics 17: 271–282, 2004 [DOI] [PubMed] [Google Scholar]
- 49.Knoll KE, Pietrusz JL, Liang M: Tissue-specific transcriptome responses in rats with early streptozotocin-induced diabetes. Physiol Genomics 21: 222–229, 2005 [DOI] [PubMed] [Google Scholar]
- 50.Liang M, Briggs AG, Rute E, Greene AS, Cowley AW Jr: Quantitative assessment of the importance of dye switching and biological replication in cDNA microarray studies. Physiol Genomics 14: 199–207, 2003 [DOI] [PubMed] [Google Scholar]
- 51.Mattson DL, Kunert MP, Kaldunski ML, Greene AS, Roman RJ, Jacob HJ, Cowley AW Jr: Influence of diet and genetics on hypertension and renal disease in Dahl salt-sensitive rats. Physiol Genomics 16: 194–203, 2004 [DOI] [PubMed] [Google Scholar]