Abstract
An apparent conflict exists between observational studies that suggest that vitamin D receptor (VDR) activators provide a survival advantage for patients with ESRD and other studies that suggest that they cause vascular calcification. In an effort to explain this discrepancy, we studied the effects of the VDR activators calcitriol and paricalcitol on aortic calcification in a mouse model of chronic kidney disease (CKD)-stimulated atherosclerotic cardiovascular mineralization. At dosages sufficient to correct secondary hyperparathyroidism, calcitriol and paricalcitol were protective against aortic calcification, but higher dosages stimulated aortic calcification. At protective dosages, the VDR activators reduced osteoblastic gene expression in the aorta, which is normally increased in CKD, perhaps explaining this inhibition of aortic calcification. Interpreting the results obtained using this model, however, is complicated by the adynamic bone disorder; both calcitriol and paricalcitol stimulated osteoblast surfaces and rates of bone formation. Therefore, the skeletal actions of the VDR activators may have contributed to their protection against aortic calcification. We conclude that low, clinically relevant dosages of calcitriol and paricalcitol may protect against CKD-stimulated vascular calcification.
Observational studies have shown that administration of vitamin D receptor (VDR) activators in end-stage kidney disease (ESKD) increases survival compared with untreated dialysis patients.1,2 Furthermore, there is an additional survival advantage between therapy with the native VDR activator, calcitriol, and paricalcitol favoring the latter.3 These studies are difficult to understand because they are matched by other studies demonstrating that hyperphosphatemia and vascular calcification (VC) are mortality risk factors in ESKD and chronic kidney disease (CKD).4–7 Both hyperphosphatemia8,9 and VC10–15 are stimulated by VDR activators; therefore, the mechanism of the survival advantage provided by VDR activators is unknown, and the situation is unclear.
VDR activators are agents approved for the indication of secondary hyperparathyroidism in CKD. One of the most important difficulties in the clinical management of CKD and ESKD is determining how much suppression of parathyroid hormone (PTH) is ideal. There is a balance between VDR activator–induced PTH suppression and stimulation of intestinal calcium (Ca) and phosphate absorption that may limit administration of the drugs as a result of elevated serum phosphorus (Pi) or Ca levels. Elevations in serum Pi or Ca produced by VDR activators may participate in their reputed role of stimulating VC.13,14 In addition, suppression of PTH levels to normal ranges in CKD/ESKD will result in adynamic bone disorder (ABD),16,17 and the actions of vitamin D analogs in ABD are not understood. In fact, the finding of ABD when PTH levels are suppressed during treatment with calcitriol and its analogs has led to incrimination of the VDR activators as causative agents in the pathogenesis of ABD.16,18 ABD is especially associated with VC in ESKD,19 and avoiding this form of renal osteodystrophy may be very important.20,21
We have discovered that ABD was directly stimulated by CKD in mice when serum Pi, Ca, and PTH levels were maintained normal.22 In this model, Pi intake was reduced in proportion to the reduction in GFR, and calcitriol (20 ng/kg three times a week intraperitoneally) was supplemented to avoid osteomalacia as a result of phosphate restriction. Induction of ABD by CKD has been confirmed by other investigators using thyroparathyroidectomized five-sixths nephrectomized rats replaced with thyroid hormone and PTH.23 Human studies of CKD are consistent with a direct effect of renal injury on bone formation.24,25 Thus, CKD directly inhibits bone formation, and secondary hyperparathyroidism is a means of restoring bone formation rates; however, this adaptation is disease causing because of lack of feedback control and greater stimulation of bone resorption compared with the increase in bone formation deriving from increased PTH levels.26,27 Whenever PTH levels are suppressed below values approximately recommended by the Kidney Disease Outcomes Quality Initiative (KDOQI) guidelines,28 in CKD and ESKD, ABD will resurface.17
To investigate the issue of VDR activators on the relationship between the skeleton and VC, we turned to our animal model of VC and ABD in mice with CKD.29,30 The model uses renal ablation in the atherosclerotic LDL receptor–deficient (LDLR−/−) mouse fed high-fat Western diets (40% of calories from fat) to produce CKD. CKD markedly stimulated VC in these animals, and it produced hyperphosphatemia as a result of lack of renal excretion and ABD.30 We have shown that treatment of hyperphosphatemia diminishes VC in this model.31
The LDLR−/− high fat–fed mouse with CKD has ABD as a result of additive inhibition of skeletal anabolism from high-fat feeding, type 2 diabetes, and CKD. This is exactly what is observed in clinical medicine in patients with type 2 diabetes and CKD/ESKD.32,33 These patients have marked increases in the tendency for VC to develop associated with CKD just as our LDLR−/− mice with CKD do.34,35 We have linked CKD stimulation of VC in this model to the development of ABD.30 Thus, our animal model is a model of the ABD complicating CKD, and it is an excellent opportunity to test the effects of VDR activators on the skeleton and the vasculature.
Here we report studies of therapy with either calcitriol or paricalcitol performed as a direct comparison of their actions on development of VC and the ABD in the LDLR−/− high fat–fed CKD model described. We found that both calcitriol (10 and 20 ng/kg) and paricalcitol (50 and 100 ng/kg) administered three times a week intraperitoneally were protective against VC. The dosages of VDR activators were sufficient to produce the effects for which they are clinically approved, PTH suppression in CKD. The mechanism of VDR activation in inhibiting aortic calcification seemed to be inhibition of osteoblastic gene expression in the aorta. Secondarily, we found that paricalcitol and calcitriol stimulated osteoblast function and improved bone turnover in ABD. These skeletal actions may have also contributed to the protective actions of the VDR activators on VC by increasing deposition of Ca and Pi in orthotropic sites.
RESULTS
Comparative Studies of Calcitriol and Paricalcitol in the LDLR−/− High Fat–Fed CKD Model: VC
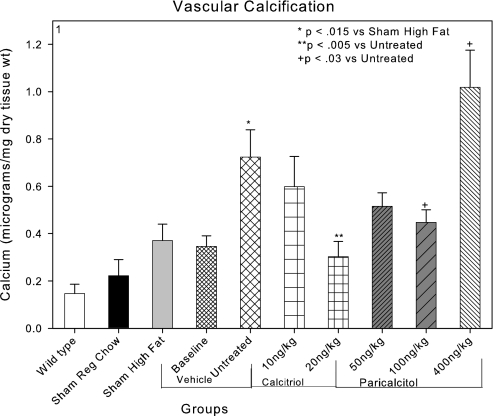
These studies were designed as a comparative treatment trial in a translational animal model of CKD-stimulated VC. The animal model is the LDLR−/− mouse that was shown to develop calcification of cardiac valves and atherosclerotic plaques when fed a high-fat diet (sham high fat; Figure 1) in agreement with previous studies.29,36 Furthermore, we previously demonstrated stimulation of atherosclerotic plaque–associated calcification by CKD in this model.29 In this study, CKD was induced by renal ablation at 12 wk of age, and at 22 wk of age (baseline), treatment was begun with the VDR activators. The experimental groups were analyzed at 28 wk of age. Aortic Ca content was measured as described in the Concise Methods section. In CKD high fat–fed mice receiving the vehicle for paricalcitol (untreated), there was a significant increase in aortic Ca accumulation induced by CKD (Figure 1). Previous studies29,30,37 characterized the increase in aortic Ca produced by induction of CKD in this model as an intensification of atherosclerotic plaque neointimal calcification. Those results were confirmed in these studies. In addition, there was no evidence of Mönckeberg's medial arterial sclerosis stimulated by CKD or the VDR activators in this study.
Figure 1.
Effects of CKD and VDR activators on aortic Ca levels. High-fat feeding of LDLR−/− mice (sham high fat) increased aortic calcification. CKD induced at 12 wk of age stimulated aortic calcification in the group killed at 28 wk of age (untreated). Compared with the untreated group, both calcitriol 20 ng/kg intraperitoneally three times per week and paricalcitol 100 ng/kg intraperitoneally three times per week administered from 22 to 28 wk of age decreased aortic Ca accumulation. The levels of aortic Ca were not different from the baseline CKD group studied at 22 wk, indicating reduction in aortic Ca accumulation. Paricalcitol, 400 ng/kg intraperitoneally three times per week increased aortic Ca accumulation compared with the untreated group.
The effects of treatment with either calcitriol or paricalcitol on aortic Ca content in 28-wk-old mice are shown in Figure 1. There was a trend for each of the clinically relevant dosages of calcitriol and paricalcitol to reduce neointimal vascular Ca content. The trends exhibited dosage dependence, and the animals that were treated with 20 ng/kg calcitriol and the animals that were treated with 100 ng/kg paricalcitol had significantly less vascular Ca than the uremic high fat–fed vehicle-treated animals (Figure 1). A clinically relevant dosage of the VDR activators was defined as dosages close to the threshold dosage for the VDR activator indication, suppression of PTH levels in CKD (Table 1).
Table 1.
Biochemical parameters in the various groups of animals
| Parameter | Group 1 | Group 2 | Group 3 | Group 4 | Group 5 | Group 6 | Group 7 | Group 8 | Group 9 | Group 10 |
|---|---|---|---|---|---|---|---|---|---|---|
| Mouse strain | C57BL6(wild-type) | LDLR−/− | LDLR−/− | LDLR−/− | LDLR−/− | LDLR−/− | LDLR−/− | LDLR−/− | LDLR−/− | LDLR−/− |
| Diet | Regular chow | Regular chow | High fat | Fat | Fat | Fat | Fat | Fat | Fat | Fat |
| Surgery | Sham | Sham | Sham | CKD | CKD | CKD | CKD | CKD | CKD | CKD |
| Weeks postnatal | 28 | 28 | 28 | 22 | 28 | 28 | 28 | 28 | 28 | 28 |
| Treatment | Vehicle | Vehicle | Vehicle | Vehicle | Vehicle | Calcitriol 10 ng/kg | Calcitriol 20 ng/kg | Paricalcitol 50 ng/kg | Paricalcitol 100 ng/kg | Paricalcitol 400 ng/kg |
| n | 7 | 7 | 7 | 6 | 7 | 6 | 6 | 10 | 8 | 9 |
| Presurgical weight | 18.983 ± 1.010 | 19.314 ± 0.640 | 19.400 ± 0.620 | 21.740 ± 0.750 | 21.500 ± 1.890 | 22.120 ± 2.180 | 21.400 ± 0.835 | 21.020 ± 0.676 | 21.988 ± 1.089 | 22.378 ± 0.691 |
| Weight at killing | 21.583 ± 0.759 | 20.580 ± 0.500 | 25.044 ± 1.640 | 21.640 ± 0.950 | 21.067 ± 1.800 | 22.600 ± 1.860 | 24.383 ± 1.807 | 22.580 ± 1.039 | 22.938 ± 1.327 | 24.933 ± 1.205 |
| BUN (mg/dl) | 20.960 ± 2.896 | 27.660 ± 4.640 | 18.700 ± 1.660 | 61.200 ± 14.460a | 37.420 ± 3.740a | 54.000 ± 10.000a | 46.400 ± 3.280a | 38.140 ± 4.890a | 49.660 ± 2.690a | 38.710 ± 5.720a |
| Glucose (mg/dl)b | 148.410 ± 12.780 | 233.500 ± 20.790 | 155.900 ± 24.480 | 124.800 ± 16.850 | 165.430 ± 14.700 | 207.870 ± 41.260 | 181.400 ± 25.880 | 184.430 ± 26.240 | 174.500 ± 32.910 | 288.140 ± 52.790 |
| Cholesterol (mg/dl) | 52.360 ± 4.600 | 199.00 ± 6.800 | 658.900 ± 78.000c | 556.000 ± 70.000c | 702.500 ± 72.00c | 466.620 ± 50.600c | 790.800 ± 167.550c | 814.000 ± 90.720c | 593.500 ± 81.590c | 1213.2008 ± 143.550c |
| PTH (pg/ml) | 19.100 ± 5.300 | 25.630 ± 6.300 | 23.510 ± 13.360 | 743.520 ± 186.000d | 444.050 ± 98.000d | 74.600 ± 8.300e | 44.320 ± 9.600e | 83.710 ± 18.800e | 60.340 ± 19.200e | 16.200 ± 2.700e |
All of the CKD groups had significantly higher BUN at killing compared with wild-type or high-fat sham (P < 0.02).
There was no statistical difference among the glucose values.
All the high fat–fed groups had significantly higher cholesterol compared with wild-type (P < 0.001).
The PTH values were higher for the CKD groups compared with wild-type (P < 0.001).
There was a dosage-dependent decrease in PTH compared with the CKD 28-wk vehicle group (untreated; P < 0.001).
Previous reports demonstrated stimulation of VC by vitamin D analogs.10,12,15 The actions of the VDR activators on aortic calcification reported here are not in disagreement with these reports, because when we used a dosage of paricalcitol (paricalcitol 400 ng/kg) equivalent to the VDR activator dosages used in the previous reports; we also observed stimulation of aortic Ca content (Figure 1). The stimulation of vascular Ca content in the group that was treated with 400 ng/kg paricalcitol was due to increased deposition of vascular Ca in the atherosclerotic plaque.
Aortic Gene Expression
To investigate the mechanism of vascular protection provided by VDR activators, we first analyzed their actions on aortic gene expression. We recently demonstrated that the stimulation of VC by CKD in this model is due to a stimulation of aortic mineralization guided by a bone morphogenic protein-2/4–stimulated osteoblastic transcription program.37 As shown in Figure 2A, CKD (untreated group) dramatically stimulated aortic osterix expression. Osterix has been identified as the phosphate-stimulated osteoblastic transcription factor in studies of human vascular smooth muscle cells in vitro and as stimulated by CKD and inhibited by phosphate binders in vivo.31,37 Aortic expression of Msx2 (Figure 2B), identified by Cheng et al. 36,38 to be stimulated in LDLR−/− mice equivalent of our sham high-fat group, was increased in the untreated group over the levels in the sham high-fat group, although the expression levels of Msx2 remained much lower than those for osterix and CBFA1. The VDR activators markedly suppressed osterix and Msx2 expression. CBFA1, or Runx2, was also induced by CKD in the untreated group (Figure 2C), and there was a trend for CBFA1 levels to be reduced in the 20-ng/kg calcitriol and the 400-mg/kg paricalcitol groups that was NS. Only the reduction in CBFA1 expression seen in the 50- and the 100-ng/kg paricalcitol groups was significantly less than the untreated group.
Figure 2.
Effects of VDR activators on CKD-induce gene expression in aortas of LDLR−/− high fat–fed mice: (A) osterix. (B) Msx2. (C) CBFA1/RUNX2. (D) osteocalcin. Calcitriol 20 ng/kg and paricalcitol 50 and 100 ng/kg all decreased CKD-induced gene expression. Paricalcitol 400 ng/kg had no effect on CKD-stimulated RUNX2 expression, although it inhibited osteocalcin probably by inhibition of osterix and Msx2 expression. Note that the scale of the y axis was adjusted for the high levels of osteocalcin.
Osteocalcin is the phenotypic marker protein of the osteoblast, and the osteocalcin gene promoter is activated by the osteoblast-specific transcription factors, especially CBFA1.39–42 Osteocalcin levels were induced by CKD in the untreated group (Figure 2D). We previously showed by immunohistochemistry the increased osteocalcin protein in mice of the untreated group, and these studies were not repeated here.29 These results confirm previous studies demonstrating CKD-stimulated heterotopic expression of the osteoblastic phenotype in cells of the aorta in this model.29,37 They are in agreement with numerous studies reporting expression of osteoblastic proteins in the vasculature associated with CKD-stimulated VC.29,43–49 Although each of the dosages of the VDR activators decreased aortic osteocalcin expression, the pattern of effects on expression mirrored the pattern of expression of CBFA1. The highest dosage of paricalcitol, 400 ng/kg, demonstrated suppression of osterix and Msx2 expression and a loss of effect on CBFA1 expression, perhaps consistent with the stimulation, not inhibition, of aortic Ca accumulation at this dosage as shown in Figure 1.
Bone Histomorphometry
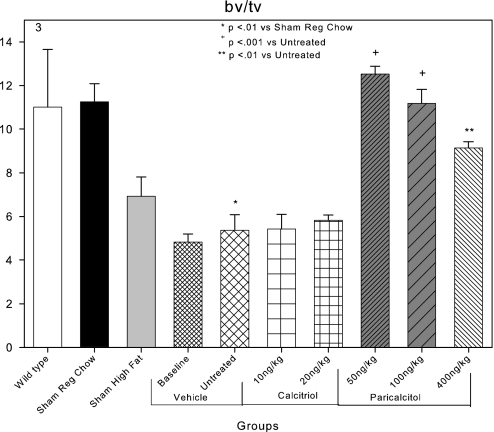
Because of our previous demonstrations of the role of the skeleton in the VC stimulated by CKD in this model,30,31 we investigated the effects of the VDR activators on bone histomorphometry. Distal femoral metaphyseal trabecular bone volume was 10.8% in C57Bl6 wild-type mice (Figure 3). Metaphyseal trabecular bone volume was not significantly different in LDLR−/− mice fed chow diets (Figure 3). High-fat feeding and the induction of CKD in high fat–fed LDLR−/− mice (untreated group) significantly reduced bone volume compared with sham mice that were fed regular chow (Figure 3). While treatment with calcitriol had no effect on the osteopenia of the ABD, paricalcitol both 50 and 100 ng/kg restored bone volume in CKD high fat–fed LDLR−/− mice to the levels of wild-type mice (Figure 3). The metaphyseal trabecular bone volume of the 400-ng/kg paricalcitol group was significantly increased from that of the untreated group but significantly less so than the 50-ng/kg paricalcitol group.
Figure 3.
Effects of VDR activators on metaphyseal trabecular bone volume (bv/tv) in LDLR−/− high fat–fed mice with CKD and ABD. Bone volume was decreased in the baseline and untreated CKD groups compared with the sham high-fat group. Paricalcitol 50 and 100 ng/kg increased bone volume.
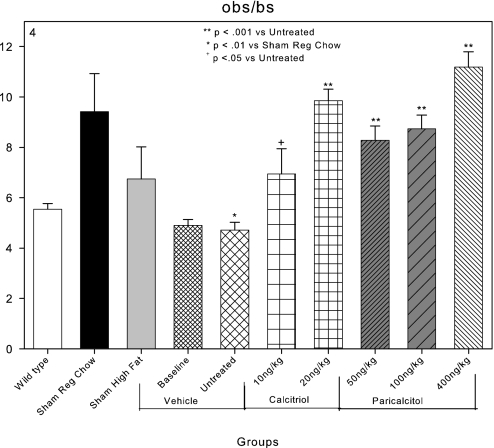
Osteoblast surfaces, as a percentage of bone surface (obs/bs), were 5.5% in C57Bl6 wild-type mice and increased to 9.5% in LDLR−/− sham-operated mice fed regular chow (Figure 4) as we have previously demonstrated.30 High-fat feeding and induction of CKD significantly reduced osteoblast surface to 4.9 and 4.7% in the CKD baseline and untreated groups, respectively (Figure 4). These findings are compatible with the induction of ABD by CKD in this animal model as previously reported.30 Osteoblast surfaces were increased by each of the dosages of calcitriol and paricalcitol (Figure 4).
Figure 4.
Effects of VDR activators on bone surfaces covered by osteoblasts (obs/bs) in LDLR−/− high fat–fed mice with CKD and ABD. Osteoblast surfaces were decreased in the sham high-fat group and the baseline and untreated CKD groups compared with LDLR−/− chow-fed (sham chow group) animals. Both of the VDR activators increased osteoblast surfaces.
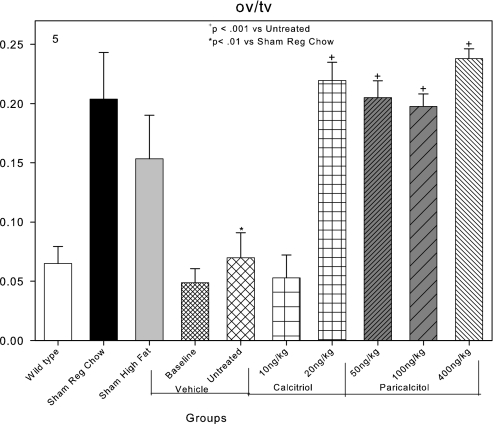
Osteoid volume was 0.07% in the metaphyseal trabecular bone in the untreated group, reflective of the low osteoid volume in the ABD of CKD (Figure 5). Osteoid volume was increased by both dosages of paricalcitol and the highest calcitriol dosage (20 ng/kg), compatible with increased bone turnover (Figure 5). Why the lowest dosage of calcitriol did not increase osteoid volume is unclear because it did increase osteoblast surfaces and bone formation rate.
Figure 5.
Effects of VDR activators on osteoid volume (ov/tv) in LDLR−/− high fat–fed mice with CKD and ABD. Osteoid volume was decreased in the baseline and untreated CKD groups compared with sham-operated animals. Calcitriol at 20 ng/kg and all dosages of paricalcitol increased osteoid surfaces back to normal levels.
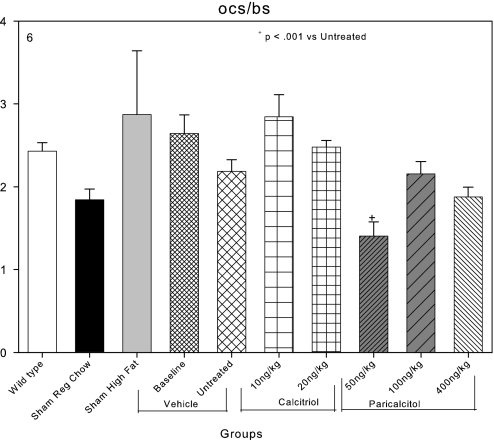
Osteoclast surface as a percentage of bone surface was 2.4% in C57Bl6 wild-type mice and 1.8% in LDLR−/− sham-operated mice fed regular chow (Figure 6). High-fat feeding did not affect osteoclast surface, and induction of CKD did not affect osteoclast surface in contrast to its effects on osteoblast surfaces. The failure of coordinate downregulation of osteoblasts and osteoclasts is a widely recognized component of ABD in CKD.50 Calcitriol tended to increase osteoclast surfaces further (Figure 6), whereas paricalcitol tended to decrease them, and 50 ng/kg paricalcitol significantly reduced osteoclast surface from 2.6% in the baseline group to 1.4% (Figure 6).
Figure 6.
Effects of VDR activators on bone surfaces covered by osteoclasts (ocs/bs) in LDLR−/− high fat–fed mice with CKD and ABD. Osteoclast surfaces were not affected by the induction of CKD (untreated group) compared with the sham high-fat group. Osteoclast surfaces were significantly reduced in the 50-ng/kg paricalcitol group.
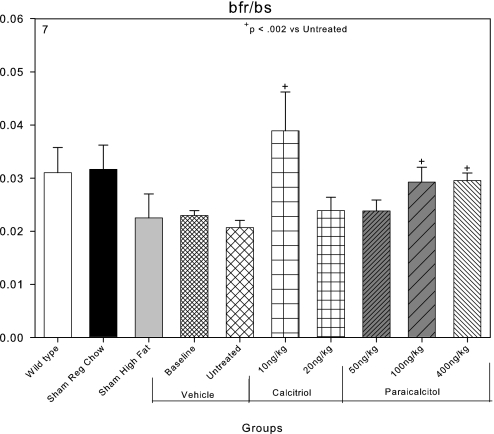
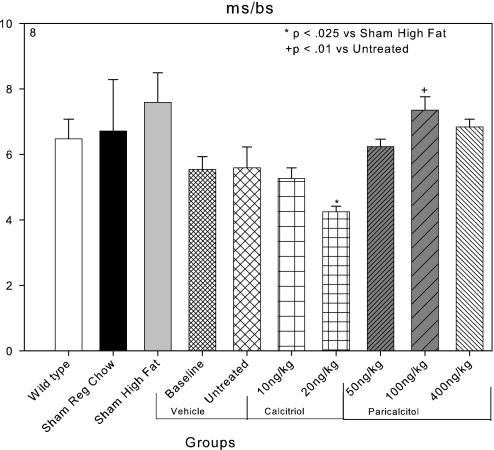
Bone formation rates in mm3/m2 per yr were 0.03 in C57Bl6 wild-type mice, and they were not significantly different in LDLR−/− mice that were sham operated and fed regular chow. Both high-fat feeding and CKD reduced bone formation rates (Figure 7). Both calcitriol and paricalcitol tended to increase bone formation rates, but these effects were less consistent than the increase in osteoblast surfaces. Mineralizing surfaces were 7.6 ± 0.9% in sham-operated high fat–fed mice, and these were decreased by the induction of CKD. Mineralizing surfaces tended to recover in the paricalcitol-treated animals (Figure 8).
Figure 7.
Effects of VDR activators on bone formation rates (bfr/bs) in mm3/m2 per yr in LDLR−/− high fat–fed mice with CKD and ABD. Bone formation rates were decreased in the sham-operated, high fat–fed group and the baseline and untreated CKD groups compared with sham-operated chow-fed animals. Calcitriol at 10 ng/kg and paricalcitol at 100 ng/kg increased bone formation rates.
Figure 8.
Effects of VDR activators on mineralizing surfaces (ms/bs). Mineralizing surfaces tended to be decreased in the vehicle and calcitriol CKD animals compared with sham high fat–fed animals. The decrease was significant in the 20-ng/kg calcitriol group. Mineralizing surfaces were significantly increased in the 100-ng/kg paricalcitol group compared with the untreated group.
Serum Chemistries
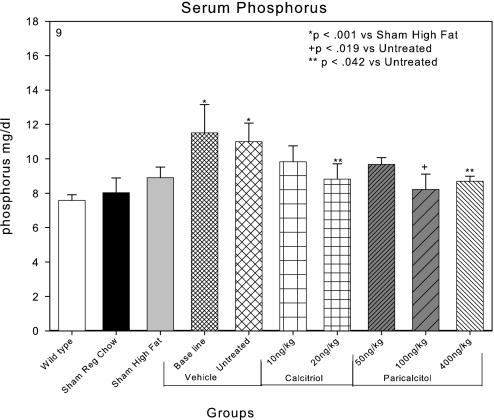
The serum Pi of C57Bl6 chow-fed mice was 7.7 mg/dl and of LDLR−/− mice fed regular chow was 8.0 mg/dl (Figure 9). High-fat feeding in sham-operated LDLR−/− mice tended to increase the serum Pi, as we have previously reported. The induction of CKD by renal ablation in the high fat–fed LDLR−/− mice produced significant hyperphosphatemia with serum Pi levels of 11.5 and 11.0 mg/dl in the baseline and untreated groups, respectively. The CKD-induced hyperphosphatemia tended to be ameliorated in each of the paricalcitol- and calcitriol-treated groups (Figure 9), and 20 ng/kg calcitriol, 100 ng/kg paricalcitol, and 400 ng/kg paricalcitol significantly reduced serum Pi levels.
Figure 9.
Effects of VDR activators on the serum Pi in LDLR−/− high fat–fed mice with CKD. CKD produced hyperphosphatemia in the baseline (22 wk) and untreated groups (28 wk). The hyperphosphatemia tended to be ameliorated by treatment with the VDR activators, and calcitriol 20 ng/kg and paricalcitol 100 ng/kg significantly reduced serum Pi levels.
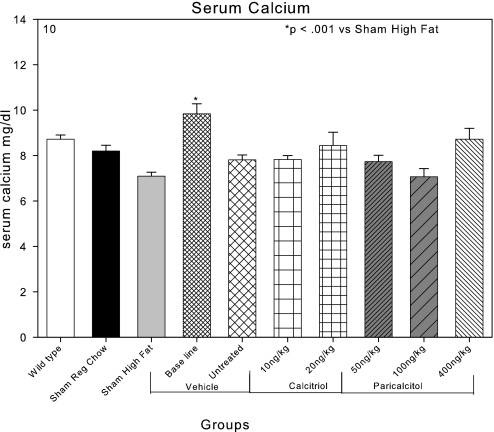
The serum Ca was 8.5 mg/dl in the C57Bl6 wild-type mice and 8.1 mg/dl in the LDLR−/− chow-fed mice (Figure 10). High-fat feeding tended to decrease the serum Ca to the level of 7.1 mg/dl. Induction of CKD transiently increased serum Ca levels to 10 mg/dl in the baseline CKD group studied at 22 wk. This group also had the highest PTH levels among the groups with CKD. The increase in the serum Ca was not present in the CKD group (untreated group) studied at 28 wk, and serum Ca levels were not significantly affected by either calcitriol or paricalcitol compared with the untreated group (Figure 10).
Figure 10.
Effects of VDR activators on the serum Ca in LDLR−/− high fat–fed mice with CKD. A transient increase in the serum Ca was observed in the baseline CKD group that was not present in the untreated group at 28 wk. Serum Ca levels were not different among the various treatment groups.
In Table 1, the blood urea nitrogen (BUN) levels in the various animal groups are shown. BUN was 18 mg/dl in the sham-operated, high fat–fed animals and elevated in the CKD groups (range 37 to 61 mg/dl). The BUN levels were not significantly different between the CKD groups. The renal function impairment of the CKD animals in this study was equivalent to human stage 3 CKD.
PTH levels were increased by induction of CKD as expected on the high-fat diet (0.6% Pi; 743 and 443 pg/ml in the baseline and untreated groups, respectively; Table 1). The VDR activators dosage-dependently and significantly suppressed PTH levels at each of the dosages selected for study in this project.
High-fat feeding induced marked hypercholesterolemia in the LDLR−/− mice (sham high fat) as previously reported.30,36 Neither CKD nor any of the treatments except the high-dosage paricalcitol (400 ng/kg) had significant effects on the hypercholesterolemia. The CKD high fat–fed mice in this study at 28 wk were more insulin resistant than the baseline CKD group at 22 wk, manifested as the increase in blood glucose from 124 to 165 mg/dl. We previously noted that this model advances from insulin resistance to type 2 diabetes after 22 wk.31 There was no effect of the VDR activators on blood glucose levels. The sham-operated, high fat–fed mice gained more weight than the other groups, and CKD decreased the weight gain induced by the high-fat diet. Neither of the dosages of paricalcitol or calcitriol had an effect on weight gain.
DISCUSSION
In the studies reported here, paricalcitol and calcitriol, at dosages just sufficient to decrease PTH levels and thus defined as equivalent to those that are clinically used, tended to decrease, not increase, accumulation of vascular Ca levels from 22 to 28 wk in LDLR−/− high fat–fed mice with CKD compared with vehicle-treated control animals. The reduction in vascular Ca accumulation was significant in mice receiving the 20-ng/kg calcitriol and the 100-ng/kg paricalcitol dosages, and was associated with reduced expression of osteoblast-specific transcription factors and one of their target proteins, osteocalcin, in the aortas of treated animals. These results are consistent with previous studies of aortic calcification in this model as being due to an osteoblastic transcription program expressed in cells of the atherosclerotic neointima,36,51,52 which is stimulated by CKD.29–31,37 The results are also consistent with the demonstration of CKD stimulation of neointimal aortic calcification in the apolipoprotein E−/− mice.53 Previous studies31,37 demonstrated that the VC in the LDLR−/− high fat–fed CKD model is reversible, as would be expected with mineralization analogous to bone formation as a result of remodeling, and osteoclasts have been found in calcified atherosclerotic vessels.54–57 Thus, the protective actions of the VDR activators reported here, although impressive and surprising, were less potent than factors that completely normalized the hyperphosphatemia produced by CKD and actually decreased aortic Ca levels at 28 wk compared with 22-wk baseline animals.31
Previous studies30,31 associating improvement in ABD associated with CKD and amelioration of VC called our attention to potential skeletal actions of the VDR activators on ABD. Paricalcitol increased bone volume, osteoblast surfaces, and osteoid volume and decreased osteoclast surfaces. Calcitriol increased osteoblast surfaces and less consistently increased osteoid volume and bone formation rates. Calcitriol did not affect osteoclast surfaces compared with the baseline and untreated CKD groups. In summary, it is possible that the reductions in vascular Ca observed by treatment with vitamin D analogs of LDLR−/− high fat–fed mice with CKD may have been contributed to secondarily by positive changes in ABD produced by CKD in these animals. Inconsistencies in the bone histomorphometry data described in the results prevented us from drawing stronger conclusions regarding the role of the skeleton in the amelioration of VC stimulated by the VDR activators. The alleviation of osteoclast-mediated bone resorption by paricalcitol may have produced an increase in bone volume, and this could well contribute to a reduction in the osteopenia produced by ABD in CKD.
The effects of the VDR activators on the skeleton in these studies may have contributed to their effects on the serum Pi. In addition, stimulation of fibroblast growth factor 23 production by the VDR activators could have stimulated urinary excretion of Pi, which was not studied in the experiments reported here.
Several previous studies demonstrated that vitamin D analogs stimulate VC.10–12,15 Our results are not in disagreement with these studies, because when we used higher dosages of paricalcitol, we also demonstrated stimulation of aortic calcification, in agreement with the previously published studies. We do not have data on the effects of the VDR activators on vascular smooth muscle cell PTH related protein (PTHrp) expression in contrast to Jono et al.11 What our results indicate is that a biphasic dosage-response curve exists in the effects of VDR activators on aortic mineralization. Whereas lower dosages are inhibitory, higher dosages are stimulatory. This biphasic response to VDR activators was observed in the osteoblast transcription factor gene CBFA1/RUNX2 expression in the aortas of the high fat–fed mice with CKD. Whereas 50 and 100 ng/kg paricalcitol inhibited RUNX2 expression, 400 ng/kg restored RUNX2 expression to the elevated levels found in the untreated high fat–fed CKD mice. These data may relate to the human clinical situation, and they suggest that lower dosages of VDR activators are preferable over very high dosages. In fact, the observational studies1–3 demonstrate no dosage dependence in the survival benefit afforded by VDR activators, favoring use of lower dosages.
The studies reported here are the first to analyze therapy of ABD with VDR activators. In agreement with studies of VDR-deficient and 1α-hydroxylase–deficient mice,58–60 the VDR activators stimulated osteoblast function instead of suppressing it and increased osteoblast surfaces and bone formation rates. These results are in disagreement with conclusions drawn from the appearance of the ABD when PTH levels were suppressed with VDR activators.17 An alternative conclusion, that suppression of hyperparathyroidism uncovers the effect of CKD on skeletal anabolism, would be in agreement with our studies demonstrating this phenomenon.22
The VDR activators are cell differentiation factors, and the vascular smooth muscle from which some cells in the neointima are derived have VDR.61 The inhibition of osteoblastic factors in the aorta by VDR activators reported here suggests the need for further study of vascular smooth muscle phenotype influenced by VDR activators in CKD and characterization of the dosing of VDR activators in VC. These actions could contribute to their actions to ameliorate hypertension, and they are compatible with the observational studies suggesting decreased cardiovascular mortality associated with VDR activator therapy in patients with ESKD.1–3 They are also compatible with the inverse relationship between calcitriol levels and coronary artery Ca levels determined by electron-beam computed tomography.62
CONCISE METHODS
Animals and Diets
LDLR−/− mice of both genders in a C57Bl6 background were purchased from Jackson Laboratory (Bar Harbor, ME) and were bred in a pathogen-free environment. Animals were weaned at 3 wk to a chow diet (1:1 mixture of Pico Lab rodent chow 20 and mouse chow 20, 6.75% calories as fat). At 10 wk, animals were continued on this chow diet or initiated on a high-cholesterol (0.15%) diet containing 42% calories as fat (product no. TD.88137; Harlan Teklad, Madison WI), 0.6% Pi, 0.6% Ca, and vitamin D content 2.2 IU/g, a diet that has been shown to generate atherosclerosis with VC in this genetic background. At 12 wk, CKD was induced as described in the next section. Animals had access to water ad libitum and were maintained according to local and national animal care guidelines. Paricalcitol and calcitriol were provided to us by Abbott (Abbott Park, IL). The paricalcitol and calcitriol were provided as powder. The powder was dissolved in 100% ethanol (ETOH) and subsequently diluted in 5% ETOH to appropriate concentrations. Xylazine, ketamine, and tetracycline were obtained from Sigma-Aldrich Co. (St. Louis, MO). The Washington University Animal Care Committee approved the study protocol.
Induction of CKD and Treatment Protocol
A two-step procedure was used to create CKD as described previously.29,30 Briefly, electrocautery was applied to the right kidney through a 2-cm flank incision at 10 wk postnatal, followed by left total nephrectomy through a similar incision 2 wk later. Control animals received sham operations in which the appropriate kidney was exposed and mobilized but not treated in any other way. Stable CKD was established after the two surgical procedures. After the surgical procedures, the 14-wk-old mice were randomized into 10 groups. The first was wild-type mice fed a regular diet. This was the normal renal function and diet group. The second group was LDLR−/− mice fed regular chow. This group served as the genotype and the control for the diet. The third group was sham-operated LDLR−/− mice that were fed a high-fat diet. This group had normal renal function. This group served as the control group to determine the effect of high-fat diet in the face of normal renal function. The fourth and fifth groups were LDLR−/− mice that had CKD and were fed high-fat diet and killed at 22 wk, the baseline group, or treated with vehicle (5% ETOH) and killed at 28 wk, the fifth or untreated group. These groups were expected to develop hyperphosphatemia, ABD, and VC. The sixth and seventh groups were LDLR−/− mice that had CKD and were fed high-fat diet and treated with calcitriol 10 or 20 ng/kg three times per week by intraperitoneal injections, respectively. These were the first and second therapy groups. The eighth and ninth groups were LDLR−/− mice that had CKD and were fed high-fat diet and treated with paricalcitol 50 or 100 ng/kg three times per week, respectively. The tenth group was LDLR−/− mice that had CKD and were fed high-fat diet and treated with paricalcitol 400 ng/kg three times per week. This was the high-dosage group expected to produce signs of toxicity. Once the mice were randomized into groups, they were allowed to develop calcification from weeks 14 through 22 postnatal. Therapy was initiated at 23 wk postnatal and continued until week 28 postnatal, at which time the mice were killed under anesthesia. Intraperitoneal anesthesia (xylazine 13 mg/kg and ketamine 87 mg/kg) was used for all procedures. Saphenous vein blood samples were taken 1 wk after the second surgery to assess baseline postsurgical renal function. At the time of killing, blood was taken by intracardiac stab, and the heart and aorta were dissected en block.
Chemical Calcification Quantification
Aorta and hearts were dissected when the mice were killed, and all extraneous tissue was removed by blunt dissection under a dissecting microscope. Tissues were desiccated for 20 to 24 h at 60°C, weighed, and crushed to a powder with a pestle and mortar. Ca was eluted in 1 N HCL for 24 h at 4°C. Ca content of eluate was assayed using a cresolphthalein complexone method (Sigma), according to the manufacturer's instructions, and results were corrected for dry tissue weight.
Blood Tests
Serum was analyzed on the day of blood draw for BUN, cholesterol, Ca, glucose, and phosphate by standard autoanalyzer laboratory methods performed by our animal facility.
Bone Histology and Histomorphometry
Bone formation was determined at the time of killing. All mice received intraperitoneal tetracycline (5 mg/kg) 7 and 2 d before being killed. Both femurs were dissected at the time of killing and placed in 70% ETOH. The specimens were implanted undecalcified in a plastic embedding kit H7000 (Energy Beam Sciences, Agawam, MA). Bones were sectioned longitudinally through frontal plane in 5-μm sections with a JB-4 Microtome (Energy Beam Sciences). Tissue was stained with Goldner's trichrome stain for trabecular and cellular analysis. TRAP staining was used to identify osteoclasts and define osteoclast surfaces. Unstained 10-μm sections were used for tetracycline-labeled fluorescence analysis. Slides were examined at ×400 magnification using a Leitz microscope attached to an Osteomeasure Image Analyzer (Osteometrics, Atlanta, GA). Ten contiguous 0.0225-mm2 fields of the distal femur, 150 μm proximal to the growth plate, were examined per animal. Primary, derived, and kinetic measures of bone remodeling were calculated and reported per guidelines of the American Society of Bone and Mineral Research.63
Reverse Transcription–PCR
RNA was extracted from aortas using RNeasy Mini Kits (Qiagen, Valencia, CA). Total RNA (1 μg) was reverse-transcribed using iScript cDNA synthesis kit from Bio-Rad (Hercules, CA) according to the manufacturer's instructions. Primers were designed using Vector NTI software (Invitrogen, Grand Island, NY), and optimal conditions for each primer pair were determined (Table 2). A Perkin-Elmer DNA Thermal Cycler was used to perform the reaction. After reverse transcription performed as described, real time was performed using the MX 4000 (Stratagene, La Jolla, CA), SYBR Green from Sigma, and the PCR kit from Invitrogen. Each reaction was performed in triplicate at 95°C for 45 s, 60°C for 30 s, and 60 s at 72°C for 40 cycles. This was followed by a melt cycle, which consisted of stepwise increase in temperature from 72 to 99°C. A single predominant peak was observed in the dissociation curve of each gene, supporting the specificity of the PCR product. Threshold values were set within the exponential phase of PCR and were used to calculate the expression levels of the genes of interest. Glyceraldehyde-3-phosphate dehydrogenase was used as an internal standard and used to normalize the values. A standard curve consisting of the threshold value versus log cDNA dilutions (corresponding to the log copy numbers) was generated by amplification of serial dilutions of cDNA corresponding to an unknown amount of amplicon. Negative controls were performed by inactivating the reverse transcriptase by boiling for 5 min before reverse transcription–PCR to ensure that genomic DNA was not amplified.
Table 2.
Primer sequences
| Gene | Primer | Sequence(5′-3′) | Product Length (bp) | Temperature (°C) |
|---|---|---|---|---|
| Osterix | Forward | TCCCTTCTCAAGCACCAATGGACT | 230 | 60 |
| Reverse | AGCTGTGAATGGGCTTCTTCCTCA | |||
| GAPDH | Forward | TGTTCCAGTATGACTCCACTCACG | 170 | 60 |
| Reverse | GAAGACACCAGTAGACTCCACGACA | |||
| CBFA1 | Forward | TGCAAGAAGGCTCTGGCGT | 200 | 60 |
| Reverse | CGCTGAAGAGGCTGTTTGACG | |||
| OC | Forward | TCATGTCCAAGCAGGAGGGCAATA | 292 | 58 |
| Reverse | TGACATCCATACTTGCAGGGCAGA | |||
| MSX2 | Forward | ACCACGTCCCAGCTTCTAGC | 183 | 60 |
| Reverse | GCTCTGCGATGGAGAGGTACTG |
Statistical Analysis
Statistical analysis was performed using ANOVA. Differences between groups were assessed post hoc using Fisher least significant difference method and considered significant at P < 0.05. Data are presented as means ± SEM. Analyses were performed using Sigma Stat statistical software (Point Richmond, CA).
DISCLOSURES
K.A.H., S.M., and R.L. have received honoraria for lectures from Abbott.
Acknowledgments
These studies were supported by grants from the National Institutes of Health, DK070790, DK05906, and AR41677 (K.A.H.), and Abbott.
A portion of this work was published in abstract form (J Am Soc Nephrol 17: 693A, 2006).
We thank Albert Edney, PhD, of Abbott for valuable discussions and Joel Melnick for support of these translational studies.
Published online ahead of print. Publication date available at www.jasn.org.
REFERENCES
- 1.Teng M, Wolf M, Ofsthun MN, Lazarus JM, Hernan MA, Camargo CA Jr, Thadhani R: Activated injectable vitamin D and hemodialysis survival: A historical cohort study. J Am Soc Nephrol 16: 1115–1125, 2005 [DOI] [PubMed] [Google Scholar]
- 2.Tentori F, Hunt WC, Stidley CA, Rohrscheib MR, Bedrick EJ, Meyer KB, Johnson HK, Zager PG: Mortality risk among hemodialysis patients receiving different vitamin D analogs. Kidney Int 70: 1858–1865, 2006 [DOI] [PubMed] [Google Scholar]
- 3.Teng M, Wolf M, Lowrie E, Ofsthun N, Lazarus JM, Thadhani R: Survival of patients undergoing hemodialysis with paricalcitol or calcitriol therapy. N Engl J Med 349: 446–456, 2003 [DOI] [PubMed] [Google Scholar]
- 4.Block GA, Klassen PS, Lazarus JM, Ofsthun N, Lowrie EG, Chertow GM: Mineral metabolism, mortality, and morbidity in maintenance hemodialysis. J Am Soc Nephrol 15: 2208–2218, 2004 [DOI] [PubMed] [Google Scholar]
- 5.Ganesh SK, Stack AG, Levin NW, Hulbert-Shearon T, Port FK: Association of elevated serum PO4, Ca x PO4 product, and parathyroid hormone with cardiac mortality risk in chronic hemodialysis patients. J Am Soc Nephrol 12: 2131–2138, 2001 [DOI] [PubMed] [Google Scholar]
- 6.Stevens LA, Djurdjev O, Cardew S, Cameron EC, Levin A: Calcium, phosphate, and parathyroid hormone levels in combination and as a function of dialysis duration predict mortality: Evidence for the complexity of the association between mineral metabolism and outcomes. J Am Soc Nephrol 15: 770–779, 2004 [DOI] [PubMed] [Google Scholar]
- 7.London GM, Guerin AP, Marchais SJ, Metivier F, Pannier B, Adda H: Arterial media calcification in end-stage renal diseases: Impact on all-cause and cardiovascular mortality. Nephrol Dial Transplant 18: 1731–1740, 2003 [DOI] [PubMed] [Google Scholar]
- 8.Sprague SM, Llach F, Amdahl M, Taccetta C, Batlle D: Paricalcitol versus calcitriol in the treatment of secondary hyperparathyroidism. Kidney Int 63: 1483–1490, 2003 [DOI] [PubMed] [Google Scholar]
- 9.Martin KJ, Gonzalez EA, Gellens M, Hamm LL, Abboud H, Lindberg J: 19-Nor-1-alpha-25-dihydroxyvitamin D2 (Paricalcitol) safely and effectively reduces the levels of intact parathyroid hormone in patients on hemodialysis. J Am Soc Nephrol 9: 1427–1432, 1998 [DOI] [PubMed] [Google Scholar]
- 10.Mizobuchi M, Finch JL, Martin DR, Slatopolsky E: Differential effects of vitamin D receptor activators on vascular calcification in uremic rats. Kidney Int 72: 709–715, 2007 [DOI] [PubMed] [Google Scholar]
- 11.Jono S, Nishizawa Y, Shioi A, Morii H: 1,25-Dihydroxyvitamin D3 increases in vitro vascular calcification by modulating secretion of endogenous parathyroid hormone related peptide. Circulation 98: 1302–1306, 1998 [DOI] [PubMed] [Google Scholar]
- 12.Price PA, Faus SA, Williamson MK: Warfarin-induced artery calcification is accelerated by growth and vitamin D. Arterioscler Thromb Vasc Biol 20: 317–327, 2000 [DOI] [PubMed] [Google Scholar]
- 13.Milliner DS, Zinsmeister AR, Lieberman L, Landing B: Soft tissue calcification in pediatric patients with end-stage renal disease. Kidney Int 38: 931–936, 1990 [DOI] [PubMed] [Google Scholar]
- 14.Goldsmith DJ, Covic A, Sambrook PA, Ackrill P: Vascular calcification in long-term haemodialysis patients in a single unit: A retrospective analysis. Nephron 77: 37–43, 1997 [DOI] [PubMed] [Google Scholar]
- 15.Wu-Wong JR, Noonan W, Ma J, Dixon D, Nakane M, Bolin AL, Koch KA, Postl S, Morgan SJ, Reinhart GA: Role of phosphorus and vitamin D analogs in the pathogenesis of vascular calcification. J Pharmacol Exp Ther 318: 90–98, 2006 [DOI] [PubMed] [Google Scholar]
- 16.Goodman WG, Ramirez JA, Belin TR, Chon Y, Gales B, Segre GV, Salusky IB: Development of adynamic bone in patients with secondary hyperparathyroidism after intermittent calcitriol therapy. Kidney Int 46: 1160–1166, 1994 [DOI] [PubMed] [Google Scholar]
- 17.Wang M, Hercz G, Sherrard DJ, Maloney NA, Segre GV, Pei Y: Relationship between intact 1-84 parathyroid hormone and levels for bone turnover in patients on chronic maintenance dialysis. Am J Kidney Dis 26: 836–844, 1995 [DOI] [PubMed] [Google Scholar]
- 18.Schmitt CP, Schaefer F, Huber D, Zahn I, Veldhuis JD, Ritz E, Mehls O: 1,25(OH)2-vitamin D3 reduces spontaneous and hypocalcemia-stimulated pulsatile component of parathyroid hormone secretion. J Am Soc Nephrol 9: 54–62, 1998 [DOI] [PubMed] [Google Scholar]
- 19.London GM, Marty C, Marchais SJ, Guerin AP, Metivier F, de Vernejoul MC: Arterial calcifications and bone histomorphometry in end-stage renal disease. J Am Soc Nephrol 15: 1943–1951, 2004 [DOI] [PubMed] [Google Scholar]
- 20.Coco M, Rush H: Increased incidence of hip fractures in dialysis patients with low serum parathyroid hormone. Am J Kidney Dis 36: 1115–1121, 2000 [DOI] [PubMed] [Google Scholar]
- 21.Alem AM, Sherrard DJ, Gillen DL, Weiss NS, Beresford SA, Heckbert SR, Wong C, Stehman-Breen C: Increased risk of hip fracture among patients with end-stage renal disease. Kidney Int 58: 396–399, 2000 [DOI] [PubMed] [Google Scholar]
- 22.Lund RJ, Davies MR, Brown AJ, Hruska KA: Successful treatment of an adynamic bone disorder with bone morphogenetic protein-7 in a renal ablation model. J Am Soc Nephrol 15: 359–369, 2004 [DOI] [PubMed] [Google Scholar]
- 23.Iwasaki-Ishizuka Y, Yamato H, Nii-Kono T, Kurokawa K, Fukagawa M: Downregulation of parathyroid hormone receptor gene expression and osteoblastic dysfunction associated with skeletal resistance to parathyroid hormone in a rat model of renal failure with low turnover bone. Nephrol Dial Transplant 20: 1904–1911, 2005 [DOI] [PubMed] [Google Scholar]
- 24.Coen G, Mazzaferrol S, Ballanti P, Sardella D, Chicca S, Manni M, Bonucci E, Taggi F: Renal bone disease in 76 patients with varying degrees of predialysis chronic renal failure: A cross-sectional study. Nephrol Dial Transplant 11: 813–819, 1996 [DOI] [PubMed] [Google Scholar]
- 25.Coen G: Adynamic bone disease: An update and overview. J Nephrol 18: 117–122, 2005 [PubMed] [Google Scholar]
- 26.Bellows CG, Ishida H, Aubin JE, Heersche JN: Parathyroid hormone reversibly suppresses the differentiation of osteoprogenitor cells into functional osteoblasts. Endocrinology 127: 3111–3116, 1990 [DOI] [PubMed] [Google Scholar]
- 27.Fu Q, Manolagas SC, O'Brien CA: Parathyroid hormone controls receptor activator of NF-kappaB ligand gene expression via a distant transcriptional enhancer. Mol Cell Biol 26: 6453–6468, 2006 [DOI] [PMC free article] [PubMed] [Google Scholar]
- 28.K/DOQI clinical practice guidelines on bone metabolism and disease in chronic kidney disease. Am J Kidney Dis 42: S12–S28, S52–S57, 2003 [PubMed] [Google Scholar]
- 29.Davies MR, Lund RJ, Hruska KA: BMP-7 is an efficacious treatment of vascular calcification in a murine model of atherosclerosis and chronic renal failure. J Am Soc Nephrol 14: 1559–1567, 2003 [DOI] [PubMed] [Google Scholar]
- 30.Davies MR, Lund RJ, Mathew S, Hruska KA: Low turnover osteodystrophy and vascular calcification are amenable to skeletal anabolism in an animal model of chronic kidney disease and the metabolic syndrome. J Am Soc Nephrol 16: 917–928, 2005 [DOI] [PubMed] [Google Scholar]
- 31.Mathew S, Lund R, Strebeck F, Tustison KS, Geurs T, Hruska KA: Reversal of the adynamic bone disorder and decreased vascular calcification in chronic kidney disease by sevelamer carbonate therapy. J Am Soc Nephrol 18: 122–130, 2007 [DOI] [PubMed] [Google Scholar]
- 32.Spasovski GB, Bervoets ARJ, Behets GJS, Ivanovski N, Sikole A, Dams G, Couttenye MM, De Broe ME, D'Haese PC: Spectrum of renal bone disease in end-stage renal failure patients not yet on dialysis. Nephrol Dial Transplant 18: 1159–1166, 2003 [DOI] [PubMed] [Google Scholar]
- 33.Pei Y, Hercz G, Greenwood C, Segre G, Manuel A, Saiphoo C, Fenton S, Sherrard D: Renal osteodystrophy in diabetic patients. Kidney Int 44: 159–164, 1993 [DOI] [PubMed] [Google Scholar]
- 34.Davies MR, Hruska KA: Pathophysiological mechanisms of vascular calcification in end-stage renal disease. Kidney Int 60: 472–479, 2001 [DOI] [PubMed] [Google Scholar]
- 35.Galassi A, Spiegel DM, Bellasi A, Block GA, Raggi P: Accelerated vascular calcification and relative hypoparathyroidism in incident haemodialysis diabetic patients receiving calcium binders. Nephrol Dial Transplant 21: 3215–3222, 2006 [DOI] [PubMed] [Google Scholar]
- 36.Towler DA, Bidder M, Latifi T, Coleman T, Semenkovich CF: Diet-induced diabetes activates an osteogenic gene regulatory program in the aortas of low density lipoprotein receptor-deficient mice. J Biol Chem 273: 30427–30434, 1998 [DOI] [PubMed] [Google Scholar]
- 37.Mathew S, Tustison K, Sugatani T, Chaudhary LR, Rifas L, Hruska KA: The mechanism of phosphorus as a cardiovascular risk factor in CKD. J Am Soc Nephrol 19: 1092–1105, 2008 [DOI] [PMC free article] [PubMed] [Google Scholar]
- 38.Cheng SL, Shao JS, Charlton-Kachigian N, Loewy AP, Towler DA: Msx2 promotes osteogenesis and suppresses adipogenic differentiation of multipotent mesenchymal progenitors. J Biol Chem 278: 45969–45977, 2003 [DOI] [PubMed] [Google Scholar]
- 39.Lian JB, Stein GS, Stein JL, van Wijnen AJ: Osteocalcin gene promoter: Unlocking the secrets for regulation of osteoblast growth and differentiation. J Cellular Biochem 30/31[Suppl]: 62–72, 1998 [DOI] [PubMed] [Google Scholar]
- 40.Phimphilai M, Zhao Z, Boules H, Roca H, Franceschi RT: BMP signaling is required for RUNX2-dependent induction of the osteoblast phenotype. J Bone Miner Res 21: 637–646, 2006 [DOI] [PMC free article] [PubMed] [Google Scholar]
- 41.Ducy P, Zhang R, Geoffroy V, Ridall AL, Karsenty G: Osf2/Cbfa1: A transcriptional activator of osteoblast differentiation. Cell 89: 747–754, 1997 [DOI] [PubMed] [Google Scholar]
- 42.Ducy P, Karsenty G: Two distinct osteoblast-specific cis acting elements control expression of a mouse osteocalcin gene. Mol Cell Biol 15: 1858–1869, 1995 [DOI] [PMC free article] [PubMed] [Google Scholar]
- 43.Moe SM, Duan D, Doehle BP, O'Neill KD, Chen NX: Uremia induces the osteoblast differentiation factor Cbfa1 in human blood vessels. Kidney Int 63: 1003–1011, 2003 [DOI] [PubMed] [Google Scholar]
- 44.Chen NX, Duan D, O'Neill KD, Wolisi GO, Koczman JJ, LaClair R, Moe SM: The mechanisms of uremic serum-induced expression of bone matrix proteins in bovine vascular smooth muscle cells. Kidney Int 70: 1046–1053, 2006 [DOI] [PubMed] [Google Scholar]
- 45.Shanahan CM, Proudfoot D, Tyson KL, Cary NR, Edmonds M, Weissberg PL: Expression of mineralisation-regulating proteins in association with human vascular calcification. Z Kardiol 89: S063–S068, 2000 [DOI] [PubMed] [Google Scholar]
- 46.Shanahan CM, Cary NRB, Metcalfe JC, Weissberg PL: High expression of genes for calcification-regulating proteins in human atherosclerotic plaques. J Clin Invest 93: 2393–2402, 1994 [DOI] [PMC free article] [PubMed] [Google Scholar]
- 47.Fischer JW, Steitz SA, Johnson PY, Burke A, Kolodgie F, Virmani R, Giachelli C, Wight TN: Decorin promotes aortic smooth muscle cell calcification and colocalizes to calcified regions in human atherosclerotic lesions. Arterioscler Thromb Vasc Biol 24: 2391–2396, 2004 [DOI] [PubMed] [Google Scholar]
- 48.Giachelli CM, Bae N, Almeida M, Denhardt DT, Alpers CE, Schwartz SM: Osteopontin is elevated during neointima formation in rat arteries and is a novel component of human atherosclerotic plaques. J Clin Invest 92: 1686–1696, 1993 [DOI] [PMC free article] [PubMed] [Google Scholar]
- 49.Boström K, Watson KE, Stanford WP, Demer LL: Atherosclerotic calcification: Relation to developmental osteogenesis. Am J Cardiol 75: 88B–91B, 1995 [DOI] [PubMed] [Google Scholar]
- 50.Hruska KA, Teitelbaum S: New features of renal osteodystrophy. N Engl J Med 333: 166–174, 1995 [DOI] [PubMed] [Google Scholar]
- 51.Shao JS, Cheng SL, Pingsterhaus JM, Charlton-Kachigian N, Loewy AP, Towler DA: Msx2 promotes cardiovascular calcification by activating paracrine Wnt signals. J Clin Invest 115: 1210–1220, 2005 [DOI] [PMC free article] [PubMed] [Google Scholar]
- 52.Shao JS, Cai J, Towler DA: Molecular mechanisms of vascular calcification: Lessons learned from the aorta. Arterioscler Thromb Vasc Biol 26: 1423–1430, 2006 [DOI] [PubMed] [Google Scholar]
- 53.Massy ZA, Ivanovski O, Nguyen-Khoa T, Angulo J, Szumilak D, Mothu N, Phan O, Daudon M, Lacour B, Drueke TB, Muntzel MS: Uremia accelerates both atherosclerosis and arterial calcification in apolipoprotein E knockout mice. J Am Soc Nephrol 16: 109–116, 2005 [DOI] [PubMed] [Google Scholar]
- 54.Moe SM, Chen NX: Pathophysiology of vascular calcification in chronic kidney disease. Circ Res 95: 560–567, 2004 [DOI] [PubMed] [Google Scholar]
- 55.Simpson CL, Lindley S, Eisenberg C, Basalyga DM, Starcher BC, Simionescu DT, Vyavahare NR: Toward cell therapy for vascular calcification: Osteoclast-mediated demineralization of calcified elastin. Cardiovasc Pathol 16: 29–37, 2007 [DOI] [PubMed] [Google Scholar]
- 56.Boström KI: Cell differentiation in vascular calcification. Z Kardiol 89[Suppl 2]: II/69–II/74, 2000 [DOI] [PubMed] [Google Scholar]
- 57.Doherty TM, Uzui H, Fitzpatrick LA, Tripathi PV, Dunstan CR, Asotra K, Rajavashisth TB: Rationale for the role of osteoclast-like cells in arterial calcification. FASEB J 16: 577–582, 2002 [DOI] [PubMed] [Google Scholar]
- 58.Goltzman D, Miao D, Panda DK, Hendy GN: Effects of calcium and of the Vitamin D system on skeletal and calcium homeostasis: Lessons from genetic models. J Steroid Biochem Mol Biol 89–90: 485–489, 2004 [DOI] [PubMed] [Google Scholar]
- 59.Hendy GN, Hruska KA, Mathew S, Goltzman D: New insights into mineral and skeletal regulation by active forms of vitamin D. Kidney Int 69: 218–223, 2006 [DOI] [PubMed] [Google Scholar]
- 60.Panda DK, Miao D, Bolivar I, Li J, Huo R, Hendy GN, Goltzman D: Inactivation of the 25-hydroxyvitamin D 1α-hydroxylase and vitamin D receptor demonstrates independent and interdependent effects of calcium and vitamin D on skeletal and mineral homeostasis. J Biol Chem 279: 16754–16766, 2004 [DOI] [PubMed] [Google Scholar]
- 61.Norman PE, Powell JT: Vitamin D, shedding light on the development of disease in peripheral arteries. Arterioscler Thromb Vasc Biol 25: 39–46, 2005 [DOI] [PubMed] [Google Scholar]
- 62.Doherty TM, Tang W, Dascalos S, Watson KE, Demer LL, Shavelle RM, Detrano RC: Ethnic origin and serum levels of 1alpha,25-dihydroxyvitamin D3 are independent predictors of coronary calcium mass measured by electron-beam computed tomography. Circulation 96: 1477–1481, 1997 [DOI] [PubMed] [Google Scholar]
- 63.Parfitt AM, Drezner MK, Glorieux FH, Kanis JA, Malluche H, Meunier PJ, Ott SM, Recker RR: Bone histomorphometry: Standardization of nomenclature, symbols, and units. J Bone Miner Res 2: 595–610, 1987 [DOI] [PubMed] [Google Scholar]


