Abstract
The immunosuppressive mammalian target of rapamycin inhibitor rapamycin is widely used in solid-organ transplantation, but the effect of rapamycin on kidney disease is controversial. This study evaluated the effect of rapamycin in the autologous phase of anti–glomerular basement membrane (anti-GBM) glomerulonephritis. Disease was induced by preimmunizing the animals with rabbit IgG 5 d before administration of rabbit anti-mouse GBM antiserum. When rapamycin was started on the day of immunization (group 1), mice were protected from glomerulonephritis, suggested by a dramatic decrease in albuminuria, influx of inflammatory cells, and Th1-cytokine expression in the kidneys. Activation of T cells and production of autologous mouse anti-rabbit IgG were also significantly reduced in rapamycin-treated animals. In contrast, when rapamycin was started 14 d after immunization (group 2), mice had a significant increase in albuminuria and renal infiltration of inflammatory cells compared with vehicle-treated animals, and there were no differences in T and B cell responses. A significant decrease in vascular endothelial growth factor-A and an increase in IL-6 were detected in kidneys of these rapamycin-treated mice. In conclusion, rapamycin has the potential to significantly reduce the B and T cell responses and thereby protect from glomerulonephritis when administered early in disease. Once disease is established, however, rapamycin seems to worsen glomerulonephritis by disturbing the endothelial cell/vascular endothelial growth factor system in the kidney.
Rapamycin is a macrolide antibiotic drug that has potent immunosuppressive capacities and has been used for more than a decade as an immunosuppressive agent in solid-organ transplantation. Intracellularly, it forms a complex with the FK-binding protein-12, which inhibits the serine/threonine kinase mammalian target of rapamycin (mTOR), thereby inhibiting cell growth and cell-cycle progression.1 The immunosuppressive effect of rapamycin was first attributed to the inhibition of cytokine-induced proliferation and clonal expansion of T cells.1 More recently, it has become evident that mTOR is a ubiquitous kinase that promotes the proliferation of most cell types.2,3 Hence, rapamycin has gained attention as a potent drug in cancer treatment.4,5 In addition, rapamycin has been shown to inhibit the proliferation of B cells and has very recently been described to be a potential therapeutic option in systemic lupus erythematosus.6,7 Both studies evaluated the effect of rapamycin or its derivative everolimus on lupus-prone mice, namely NZB/W F1 or B6.Sle1z.Sle3z mice.6,7 They provided evidence that rapamycin treatment significantly decreased autoantibody production, thereby reducing glomerulonephritis (GN)6,7; however, further evidence suggested that rapamycin can lead to an increase in proteinuria followed by a decline in renal function.8–10 Oberbauer et al.11 reported a significant increase in the rate of proteinuria in patients who had been switched from a calcineurin inhibitor–based immunosuppressive regimen to rapamycin. In some of those cases of worsening proteinuria, new onset or recurrence of GN was diagnosed by renal biopsy.10,12 Nevertheless, the mechanisms of this adverse effect of rapamycin are largely unknown.
Divergent findings on the influence of rapamycin in experimental models of kidney disease have been published. Whereas some of the studies found rapamycin to be beneficial for the outcome of kidney disease,7,13–15 others observed that rapamycin treatment led to exacerbation of disease.16 Mechanistically, both outcomes were traced back to the widely known inhibitory effect of rapamycin on vascular endothelial growth factor-A (VEGF-A).4,14,16 The importance of VEGF in the pathogenesis of proteinuric kidney diseases was convincingly demonstrated by work of the group of Quaggin and others.17–21 Whereas Yuan et al.18 described a significantly decreased VEGF-A expression in the glomeruli of mice after induction of anti-GBM GN as compared with healthy controls,18 the study of Shimizu et al.17 found increased proteinuria and kidney injury in mice that received a VEGF-blocking antibody. Moreover, the group of Quaggin provided compelling evidence that podocytes are important producers of VEGF-A, which is essential to keeping the integrity of the glomerular filtration barrier.19–21
To date, data on the effect of rapamycin in a Th1-dependent anti-GBM model are lacking; therefore, this study was designed to evaluate the effect of rapamycin in the autologous phase of anti-GBM GN. Here, we provide evidence that rapamycin has beneficial as well as adverse effects depending on when rapamycin treatment is initiated by influencing on the one hand inflammatory cells and on the other hand the expression of VEGF-A.
RESULTS
Start of Rapamycin on the Day of Immunization (Group 1)
Rapamycin Treatment Attenuated Renal Damage in Group 1.
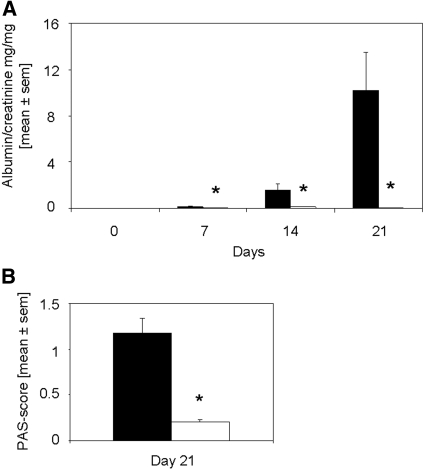
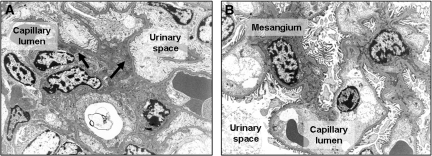
Rapamycin was described on the one hand to limit autoimmune disease7 but on the other hand to have the potential to induce posttransplantation GN10; therefore, we were interested in the influence of rapamycin on the outcome of anti-GBM GN. Mice received either 1 mg/kg body wt per d rapamycin or vehicle starting at the day of immunization. Rapamycin-treated mice were found to have dramatically decreased albuminuria 7, 14, and 21 d after induction of anti-GBM GN (Figure 1A). As expected, mild to moderate hypercellularity and focal deposition of periodic acid Schiff (PAS)-positive material (Figure 1B), and occasional small crescent formations were observed in mice receiving vehicle. These abnormalities were not seen in mice treated with rapamycin (Figure 1B). Ultrastructurally, active immunocomplex GN with mesangial widening, hypercellularity, partial podocyte foot process effacement, and abundant electron-dense immunocomplex deposits were found in vehicle-treated mice 21 d after induction of anti-GBM GN (Figure 2A). In rapamycin-treated mice, regular glomerular ultrastructure with narrow mesangium, regular podocyte foot processes, and inconspicuous endothelial cells were detected (Figure 2B). No immunocomplex deposits were found (Figure 2B).
Figure 1.
Rapamycin started on the day of immunization significantly reduces albuminuria and PAS-positive deposits in glomeruli. (A) Albumin and creatinine were evaluated on days 0, 7, 14, and 21 after induction of anti-GBM GN. Urine albumin excretion (in mg) was determined and expressed per mg of urinary creatinine to standardize for the urine concentration. Mice that were treated with rapamycin (□; n = 16 at days 0, 7, and 14; n = 8 at day 21) starting on the day of immunization displayed significantly decreased albuminuria on days 7, 14, and 21 as compared with vehicle-treated mice (▪; n = 14 at days 0, 7, and 14; n = 7 at day 21). *P < 0.05. (B) PAS-positive deposits were scored in glomeruli of rapamycin- (□; n = 8) and vehicle-treated mice (▪; n = 7) on day 21 after induction of disease. The mean score of 50 glomeruli is given. Rapamycin-treated mice displayed significantly decreased PAS-positive deposits. *P < 0.05.
Figure 2.
Rapamycin started on the day of immunization markedly inhibits morphologic changes of GN. Representative electron microscopy pictures from day 21 are shown. (A) Ultrastructurally, active immunocomplex GN with mesangial widening, hypercellularity, partial podocyte foot process effacement, and abundant electron-dense immunocomplex deposits (black arrows) were detected in mice that received vehicle and were subjected to anti-GBM GN. (B) Electron microscopy of rapamycin-treated mouse kidneys revealed regular glomerular ultrastructure with narrow mesangia, regular podocyte foot processes, and inconspicuous endothelial cells. No immunocomplex deposits were detected. Magnification, ×5000.
Infiltration of Inflammatory Cells and Th1-Cytokine Expression Was Significantly Decreased in Kidneys of Rapamycin-Treated Mice of Group 1.
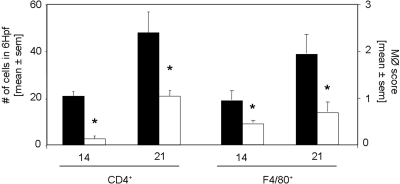
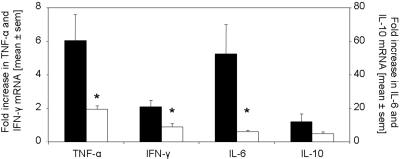
CD4+ T cells were significantly decreased in kidneys of rapamycin-treated mice on days 14 and 21 as compared with controls (Figure 3). Macrophages, stained for F4/80 (Figure 3) and ER-HR3+ (data not shown), were significantly reduced in kidneys of rapamycin-treated mice on days 14 and 21. Furthermore, we detected significantly decreased mRNA expression of the Th1 cytokines IFN-γ, TNF-α, and IL-6 in the kidneys of rapamycin-treated mice, whereas the difference in the expression of IL-10 did not reach significance 21 d after induction of anti-GBM GN (Figure 4). Of note, IL-17 mRNA was detected in all kidneys of vehicle-treated mice but not in the rapamycin-treated mice (data not shown).
Figure 3.
Rapamycin started on the day of immunization inhibits the infiltration of interstitial CD4+ T cells and macrophages. The infiltration of inflammatory cells was analyzed by immunohistochemistry. Kidneys were stained for CD4+ T cells and macrophages 14 and 21 d after induction of anti-GBM nephritis in mice treated with rapamycin (□; n = 8 per time point) or vehicle (▪; n = 7 per time point). CD4+ T cell infiltration was significantly decreased 14 and 21 d after anti-GBM injection. Interstitial accumulation of F4/80+ cells was significantly diminished in rapamycin-treated mice on day 14 and 21 after induction of disease. *P < 0.05.
Figure 4.
Rapamycin started on the day of immunization modulates renal mRNA expression of IFN-γ, TNF-α, and IL-6. The expression of TNF-α, IFN-γ, IL-6, and IL-10 mRNA was evaluated by real-time PCR of total RNA from kidneys of mice treated with rapamycin (□; n = 8) or vehicle (▪; n = 7) 21 d after anti-GBM injection. Rapamycin treatment starting on the day of immunization significantly reduced mRNA expression of IFN-γ, TNF-α, and IL-6 in the kidneys but not for IL-10. *P < 0.05.
T Cells but not Regulatory T Cells Were Significantly Impaired by Rapamycin Treatment in Group 1.
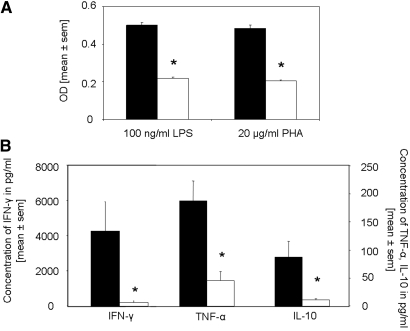
To gain insights into the systemic response after rapamycin treatment, we were interested in the proliferation and cytokine production of splenocytes isolated from rapamycin- and vehicle-treated mice after restimulation with LPS or phytohemagglutinin (PHA). We found the splenocyte proliferation to be significantly decreased in rapamycin-treated mice as compared with respective controls after both stimulations (Figure 5A). In line, splenocytes from rapamycin-treated mice stimulated with either PHA or LPS (data not shown) produced significantly decreased levels of the cytokines IFN-γ, TNF-α, and IL-10 (Figure 5B). This was confirmed by performing real-time PCR for the cytokine profile in lymph nodes (Table 1). IFN-γ and IL-17 were significantly decreased in rapamycin-treated mice, whereas differences in TNF-α and IL-6 did not reach significance. No difference was found in the IL-10 mRNA expression between the groups.
Figure 5.
The proliferation and production of IFN-γ, TNF-α, and IL-10 of spleen cell cultures is significantly reduced after rapamycin treatment starting on the day of immunization. On day 14 after anti-GBM injection, 1 × 10⁷ splenocytes from animals treated with either rapamycin (□; n = 8) or vehicle (▪; n = 7) were seeded in 24-well plates and stimulated with LPS (100 ng/ml) or PHA (20 mg/ml) for 16 h. (A and B) Proliferation of LPS- and PHA-stimulated splenocytes (A) and cytokine production of PHA-stimulated splenocytes (B) was determined. Proliferation and cytokine production were significantly inhibited by rapamycin treatment. *P < 0.05.
Table 1.
Systemic inflammatory response of mice from groups 1 and 2a
| Characteristics of Mice | Group 1
|
Group 2
|
||
|---|---|---|---|---|
| Vehicle | Rapamycin | Vehicle | Rapamycin | |
| Cytokine expression in LN | ||||
| IFN-γ | 53.7 ± 9.2 | 14.9 ± 3.8b | 36.8 ± 7.9 | 22.0 ± 5.5 |
| TNF-α | 4.2 ± 0.5 | 3.0 ± 0.4 | 5.1 ± 1.0 | 5.9 ± 0.8 |
| IL-6 | 23.6 ± 18.9 | 1.5 ± 0.4 | 20.8 ± 5.6 | 21.9 ± 6.8 |
| IL-10 | 3.3 ± 0.3 | 2.9 ± 0.4 | 6.9 ± 1.2 | 6.0 ± 0.8 |
| IL-17 | 10.1 ± 1.3 | 4.6 ± 1.3b | 13.7 ± 3.5 | 15.1 ± 4.0 |
| FoxP3 expression in LN | 5.7 ± 1.1 | 4.9 ± 0.7 | 7.2 ± 2.7 | 4.8 ± 1.2 |
| Splenocyte proliferation | ||||
| proliferation to LPS (OD 450) | 0.50 ± 0.00 | 0.22 ± 0.00b | 1.81 ± 0.10 | 1.92 ± 0.20 |
| proliferation to PHA (OD 450) | 0.48 ± 0.00 | 0.21 ± 0.00b | 2.12 ± 0.20 | 2.00 ± 0.20 |
| B cell response | ||||
| rabbit anti-mouse IgG (OD 450) | 0.73 ± 0.10 | 0.34 ± 0.10b | 0.91 ± 0.10 | 0.73 ± 0.10 |
| Deposition of rabbit IgG (titer) | 1:3200 | 1:3200 | 1:3200 | 1:3200 |
Mice were treated with either rapamycin or vehicle starting on the day of immunization (group 1; n = 8 in the rapamycin group, n = 6 in the vehicle group) or 14 d after induction of anti-GBM GN (group 2; n = 8 per group). We evaluated the cytokine expression profiles and FoxP3 expression in the lymph node (LN), splenocyte proliferation, and the amount of mouse anti-rabbit IgG in the serum 21 (group 1) or 35 d (group 2) after induction of anti-GBM GN. In addition we provided the titer of the deposited rabbit IgG on the GBM. The cytokine expressions evaluated by real-time PCR are given as fold increase compared with healthy controls. Data are means ± SEM.
P < 0.05 versus the respective control group.
Evidence has suggested that rapamycin has the potential to expand regulatory T cells (Treg) in vitro.22 Previously, our group showed that administration of Treg suppresses the inflammatory response in anti-GBM GN and acts rather in the draining lymph nodes than locally in the kidney23; therefore, we evaluated the number of Treg by performing real-time PCR for the detection of FoxP3 in lymph nodes of mice that received either rapamycin or vehicle 14 d after induction of disease. Interestingly, we found no difference in the FoxP3 transcription (Table 1).
B Cell Response Was Significantly Downregulated by Rapamycin Treatment in Group 1.
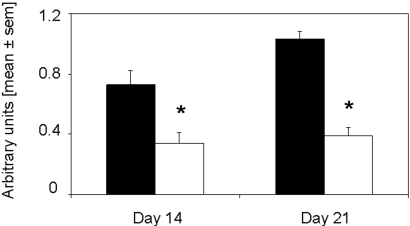
Rapamycin has the potential to inhibit significantly the B cell response.6,7 When rapamycin was started on the day of immunization, mouse anti-rabbit IgG were found to be significantly decreased in rapamycin-treated mice as compared with respective controls (Figure 6). There was no switch in the subtypes of mouse IgG (data not shown), and deposition of the rabbit anti-mouse GBM antibody was equal in both groups (Table 1).
Figure 6.
IgG production is significantly inhibited by rapamycin treatment starting on the day of immunization. Mouse anti-rabbit IgG was evaluated in rapamycin- (□; n = 8 per time point) and vehicle-treated (▪; n = 7 per time point) on day 14 and 21 after anti-GBM injection. Concentrations of mouse anti-rabbit IgG were significantly diminished in rapamycin-treated mice at all tested time points. *P < 0.05.
It was interesting to note that when we started rapamycin treatment 2 d after injection of the anti-GBM serum, comparable results were obtained. Even with a 2-d delay, rapamycin had the potential to inhibit the antibody production by B cells, thereby protecting mice from anti-GBM GN (data not shown).
Start of Rapamycin at 14 d after Induction of Anti-GBM GN (Group 2)
Rapamycin Treatment Significantly Increased Renal Damage in Group 2.
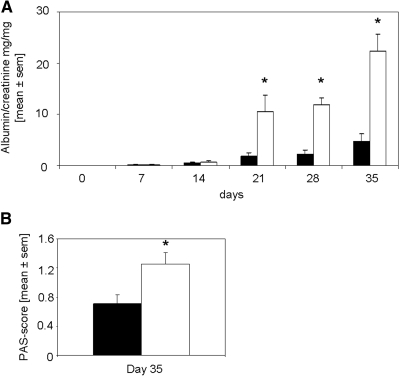
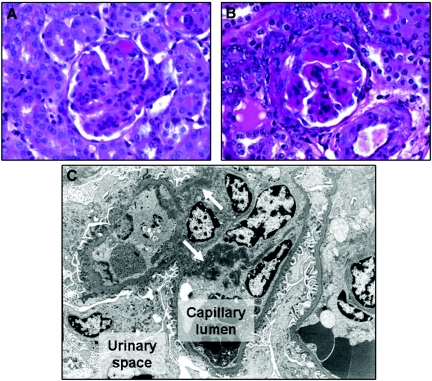
To avoid a blockade of the B cell response in our model of anti-GBM GN, we started rapamycin/vehicle treatment (1 mg/kg body wt per d) on day 14 after injection of the rabbit anti-mouse GBM serum. Opposite to the results of group 1, group 2 rapamycin-treated mice displayed significantly increased proteinuria as compared with vehicle-treated controls (Figure 7A). Histologic evaluation revealed rapamycin-treated mice to display significantly increased amounts of PAS-positive deposits (Figure 7B), infiltration of inflammatory cells, and mesangial matrix accumulation and immunodeposits visualized by electron microscopy as compared with vehicle-treated controls (Figure 8).
Figure 7.
Rapamycin treatment started 14 d after induction of anti-GBM GN increases albuminuria and PAS-positive deposits in glomeruli. (A) Albumin and creatinine were evaluated on days 0, 7, 14, 21, 28, and 35 after induction of anti-GBM GN. Urine albumin excretion (in mg) was determined and expressed per mg of urinary creatinine to standardize for the urine concentration. Mice that were treated with rapamycin (□; n = 8 at all time points) starting 14 d after induction of disease displayed significantly increased albuminuria on days 7, 14, and 21 as compared with vehicle-treated mice (▪; n = 8 at all time points). *P < 0.05. (B) PAS-positive deposits were scored in glomeruli of rapamycin- (□; n = 8) and vehicle-treated mice (▪; n = 8) on day 35 after induction of disease. The mean score of 50 glomeruli is given. Rapamycin-treated mice displayed significantly increased PAS-positive deposits. *P < 0.05.
Figure 8.
Rapamycin started 14 d after induction of anti-GBM GN markedly enhances morphologic changes in the kidneys. Representative PAS-stained sections and electron microscopy pictures from day 35 are shown. (A) A representative glomerulus from a mouse receiving vehicle showed enlargement, increased PAS-positive deposits, and an increase in mesangial matrix formation. (B) A representative glomerulus from a mouse receiving rapamycin showed even more accentuated signs of active immunocomplex GN. (C) Ultrastructurally, strong mesangial widening, hypercellularity, partial podocyte foot process effacement, and multiple confluent electron-dense immunocomplex deposits (white arrows) were visible in rapamycin-treated mouse kidneys. Magnifications: ×60 in A and B; ×5000 in C.
Infiltration of Inflammatory Cells and Th1-Cytokine Expression Was Increased in Kidneys of Rapamycin-Treated Mice of Group 2.
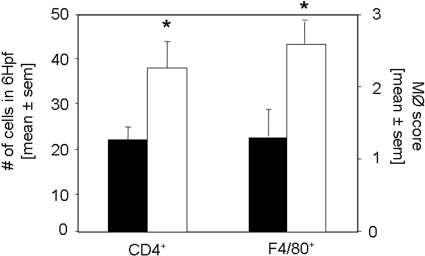
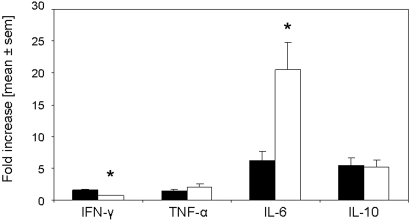
In line with the glomerular damage, we detected significantly increased infiltration of inflammatory cells, namely CD4+ (Figure 9), F4/80+ (Figure 9), and ER-HR3+ cells (data not shown), into kidneys of rapamycin-treated as compared with vehicle-treated mice. The cytokine profiles in the kidney differed significantly between the rapamycin- and vehicle-treated mice. In detail, the mRNA expression of the proinflammatory Th1 cytokine IL-6 was significantly increased in kidneys of rapamycin-treated mice (Figure 10). The expression of IL-10 and TNF-α did not significantly differ between the groups, whereas IFN-γ transcription, as observed in group 1, was significantly inhibited by rapamycin treatment (Figure 10). Of note, IL-17 mRNA was detected in kidneys 35 d after induction of anti-GBM GN, but the expression did not significantly differ between rapamycin- and vehicle-treated mice (data not shown).
Figure 9.
Rapamycin treatment started 14 d after induction of anti-GBM GN increases the infiltration of interstitial CD4+ T cells and macrophages. The infiltration of inflammatory cells was analyzed by immunohistochemistry. Staining for CD4+ and macrophages was performed 35 d after induction of anti-GBM nephritis in mice treated with rapamycin (□; n = 8) or vehicle (▪; n = 8). Interstitial accumulation of CD4+ T cells and F4/80+ cells was significantly increased in rapamycin-treated mice 35 d after induction of disease. *P < 0.05.
Figure 10.
Rapamycin treatment started 14 d after induction of anti-GBM GN modulates renal mRNA expression of IFN-γ and IL-6. The expression of IFN-γ, TNF-α, IL-6, and IL-10 mRNA was evaluated by real-time PCR of total RNA from kidneys of mice treated with rapamycin (□; n = 8) or vehicle (▪; n = 8) 35 d after anti-GBM injection. Rapamycin treatment starting 14 d after induction of anti-GBM GN significantly reduced mRNA expression of IFN-γ but significantly increased IL-6 in the kidneys. For IL-10 and TNF-α, significance was not reached. *P < 0.05.
T Cell Response Was not Impaired by Rapamycin Treatment in Group 2.
In addition, we evaluated whether the systemic inflammatory response as well as the proliferation of splenocytes is influenced by rapamycin, when starting the treatment 14 d after induction of disease. Contrary to the results of group 1 animals, rapamycin treatment did not significantly influence the splenocyte proliferation 35 d after induction of disease (Table 1). Moreover, no significant differences in the IFN-γ, TNF-α, and IL-10 cytokine production of splenocytes restimulated with either PHA or LPS were found in this experimental setting (data not shown). This was proved by evaluating mRNA cytokine profiles from regional draining lymph nodes, which have been shown to be the location of immunoregulation in anti-GBM GN.23,24 Here, we found comparable mRNA expression of TNF-α, IL-6, IL-17, and IL-10 in rapamycin- and vehicle-treated animals (Table 1). As in group 1, we detected no differences in the transcription of the Treg marker FoxP3 between the rapamycin- and vehicle-treated mice of group 2 (Table 1).
B Cell Response Was not Influenced by Rapamycin Treatment in Group 2.
Because we detected a significant influence of rapamycin on the B cell response when rapamycin treatment was started on the day of immunization, we evaluated the amount of mouse anti-rabbit IgG in group 2. Interestingly, the total IgG (Table 1) as well as the IgG subclasses (data not shown) did not significantly differ between rapamycin- and vehicle-treated mice of group 2. Deposition of rabbit IgG on the GBM was comparable in both groups (Table 1).
VEGF-A Expression in the Kidney Was Significantly Decreased by Rapamycin in Group 2.
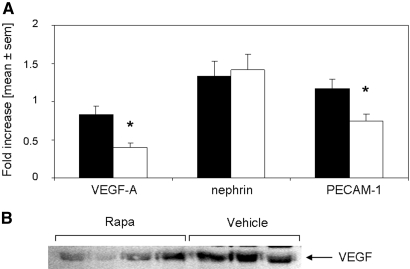
In line with previous reports,17,18 we detected a downregulation of VEGF-A mRNA expression in kidneys after induction of anti-GBM GN, but rapamycin-treated mice of group 2 displayed significantly decreased VEGF-A expression in the kidneys as compared with respective controls (Figure 11). In contrast, no difference in the VEGF-A expression in the regional lymph nodes of group 2 mice was detected (data not shown). Of note, no significant difference in VEGF-A expression was detected in group 1 animals (data not shown).
Figure 11.
VEGF-A is significantly decreased by rapamycin treatment starting 14 d after anti-GBM GN. (A) Thirty-five days after induction of anti-GBM GN, mice were evaluated for their mRNA expression of VEGF-A, nephrin-1, and PECAM-1 in kidneys of rapamycin- (□; n = 8) or vehicle-treated mice (▪; n = 8). Mice treated with rapamycin starting on day 14 after induction of anti-GBM GN displayed significantly decreased expression of VEGF-A and PECAM-1 but equal expression of nephrin-1. (B) Protein expression of VEGF was evaluated in kidneys of rapamycin- and vehicle-treated mice 35 d after induction of anti-GBM GN. A representative Western blot from three independent experiments is shown.
To evaluate whether podocytes or endothelial cells, both potent producers of VEGF,16,25 are harmed by rapamycin treatment, we performed real-time PCR for the detection of the podocyte marker nephrin and the endothelial cell marker platelet-endothelial cell adhesion molecule (PECAM-1). PECAM-1 was found to be significantly decreased in kidneys of rapamycin-treated mice as compared with controls, whereas no difference was detected for nephrin (Figure 11). In line, no reduction in the podocyte number but a decrease of the glomerular endothelial cells was detected by electron microscopy (data not shown).
DISCUSSION
The effect of rapamycin on models of kidney injury is controversially discussed throughout the literature.7,13–16 Because clinical data provide evidence that rapamycin might lead to increased proteinuria in kidney transplant recipients11 or recurrence and de novo onset of GN,10 we evaluated the effect of rapamycin on the autologous phase of an experimental model of anti-GBM GN. Here, we first demonstrate in one model two modes of action by rapamycin strictly depending on the start of rapamycin treatment. Mice receiving rapamycin starting from the day of immunization were protected from anti-GBM GN by an inhibition of the T as well as the B cell response. In contrast, when rapamycin treatment was started 14 d after induction of anti-GBM GN, disease was dramatically enhanced by rapamycin treatment.
Rapamycin is an antiproliferative substance that inhibits mTOR and thereby prevents subsequent proliferation and cell-cycle progression.9 It was long thought to be specific for T cells and therefore used as an immunosuppressive reagent in transplantation.9 Strikingly, we found the B cell response to be significantly diminished by rapamycin treatment. Recently, data from the lupus-prone mice pointed to a possible new therapeutic option for rapamycin.6,7 Wu et al.6 and Alperovich et al.7 described that rapamycin downregulated pathogenic antibody levels, thereby protecting mice from lupus nephritis. These data together with our findings in anti-GBM GN set the stage for rapamycin as a therapeutic option in antibody-mediated autoimmune disease.
Nevertheless, blocking only the B cell response by rapamycin cannot be the single mechanism responsible for the protection of our mice from anti-GBM GN. It has already been shown in the μ-chain knockout mouse that despite the lack of B cells and IgG production, these mice still develop proteinuria when anti-GBM GN is induced.26 Not surprising, a systemic inhibition of the T cell response was also evident in our model of anti-GBM GN, when rapamycin treatment was started on the day of immunization. More recently, rapamycin gained attention because of its potential to expand Treg selectively in vitro.22 This was not the case in vivo; rapamycin was able to expand Treg only when administered in conjunction with IL-10.27 In our model, we found the Treg content was not altered by rapamycin, but because effector T cells were significantly decreased after early start of rapamycin treatment, Treg relatively increased and thereby might contribute to the protection of mice from anti-GBM GN.
Nevertheless, limitations for a use of rapamycin in anti-GBM GN are evolving from our second set of experiments (group 2). Contrary to starting rapamycin treatment on the day of immunization, administration of rapamycin 14 d after induction of anti-GBM GN led to a progression of disease. This is in accordance with Daniel et al.,16 who found rapamycin to worsen anti-Thy1 nephritis. They hypothesized that rapamycin leads to decreased expression of VEGF-A and decreased proliferation of endothelial cells, thereby limiting the repair mechanisms of the kidney.16 In parallel, we found VEGF-A to be decreased in the kidney by rapamycin treatment. Inhibition of VEGF-A by a selective blocking antibody or the soluble VEGF receptor–soluble fms-like tyrosine kinase 1 has already been shown to worsen GN significantly.17,28 Contrary to these reports, a decrease of VEGF was found to attenuate kidney failure in a model of reduced renal mass,14 which led the authors to speculate that VEGF can have beneficial but also detrimental effects depending on the model itself and the starting point of treatment.
Because no systemic decrease of VEGF was found in our model, we suggested that rapamycin might harm cells producing VEGF, such as podocytes or endothelial cells. We detected no difference in the expression of nephrin between rapamycin- and vehicle-treated mice, suggesting that the number of podocytes is not reduced by rapamycin. This finding was confirmed by electron microscopy. These data are in line with in vitro data of Laugharne et al.,25 who found podocyte culture cells not to be influenced by rapamycin treatment. In addition, we evaluated the expression of the endothelial cell marker PECAM-1 in kidneys of rapamycin- and vehicle-treated mice and found PECAM-1 to be significantly decreased. The reduction of the endothelial cell number in the glomeruli of rapamycin-treated mice was confirmed by electron microscopy.
Interestingly, IL-6 was also detected to be significantly upregulated in the kidneys of rapamycin-treated mice of group 2. IL-6 has gained attention as the key cytokine in regulation of the immune response, which leads to a shift from Treg toward Th17 cells,29 but because expression of IL-17 and the Treg marker FoxP3 did not significantly differ between rapamycin- and vehicle-treated mice of group 2, we concluded that at this time point, IL-6 seems only to be an indicator for the endothelial cell damage, as has been shown before.30,31 Nevertheless, further studies using cell-specific knockout mice, as has been shown by the group of Quaggin,19,20 are needed to evaluate the influence of rapamycin on IL-6 and VEGF modulation in anti-GBM GN.
Together, we provide the first evidence that rapamycin can have beneficial as well as detrimental effects in a single kidney disease model depending on the time when treatment is initiated. When rapamycin treatment was started at the time of immunization, rapamycin-treated mice were totally protected from anti-GBM GN by a downregulation of the T and B cell response, but, most interesting, when antibody titers and proteinuria were already imminent, rapamycin led to worsening of anti-GBM GN, probably by modulating the VEGF/endothelial cell interaction.
CONCISE METHODS
Study Design
Eight- to 12-wk-old male C57Bl/6J mice obtained from Charles River (Sulzfeld, Germany) were used throughout the studies. Animals were maintained in a virus/antibody-free central animal facility of the Innsbruck Medical University. Accelerated anti-GBM nephritis was induced as described previously.32 In brief, mice were preimmunized subcutaneously with 2 mg/ml rabbit IgG (Jackson ImmunoResearch Laboratories, West Grove, PA) dissolved in incomplete Freund's adjuvant (Sigma, St. Louis, MI) and nonviable desiccated Mycobacterium tuberculosis H37a (Difco Laboratories, Detroit, MI). After 5 d, heat-inactivated rabbit anti-mouse GBM antiserum was injected via the tail vein. Mice received 1 mg/kg body wt per d rapamycin (LC Laboratories, Woburn, MA) or vehicle intraperitoneally starting either 5 d before or 2 or 14 d after application of the anti-mouse GBM antiserum. Twenty-four-hour urine samples were collected in metabolic cages at indicated time points. All animal experiments were approved by Austrian veterinary authorities.
Measurement of Rapamycin Blood Levels
Rapamycin EDTA whole blood levels were measured by HPLC-MS/MS. Sample preparation of whole-blood calibrators, quality control samples, and specimens relied on a cell lysis and protein precipitation protocol (50-μl sample, 250 μl of H2O and 750 μl of precipitation solution [0.1 M ZnSO4:MeOH = 1:2 (vol/vol)] spiked with the internal standard 32-demethoxyrapamycin). A two-dimensional chromatography setup (injection volume 50 μl of precipitation supernatant) combining an on-line solid-phase extraction purification step over a reversed phase polymer material (Oasis HLB 20 × 2.1 mm, 25-μm particle size [Waters, Milford, MA]; solvent: H2O:MeOH = 9:1 [vol/vol], 0.4% formic acid, and 4 ml/min flow) and isocratic chromatography with a reversed phase C-18 HPLC column (Zorbax Eclipse XDB-C18 100 × 3 mm, 3.5-μm particle size [Agilent Technologies, Waldbronn, Germany]; solvent: H2O:MeOH = 3:97 [vol/vol], 0.1% AcOH, 10 mM NH4Ac, and 0.8 ml/min flow) was used to separate the analyte from residual matrix constituents. An API4000Qtrap instrument (Applied Biosystems/MDS Sciex, Toronto, Ontario, Canada) operating in the ESI-MRM mode (rapamycin 931.6 to 864.8 m/z; internal standard 901.6 to 834.8 m/z) served as detector. Quantification was based on the area ratio analyte to internal standard. A six-level calibrator was used, and the linear calibration function was weighting with 1/x. The interbatch coefficient of variation of the assay was found to be <5% for all quality control materials during the study period. Mean rapamycin blood trough levels of 34.5 ± 5.5 ng/ml were reached in the mice treated daily with 1 mg/kg body wt rapamycin intraperitoneally (n = 4).
Urinary Albumin and Urinary Creatinine Detection
Urinary albumin was determined by a double-sandwich ELISA (Abcam, Cambridge, MA) as reported previously.32 Urinary creatinine was quantified spectrophotometrically using a Picric acid–based method (Sigma).
Assessment of Glomerular Injury
Glutaraldehyde-fixed renal tissue was evaluated by electron microscopy. In addition, formalin-fixed renal tissue was embedded in paraffin, cut in 4-μm sections, and stained with PAS for histologic analysis. In all cases, a minimum of 50 equatorial glomerular cross-sections were evaluated as described previously.33
The three-layer immunoperoxidase technique on frozen tissue sections (4 μm) was used for the detection of macrophages and T cells in the kidney sections.32 Macrophages were stained using two different rat anti-mouse antibodies, namely clone F4/80 (Serotec, Oxford, UK) and clone ER-HR3 (Abcam, Cambridge, UK). A semiquantitative scoring system was performed as follows: 0, 0 to 4 cells stained positive; 1+, 5 to 10 cells; 2+, 10 to 50 cells; 3+, 50 to 200 cells; and 4+, >200 cells stained positive per low-power field. For the detection of CD4+ T cells, a rat anti-mouse CD4 mAb (clone YTS191.1; Serotec) was used. Biotin-conjugated goat anti-rat IgG antibody (Jackson ImmunoResearch Laboratories, Cambridgeshire, UK) was used as a secondary antibody, followed by incubation with an avidin-biotin complex and subsequent development with 0.4% 3-amino-9-ethylcarbazole for 6 min and counterstaining with Gill's Hematoxylin No. 3 (Polysciences, Warrington, PA). Quantification of T cells was done by counting the number of cells in six adjacent high-power fields of renal cortex and medulla.
For the detection of heterologous IgG deposition, sections were stained by direct immunofluorescence with a FITC-conjugated goat anti-rabbit IgG (Jackson ImmunoResearch Laboratories). Semiquantitative assessment of the glomerular deposition of IgG was performed by determining the end point positive titer for detection of staining using serial dilutions of each antibody.
Reverse Transcription Real-Time PCR
Total RNA was isolated using TRIzol (Sigma) according to a standard protocol. Thereafter, 2 μg of total RNA was reverse-transcribed using Superscript III Transcription Kit (Invitrogen, Carlsbad, CA) and random primers (Roche, Basel, Switzerland). Real-time PCR was performed on an ABI Prism 7700 (Applied Biosystems, Foster City, CA). For linear amplification of TNF-α, FoxP3, VEGF-A, nephrin, PECAM-1, and β-actin (reference gene) SYBR Green Master Mix (Invitrogen) and the following primers was used: TNF-α forward 5′-GAA CTG GCA GAA GAG GCA CT-3′, reverse 5′-AGG GTC TGG GCC ATA GAA CT-3′; FoxP3 forward 5′-TCT TGC CAA GCT GGA AGA CT-3′, reverse 5′-AGC TGA TGC ATG AAG TGT GG-3′; VEGF-A forward 5′-GCC GTC CTG TGT GCC GCT GAT G-3′, reverse 5′-GCC CTC CGG ACC CAA AGT GCT C-3′, nephrin forward 5′-TTC AGC AAG GAG ACC TTC AAG AA-3′, reverse 5′-GCC CCT CAA TCC ACA GCT T-3′; PECAM-1 forward 5′-GAG AAG AGC AGC CGA TTC CT-3′, reverse 5′-AAC CTC CTT TCA CCC CCC-3′; and β-actin forward 5′-GAA GTG TGA CGT TGA CAT CCG-3′, reverse 5′-TGC TGA TCC ACA TCT GCT GGA-3′. For quantification of IFN-γ, IL-10, IL-6, and IL-17, TaqMan Mastermix (Applied Biosystems) and the gene expression assays Mm00801778_m1, Mm00439616_m1, Mm00446190_m1, and Mm00439619_m1 (Applied Biosystems) were used.
Detection of Circulating Ig
For detection of circulating mouse anti-rabbit IgG, including respective mouse IgG subclasses, 96-well plates (Greiner, Kremsmuenster, Austria) were coated with 100 μg/ml rabbit IgG in carbonate/bicarbonate buffer (pH 9.5) overnight at 4°C, and the plate was blocked with 1% BSA. Plates were washed with PBS containing 0.05% Tween-20 and then incubated with serial-doubling dilutions of mouse serum, starting at 1:50. After further washing, bound mouse IgG was detected with horseradish peroxidase (HRP)-conjugated goat-anti-mouse IgG (Dako, Glostrup, Denmark) at a dilution of 1:2000. The mouse IgG subclasses were detected using HRP-conjugated goat-anti mouse IgG1, IgG2b, and IgG3 (all from Jackson ImmunoResearch Laboratories). For the detection of rabbit Ig, 96-well plates (Greiner) were coated with goat anti-rabbit IgG (Jackson ImmunoResearch Laboratories) diluted 1:1000. After blocking with 1% BSA, the plates were incubated with serial-doubling dilutions of mouse serum, starting at 1:50. Bound rabbit IgG was detected with HRP-conjugated goat anti-rabbit IgG (Dako) diluted 1:2000. For all evaluations, serum from nonimmunized mice was used as controls.
Detection of Cytokine Production and Proliferation of Splenocytes
Freshly isolated splenocytes (1 to 5 × 10⁷/ml) from mice that received either rapamycin or vehicle were seeded in 24-well plates and tested individually for cytokine response to LPS (100 ng/ml; Sigma) and PHA (20 μg/ml; Sigma). Supernatants were harvested after 24 h, and TNF-α, IFN-γ, and IL-10 were determined using commercially available ELISA kits (Pharmingen, San Diego, CA). For evaluating proliferation of the splenocytes, 200 μl of the cells that were stimulated for 16 h were transferred to a 96-well plate (Greiner) and incubated with the EZ4U substrate (EZ4U Proliferation kit; Biomedica, Vienna, Austria) for 5 h according to the manufacturer's protocol.
Western Blotting
Kidney samples were homogenized and lysed on ice by using Triton lysis buffer (37.6 mM KCl, 24.8 mM Tris base, and 1% Triton X-100) supplemented with 1% protease inhibitor cocktail (Sigma). Quantification of protein was performed by using BCA protein assay kit (Pierce Biotechnology, Rockford, IL). Twenty-five micrograms of each sample was analyzed on 10% SDS-PAGE and blotted on hydrophobic polyvinylidene difluoride membrane (Amersham Biosciences Corp., Piscataway, NJ). Rabbit anti-VEGF antibody (clone A-20) was purchased from Santa Cruz Biotechnology (Santa Cruz, CA) and used at a final concentration of 0.4 μg/ml. As a secondary antibody, HRP-conjugated goat anti-rabbit IgG (Dako) at a dilution of 1:2000 was used. After chemiluminescent reaction using an electrochemiluminescence kit Western blot reagent (Amersham Biosciences Corp), the blots were exposed to Hyperfilm electrochemiluminescence (Amersham Biosciences Corp.).
Statistical Analysis
Results are presented as means ± SEM. Normal distribution of data were assessed by the Kolmogorov-Smirnov test with Lilliefors correction. Both groups were compared by either nonparametric Mann-Whitney U test or unpaired t test as appropriate, depending on the distribution of the tested variable. A two-tailed P < 0.05 was considered statistically significant. All statistical analyses were done with SPSS 12.0.1 for Windows (SPSS, Chicago, IL).
DISCLOSURES
None.
Acknowledgments
We thank Suze Noppert for carefully editing our manuscript.
Published online ahead of print. Publication date available at www.jasn.org.
REFERENCES
- 1.Abraham RT, Wiederrecht GJ: Immunopharmacology of rapamycin. Annu Rev Immunol 14: 483–510, 1996 [DOI] [PubMed] [Google Scholar]
- 2.Hosoi H, Dilling MB, Liu LN, Danks MK, Shikata T, Sekulic A, Abraham RT, Lawrence JC Jr, Houghton PJ: Studies on the mechanism of resistance to rapamycin in human cancer cells. Mol Pharmacol 54: 815–824, 1998 [DOI] [PubMed] [Google Scholar]
- 3.Humar R, Kiefer FN, Berns H, Resink TJ, Battegay EJ: Hypoxia enhances vascular cell proliferation and angiogenesis in vitro via rapamycin (mTOR)-dependent signaling. FASEB J 16: 771–780, 2002 [DOI] [PubMed] [Google Scholar]
- 4.Stallone G, Schena A, Infante B, Di Paolo S, Loverre A, Maggio G, Ranieri E, Gesualdo L, Schena FP, Grandaliano G: Sirolimus for Kaposi's sarcoma in renal-transplant recipients. N Engl J Med 352: 1317–1323, 2005 [DOI] [PubMed] [Google Scholar]
- 5.Bjornsti MA, Houghton PJ: The TOR pathway: A target for cancer therapy. Nat Rev Cancer 4: 335–348, 2004 [DOI] [PubMed] [Google Scholar]
- 6.Wu T, Qin X, Kurepa Z, Kumar KR, Liu K, Kanta H, Zhou XJ, Satterthwaite AB, Davis LS, Mohan C: Shared signaling networks active in B cells isolated from genetically distinct mouse models of lupus. J Clin Invest 117: 2186–2196, 2007 [DOI] [PMC free article] [PubMed] [Google Scholar]
- 7.Alperovich G, Rama I, Lloberas N, Franquesa M, Poveda R, Goma M, Herrero-Fresneda I, Cruzado JM, Bolanos N, Carrera M, Grinyo JM, Torras J: New immunosuppresor strategies in the treatment of murine lupus nephritis. Lupus 16: 18–24, 2007 [DOI] [PubMed] [Google Scholar]
- 8.Franco AF, Martini D, Abensur H, Noronha IL: Proteinuria in transplant patients associated with sirolimus. Transplant Proc 39: 449–452, 2007 [DOI] [PubMed] [Google Scholar]
- 9.Augustine JJ, Bodziak KA, Hricik DE: Use of sirolimus in solid organ transplantation. Drugs 67: 369–391, 2007 [DOI] [PubMed] [Google Scholar]
- 10.Dittrich E, Schmaldienst S, Soleiman A, Horl WH, Pohanka E: Rapamycin-associated post-transplantation glomerulonephritis and its remission after reintroduction of calcineurin-inhibitor therapy. Transpl Int 17: 215–220, 2004 [DOI] [PubMed] [Google Scholar]
- 11.Oberbauer R, Schena FP, Wali R, Pascoe M, Alberu J, del Carmen Rial M, the Sirolimus CONVERT Trial Study Group: Conversion from Calcineurin Inhibitors to Sirolimus Compared with Continued Use of Calcineurin Inhibitors in Renal Allograft Recipients: 24-Month Safety and Efficacy Results from the CONVERT Trial. Presented at the Congress of the American Society of Nephrology; San Diego, CA; November 17, 2006
- 12.Sahin GM, Sahin S, Kantarci G, Ergin H: Proteinuria after conversion to sirolimus in renal transplant recipients. Transplant Proc 38: 3473–3475, 2006 [DOI] [PubMed] [Google Scholar]
- 13.Lock HR, Sacks SH, Robson MG: Rapamycin at subimmunosuppressive levels inhibits mesangial cell proliferation and extracellular matrix production. Am J Physiol Renal Physiol 292: F76–F81, 2007 [DOI] [PubMed] [Google Scholar]
- 14.Diekmann F, Rovira J, Carreras J, Arellano EM, Banon-Maneus E, Ramirez-Bajo MJ, Gutierrez-Dalmau A, Brunet M, Campistol JM: Mammalian target of rapamycin inhibition halts the progression of proteinuria in a rat model of reduced renal mass. J Am Soc Nephrol 18: 2653–2660, 2007 [DOI] [PubMed] [Google Scholar]
- 15.Bonegio RG, Fuhro R, Wang Z, Valeri CR, Andry C, Salant DJ, Lieberthal W: Rapamycin ameliorates proteinuria-associated tubulointerstitial inflammation and fibrosis in experimental membranous nephropathy. J Am Soc Nephrol 16: 2063–2072, 2005 [DOI] [PubMed] [Google Scholar]
- 16.Daniel C, Renders L, Amann K, Schulze-Lohoff E, Hauser IA, Hugo C: Mechanisms of everolimus-induced glomerulosclerosis after glomerular injury in the rat. Am J Transplant 5: 2849–2861, 2005 [DOI] [PubMed] [Google Scholar]
- 17.Shimizu A, Masuda Y, Mori T, Kitamura H, Ishizaki M, Sugisaki Y, Fukuda Y: Vascular endothelial growth factor165 resolves glomerular inflammation and accelerates glomerular capillary repair in rat anti-glomerular basement membrane glomerulonephritis. J Am Soc Nephrol 15: 2655–2665, 2004 [DOI] [PubMed] [Google Scholar]
- 18.Yuan HT, Tipping PG, Li XZ, Long DA, Woolf AS: Angiopoietin correlates with glomerular capillary loss in anti-glomerular basement membrane glomerulonephritis. Kidney Int 61: 2078–2089, 2002 [DOI] [PubMed] [Google Scholar]
- 19.Eremina V, Sood M, Haigh J, Nagy A, Lajoie G, Ferrara N, Gerber HP, Kikkawa Y, Miner JH, Quaggin SE: Glomerular-specific alterations of VEGF-A expression lead to distinct congenital and acquired renal diseases. J Clin Invest 111: 707–716, 2003 [DOI] [PMC free article] [PubMed] [Google Scholar]
- 20.Eremina V, Cui S, Gerber H, Ferrara N, Haigh J, Nagy A, Ema M, Rossant J, Jothy S, Miner JH, Quaggin SE: Vascular endothelial growth factor a signaling in the podocyte-endothelial compartment is required for mesangial cell migration and survival. J Am Soc Nephrol 17: 724–735, 2006 [DOI] [PubMed] [Google Scholar]
- 21.Eremina V, Baelde HJ, Quaggin SE: Role of the VEGF: A signaling pathway in the glomerulus—Evidence for crosstalk between components of the glomerular filtration barrier. Nephron Physiol 106: 32–37, 2007 [DOI] [PubMed] [Google Scholar]
- 22.Battaglia M, Stabilini A, Roncarolo MG: Rapamycin selectively expands CD4+CD25+FoxP3+ regulatory T cells. Blood 105: 4743–4748, 2005 [DOI] [PubMed] [Google Scholar]
- 23.Wolf D, Hochegger K, Wolf AM, Rumpold HF, Gastl G, Tilg H, Mayer G, Gunsilius E, Rosenkranz AR: CD4+CD25+ regulatory T cells inhibit experimental anti-glomerular basement membrane glomerulonephritis in mice. J Am Soc Nephrol 16: 1360–1370, 2005 [DOI] [PubMed] [Google Scholar]
- 24.Hochegger K, Siebenhaar F, Vielhauer V, Heininger D, Mayadas TN, Mayer G, Maurer M, Rosenkranz AR: Role of mast cells in experimental anti-glomerular basement membrane glomerulonephritis. Eur J Immunol 35: 3074–3082, 2005 [DOI] [PubMed] [Google Scholar]
- 25.Laugharne M, Cross S, Richards S, Dawson C, Ilchyshyn L, Saleem M, Mathieson P, Smith R: Sirolimus toxicity and vascular endothelial growth factor release from islet and renal cell lines. Transplantation 83: 1635–1638, 2007 [DOI] [PubMed] [Google Scholar]
- 26.Rosenkranz AR, Knight S, Sethi S, Alexander SI, Cotran RS, Mayadas TN: Regulatory interactions of alphabeta and gammadelta T cells in glomerulonephritis. Kidney Int 58: 1055–1066, 2000 [DOI] [PubMed] [Google Scholar]
- 27.Battaglia M, Stabilini A, Draghici E, Gregori S, Mocchetti C, Bonifacio E, Roncarolo MG: Rapamycin and interleukin-10 treatment induces T regulatory type 1 cells that mediate antigen-specific transplantation tolerance. Diabetes 55: 40–49, 2006 [PubMed] [Google Scholar]
- 28.Hara A, Wada T, Furuichi K, Sakai N, Kawachi H, Shimizu F, Shibuya M, Matsushima K, Yokoyama H, Egashira K, Kaneko S: Blockade of VEGF accelerates proteinuria, via decrease in nephrin expression in rat crescentic glomerulonephritis. Kidney Int 69: 1986–1995, 2006 [DOI] [PubMed] [Google Scholar]
- 29.Steinman L: A brief history of T(H)17, the first major revision in the T(H)1/T(H)2 hypothesis of T cell-mediated tissue damage. Nat Med 13: 139–145, 2007 [DOI] [PubMed] [Google Scholar]
- 30.Bernhard D, Csordas A, Henderson B, Rossmann A, Kind M, Wick G: Cigarette smoke metal-catalyzed protein oxidation leads to vascular endothelial cell contraction by depolymerization of microtubules. FASEB J 19: 1096–1107, 2005 [DOI] [PubMed] [Google Scholar]
- 31.Yan SF, Ogawa S, Stern DM, Pinsky DJ: Hypoxia-induced modulation of endothelial cell properties: Regulation of barrier function and expression of interleukin-6. Kidney Int 51: 419–425, 1997 [DOI] [PubMed] [Google Scholar]
- 32.Rosenkranz AR, Mendrick DL, Cotran RS, Mayadas TN: P-selectin deficiency exacerbates experimental glomerulonephritis: A protective role for endothelial P-selectin in inflammation. J Clin Invest 103: 649–659, 1999 [DOI] [PMC free article] [PubMed] [Google Scholar]
- 33.Kitching AR, Holdsworth SR, Ploplis VA, Plow EF, Collen D, Carmeliet P, Tipping PG: Plasminogen and plasminogen activators protect against renal injury in crescentic glomerulonephritis. J Exp Med 185: 963–968, 1997 [DOI] [PMC free article] [PubMed] [Google Scholar]


