Abstract
We describe a method to design dominant-negative proteins (D-N) to the basic helix–loop–helix–leucine zipper (B-HLHZip) family of sequence-specific DNA binding transcription factors. The D-Ns specifically heterodimerize with the B-HLHZip dimerization domain of the transcription factors and abolish DNA binding in an equimolar competition. Thermal denaturation studies indicate that a heterodimer between a Myc B-HLHZip domain and a D-N consisting of a 12-amino acid sequence appended onto the Max dimerization domain (A-Max) is −6.3 kcal⋅mol−1 more stable than the Myc:Max heterodimer. One molar equivalent of A-Max can totally abolish the DNA binding activity of a Myc:Max heterodimer. This acidic extension also has been appended onto the dimerization domain of the B-HLHZip protein Mitf, a member of the transcription factor enhancer binding subfamily, to produce A-Mitf. The heterodimer between A-Mitf and the B-HLHZip domain of Mitf is −3.7 kcal⋅mol−1 more stable than the Mitf homodimer. Cell culture studies show that A-Mitf can inhibit Mitf-dependent transactivation both in acidic extension and in a dimerization-dependent manner. A-Max can inhibit Myc-dependent foci formation twice as well as the Max dimerization domain (HLHZip). This strategy of producing D-Ns may be applicable to other B-HLHZip or B-HLH proteins because it provides a method to inhibit the DNA binding of these transcription factors in a dimerization-specific manner.
Keywords: Heterodimer, Max, Mitf, Myc, protein design, transcription factor enhancer binding
The basic helix–loop–helix–leucine zipper (B-HLHZip) family of sequence-specific DNA binding transcription factors (1) is implicated in both cellular proliferation (2) and differentiation (3). Structurally, these proteins have a dimerization domain consisting of a parallel, left-handed, four-helix bundle (4, 5). An N-terminal α-helical extension of the dimerization domain interacts with the major groove of DNA to bind an abutted palindromic DNA sequence known as an E-Box (-CANNTG-). As in the case of the structurally related bZIP proteins (5), dimerization of B-HLHZip domains is accompanied by a radical change in protein secondary structure from a random coil monomer to an α-helical dimer (6). A second structural transition occurs upon DNA binding. The basic region is unstructured in the absence of DNA and becomes α-helical upon binding to the major groove of DNA (6). DNA binding stabilizes the protein complex.
Two general methods have been developed for generating dominant-negatives (D-Ns) to dimeric transcription factors. The first is to delete the transactivation domain (7). Such a D-N would bind DNA in vivo but fail to activate transcription. These D-Ns need to be overexpressed to overcome any stabilizing interactions that may occur between the transactivation domain of the endogenous transcription factor and other components of the transcriptional apparatus. The second method for making a D-N is to delete the DNA binding region (8, 9). Such D-Ns heterodimerize with endogenous factors and prevent DNA binding. To function, such D-N molecules again need to be overexpressed to counterbalance the stabilization that occurs when the native B-HLHZip domain binds to DNA.
We report here a general design strategy to develop D-Ns to B-HLHZip family members that inhibit DNA binding in an equimolar competition. We replaced the B-HLHZip basic region, critical for DNA binding, with an acidic protein sequence to produce the D-N. The heterodimer between the D-N and the B-HLHZip domain is more stable than the B-HLHZip domain bound to DNA. This acidic sequence interacts with the basic regions of Myc, Max, and Mitf, three different B-HLHZip proteins, suggesting that the strategy will be a useful general method to make robust D-Ns to the B-HLHZip family of transcription factors.
MATERIALS AND METHODS
Protein Sequences.
All of the recombinant proteins contain φ10 (MASMTGGQQMGR-DP) at their N terminus (10). Myc contains the FLAG epitope followed by φ10 (MDYKDDDDK-). The mouse Myc (11) (B-Myc) sequence is NDKRRTHNVLERQRRNELKRSFFALRDQIPELENNEKAPKVVILKKATAYILSIQADEHKLTSEKDLLRKRREQLKHKLEQLRNSGA. The mouse Max B-HLHZip domain (B-Max) is (12) ADKRAHHNALERKRRDHIKDSFHSLRDSVPSLQGEKASRAQILDKATEYIQYMRRKNDTHQQDIDDLKRQNALLEQQVRALEKARSSAQLQT.
The mouse Mitf (3) B-HLHZip domain (B-Mitf) is RALAKERQKKDNHNLIERRRRFNINDRIKELGTLIPKSNDPDMRWNKGTILKASVDYIRKLQREQQRAKDLENRQKKLEHANRHLLLRVQELEMQARAHGLSL.
Δ-Max and Δ-Mitf were obtained by deleting the basic region up to the phenylalanine in helix 1, which is in bold in the B-HLHZip sequences. The following sequences were inserted between the BamHI (DP) and the XhoI (LE) N terminus site of the HLHZip domain:
783-Max: -DPD-LEKEAEELEQENAELELEDS-F
784-Max: -DPD-LEKEAEELEQENAELEELEDS-F
785-Max: -DPD-LEKEAEELEQENAELEEELEDS-F
A-Max: -DPD-EEEDDEEELEELEDS-F
The XhoI site encoding LE (in bold) was used to exchange dimerization domains. The two aspartic acids in the acidic extension were inserted to increase the fidelity of the PCR. The Max D-Ns were made either in the background of the mouse Max B-HLHZip (A-Max) (4) or the human Max B-HLHZip (12) domain plus an additional 47 amino acids terminating at the natural C terminus (A-Max-C). They had similar ellipticities and thermal denaturation profiles.
Protein Purification.
Proteins were cloned in pET-3b vector, expressed in Escherichia coli, and purified as described (13). For the B-Myc purification, cells were suspended in 50 mM Tris (pH 8.0), 1 mM EDTA, 1 mM DTT, 1 mM phenylmethylsulfonyl fluoride, and 1 mM benzamidine, frozen, thawed, and brought to 5 M urea. This was spun at 30,000 rpm for 30 min. The supernatant was isolated, heated to 65°C, and dialyzed against 20 mM Tris (pH 8.0), 50 mM KCl, 1 mM EDTA, 1 mM DTT, 1 mM phenylmethylsulfonyl fluoride, and 1 mM benzamidine. The dialysate was heated to 65°C and spun at 30,000 rpm for 30 min. The supernatant was loaded onto a heparin column and subsequently chromatographed on the HPLC. Protein concentrations were calculated at 230 nm (13).
Circular Dichroism (CD).
All experiments were performed in 12.5 mM phosphate (pH 7.4), 150 mM KCl, 0.25 mM EDTA, and 1 mM DTT. Protein concentration was 4.8 μM for each of the individual proteins in the sample. Tm values were calculated as described before (14), converted to Kd(37) and ΔG(37) using a ΔCp of −1.9 kcal⋅mol°C−1 calculated from a Tm vs. ΔH plot for all of the proteins used in this study. All thermal melts were reversible.
DNA Binding Assay.
Proteins were bound to DNA as described (15) in a buffer of 12.5 mM potassium phosphate (pH 7.4), 150 mM KCl, 0.25 mM EDTA, 10 mM DTT, 1 mg/ml BSA, and 2% glycerol. The sequence of the 22-bp E-Box probe was GTGTAGGCCACGTGACCGGGTG with the E-Box in bold.
Transient Transfection and Immunofluorescent Labeling.
Melan-c cells (16) were split 20 hours before transfection, and three 60-mm dishes per DNA combination (4 μg total) were transfected by the Lipofectin method (GIBCO/BRL). Four plasmids were added to the transfection: 0.5 μg of the tested D-N [A-Mitf, Δ-Mitf, B-Mitf, or A-Max was cloned into pRc/CMV566 (15)]; 2.4 μg of the parental vector pRc/CMV (Invitrogen); 0.1 μg of β-galactosidase expression vector for control of transfection efficiency; and 1.0 μg of the luciferase reporter with [MBpLuc (17)] or without (pGL2-promoter vector, Promega) four copies of an M-Box sequence. After the transfection (24 h after), cells on half of the surface of each dish were harvested and assayed for protein amount and luciferase activity. Cells on the other half of the dish were stained for β-galactosidase activity. Relative luciferase activity was calculated with the amount of protein and the number of β-galactosidase-expressing cells. Immunofluorescent labeling was done on paraformaldehyde-fixed Triton X-100 permeabilized cells using a mouse monoclonal anti-hemagglutinin antibody (Babco, Richmond, CA) and an appropriate rhodamine–isothiocyanate conjugated second antibody.
Stable Transfections.
Stable transfection of the murine fibroblast cell line C3H10T1/2 (ATCC CCL226) was performed as described (18), using the calcium phosphate DNA precipitation method. Individual precipitates containing 200 ng of pT24 H-ras (19), 600 ng of pMC29 v-myc, and 2 μg of each pRc/CMV566 construct were added to two 100-mm tissue culture dishes. The efficiency of focus formation was calculated for each experimental group based on the number of foci obtained from a parallel group transfected with H-ras and v-myc that is set at 1.00.
RESULTS
Dimerization and DNA Binding of Myc:Max.
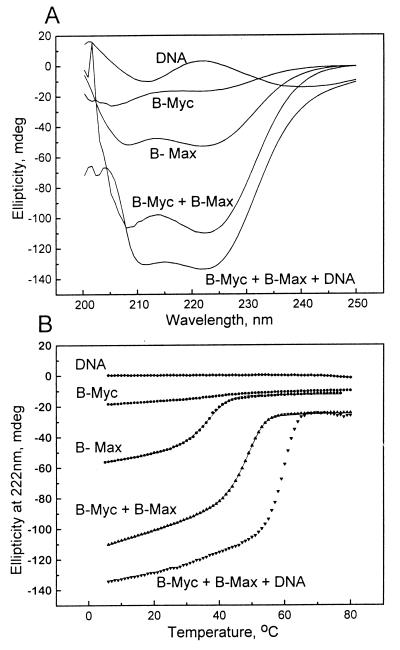
We have used the heterodimerizing system of the B-HLHZip proteins Myc and Max (12, 20) to develop D-Ns that interact with Myc more stably than the Myc:Max heterodimer bound to DNA. Equilibrium sedimentation data indicate that the Myc B-HLHZip domain (B-Myc) is a monomer whereas the Max B-HLHZip domain (B-Max) and B-Myc + B-Max are dimeric at 6°C. Increasing the temperature to 37°C produces a B-Max sample that is in a monomer–dimer equilibrium (data not shown). The CD spectrum of B-Max at 6°C was 60% α-helical as evidenced by the amplitude of the minima at 208 and 222 nm, which are hallmarks of α-helical structure (Fig. 1A). B-Myc alone had no α-helical structure. A 1:1 mixture of B-Myc and B-Max showed higher CD amplitude than the sum of CD signals of the individual proteins, suggesting that B-Myc was now heterodimerizing with B-Max, again being 60% helical (21). The addition of DNA (a 22-bp double-stranded oligonucleotide containing a single E-Box) increased the α-helical signal to 75%, which we interpret to reflect transition of the basic region to an α-helical conformation upon DNA binding.
Figure 1.
DNA binding stabilizes the Myc:Max heterodimer. (A) Far UV CD spectra at 6°C. Lanes: 1, 22-bp, double-stranded DNA containing E-Box; 2, Myc B-HLHZip domain (B-Myc); 3, Max B-HLHZip domain (B-Max); 4, B-Myc + B-Max; and 5, B-Myc + B-Max + DNA. The concentration of B-Myc, B-Max, and double-stranded DNA was 4.8 μM. The minima at 208 and 222 nm are indicative of α-helical structure. The increase in helicity with the addition of DNA suggests that the B-Myc and B-Max basic regions are becoming α-helical upon DNA binding. (B) CD thermal denaturation curves at 222 nm of the five samples presented in A. The lines through the B-Max and B-Myc + B-Max denaturation profiles are fitted curves assuming a two-state transition between α-helical dimers and nonhelical monomers. The transition at 62°C is due to the dissociation of the B-Myc:B-Max:DNA complex.
The dimerization stability of the samples characterized in Fig. 1A was determined from thermal denaturation curves monitored by CD spectroscopy at 222 nm (Fig. 1B; Table 1). B-Max undergoes a thermal unfolding from α-helix at a low temperature to random coil at high temperature centered at Tm = 36.2°C. The combination of CD and equilibrium sedimentation data suggests that B-Max is an α-helical dimer at low temperatures and an unstructured monomer at higher temperatures. B-Myc remained unstructured in the temperature range studied. The mixture of B-Myc and B-Max was more stable than Max (Tm = 48.6°C) (Fig. 1B; Table 1). The E-Box containing DNA had little ellipticity, which did not change with increasing temperature (Fig. 1B). The addition of this DNA stabilized the B-Myc:B-Max complex (Tm = 62°C). Thus, to be efficient, a D-N has to overcome the extra stability brought about by DNA binding, or, in other words, it must associate with Myc so tightly that it will disrupt Myc:Max bound to DNA in an equimolar stoichiometry.
Table 1.
Thermodynamic parameters of D-Ns with different B-HLHZip proteins
| Protein | Homodimer
|
Heterodimer with B-Myc
|
||||||
|---|---|---|---|---|---|---|---|---|
| Tm, °C | ΔH(Tm), kcal/mol | ΔG(37), kcal/mol | kd(37), M | Tm, °C | ΔH(Tm), kcal/mol | ΔG(37), kcal/mol | kd(37), M | |
| B-Max | 36.2 | −92 | −7.5 | 6e-6 | 48.6 | −95 | −10.7 | 3e-8 |
| Δ-Max-C | 34.2 | −80 | −7.0 | 1e-5 | 48.4 | −105 | −11.0 | 2e-8 |
| Δ-Max | 34.6 | −77 | −7.0 | 1e-5 | 48.0 | −101 | −10.8 | 3e-8 |
| 783-Max | 44.8 | −102 | −10.0 | 9e-8 | 60.3 | −133 | −15.4 | 2e-11 |
| 784-Max | 46.4 | −110 | −10.7 | 3e-8 | 60.6 | −124 | −14.6 | 6e-11 |
| 785-Max | 45.9 | −98 | −10.2 | 7e-8 | 59.8 | −147 | −16.3 | 6e-12 |
| A-Max-C | 46.6 | −92 | −10.2 | 7e-8 | 65.6 | −123 | −15.8 | 9e-12 |
| A-Max | 46.7 | −109 | −10.7 | 3e-8 | 66.4 | −137 | −17.0 | 1e-12 |
| B-Mitf | 46.2 | −69 | −9.9 | 1e-7 | heterodimer with B-Mitf | |||
| A-Mitf | 58.4 | −107 | −13.6 | 3e-10 | 61.0 | −100 | −13.6 | 3e-10 |
| heterodimer with B-Max | ||||||||
| A-Max | 48.8 | −100 | −11.0 | 2e-8 | ||||
The stability of B-HLHZip domains, potential D-Ns, and mixtures was determined by thermal denaturation monitored by circular dichroism spectroscopy. The table presents: the designation of the protein sample; the melting temperature (Tm, °C); dimerization van’t Hoff enthalpy at T = Tm, ΔH(Tm); Gibbs free energy at 37°C, ΔG(37); and the dissociation constant at 37°C, kd(37). All thermal denaturations were reversible and well fit by a two-state model of nonhelical monomers and α-helical dimers.
The Acidic Extension.
Previously, we designed D-Ns to the bZIP family of dimeric sequence-specific DNA-binding transcription factors (13, 15). These D-Ns consisted of the leucine zipper dimerization domain and an acidic amphipathic protein sequence that replaces the native basic region. The acidic amphipathic sequence from the D-N formed a heterodimeric coiled-coil with the basic region of the bZIP transcription factor, stabilizing the complex between 2.5 and 4.5 kcal⋅mol−1. The D-Ns are able to inhibit DNA binding of the bZIP protein in an equimolar competition (13, 15). We now have used a similar strategy to create D-Ns to the B-HLHZip family of transcription factors.
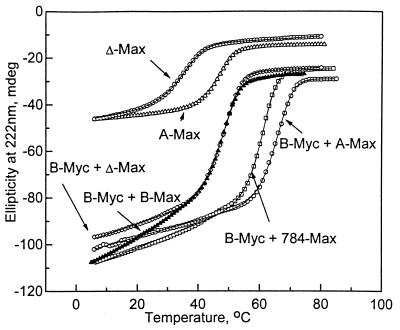
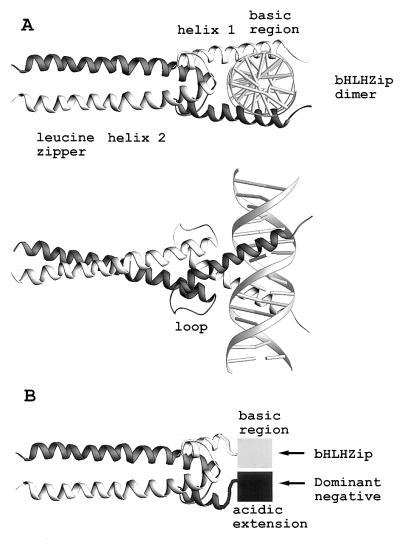
We first appended an acidic amphipathic extension onto the dimerization domain of Max. Deleting the basic region of Max (Δ-Max) did not affect the stability of either the homodimer or the heterodimer with B-Myc (Fig. 2; Table 1). There was a slight decrease in the ellipticity, which suggests that the deletion destroyed some α-helical structure. We wanted to append the acidic amphipathic helix onto helix 1 of the HLHZip domain that would interact with the basic region of the partner in the heterodimer (Fig. 3). However, because the optimum orientation of the acidic amphipathic protein sequence relative to helix 1 was unknown, we added it separately onto three consecutive amino acids in helix 1, producing molecules in which the putative amphipathic acidic α-helical structure was rotated 100, 200, and 300° relative to helix 1. If the amphipathic acidic helix was interacting with the basic region because of its amphipathic nature, we would expect that one orientation might be more stable than the other two. The acidic amphipathic extension in all three proteins (783-Max, 784-Max, and 785-Max) did stabilize the interaction with B-Myc. However, the level of stabilization was similar (from 3.9 to 5.6 kcal⋅mol−1) for all three orientations (Fig. 2; Table 1). The ellipticity of all three heterodimers at low temperatures also was similar to that for the B-Myc:B-Max heterodimer.
Figure 2.
CD thermal denaturation of B-Myc:B-Max heterodimer and B-Myc mixed with three potential D-Ns: Δ-Max, 784-Max, and A-Max.
Figure 3.
Structural schematic of A-Max. (A) A schematic of the crystal structure of dimeric Max B-HLHZip domain (4) bound to DNA seen from two views. The two monomers are presented in different shades of gray. (B) The bottom panel presents a schematic of a heterodimer between A-Max and B-Max. The structure of the acidic extension and the basic region is unknown and is presented as square shapes.
The similarity in the thermal stability of B-Myc mixed with the three D-Ns suggested that the critical aspect of the acidic amphipathic extension was the acidic, and not the amphipathic, property of the added sequence. To test for this, we appended a 12-amino acid acidic sequence (EEEDDEEELEELEDSF) onto helix 1 of HLHZip domain of Max. The resulting protein, A-Max, showed a remarkable increase in stability both as homodimer and as heterodimer with B-Myc (Fig. 2; Table 1). The B-Myc:A-Max heterodimer was 6.3 kcal⋅mol−1 more stable than B-Myc:B-Max heterodimer and in fact was more stable than heterodimers with previously designed acidic amphipathic extensions. The B-Myc:A-Max mixture had a lower CD amplitude at 222 nm than the B-Myc:784-Max or B-Myc:B-Max samples, which suggests that the increase in stability was not caused by an increase in α-helical structure as was observed with the D-Ns to bZIP proteins (13). Similar results were obtained with a protein containing 57 amino acids C-terminal of the B-HLHZip domain (A-Max-C). A schematic of the D-N interacting with the B-HLHZip domain is shown in Fig. 3B.
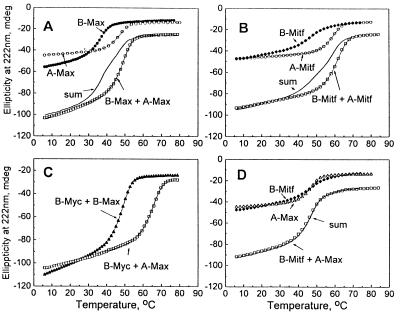
We tested the ability of the acidic extension to interact with the basic regions of two other B-HLHZip proteins, Max and Mitf, a member of the transcription factor enhancer binding subfamily of B-HLHZip proteins (3). A mixture of B-Max and A-Max was more stable than the B-Max homodimer (Fig. 4A; Table 1). The extra stability of 3.5 kcal⋅mol−1 must come from the interaction between the acidic extension of A-Max and the basic region of Max. Similarly, the acidic extension appended on helix 1 of Mitf (A-Mitf) helped to stabilize the heterodimer between this protein and the B-HLHZip domain of Mitf (B-Mitf) 3.7 kcal⋅mol−1 (Fig. 4B; Table 1). As a control for the specificity of the interaction, we mixed B-Mitf with A-Max (Fig. 4D). The sum line and the actual thermal denaturation were nearly superimposable, which suggests that these two proteins do not heterodimerize. This observation indicated that the interaction between the acidic extension and the basic region cannot overcome the incompatibility between the dimerization domains of Mitf and Max.
Figure 4.
The 12-amino acid acidic extension interacts with the basic regions from three B-HLHZip domains: CD thermal denaturations at 222 nm using B-Max, B-Mitf, and B-Myc. (A) B-Max (closed circles), A-Max (open circles), and their mixture (open squares). The fourth curve is the sum of the B-Max and A-Max curves, a curve that is expected if the two proteins do not interact. The fact that the mixture is more stable than the Sum curve indicates that B-Max and A-Max heterodimerize. (B) B-Mitf (closed diamonds), A-Mitf (open circles), and their mixture (open squares). The fourth curve is the sum of the B-Mitf and A-Mitf curves. (C) B-Myc:B-Max (closed triangles) and B-Myc + A-Max (open squares). (D) B-Mitf (closed diamonds), A-Max (open triangles), and their mixture (open squares). The fourth curve is the sum of the B-Mitf and A-Max curves. The sum curve and the actual mixture melt superimpose, indicating that the two proteins do not interact.
To elucidate the physical nature of the interaction between the acidic extension and the basic region, we compared the stability of A-Max:B-Myc and Δ-Max:B-Myc heterodimers at various salt conditions. (Table 2). At both high and low salt concentrations, A-Max and Δ-Max homodimers were significantly less stable than the mixtures of these proteins with B-Myc, which suggests that the melting curves of the mixtures represent the thermal dissociation of the heterodimers. The only structural difference between A-Max:B-Myc and Δ-Max:B-Myc heterodimers is the presence of the acidic extension at the N terminus of A-Max that interacts with the basic region of Myc and confers extra stability to the B-Myc:A-Max heterodimer. This interaction was enhanced in low salt (−8.8 kcal⋅mol−1 in 0 mM KCl as compared with −6.2 kcal mol−1 in 150 mM KCl) and shielded in high salt (−2.1 kcal⋅mol−1 in 2 M KCl), which suggests that the negatively charged acidic extension was electrostatically interacting with the positively charged basic region.
Table 2.
Salt dependence of the interaction between the Myc basic region and the acidic extension
| Conditions, KCl | B-Myc:A-Max heterodimer
|
B-Myc:Δ-Max heterodimer
|
Extra stability
|
||||
|---|---|---|---|---|---|---|---|
| Tm, °C | ΔH(Tm), kcal/mol | ΔG(37), kcal/mol | Tm, °C | ΔH(Tm), kcal/mol | ΔG(37), kcal/mol | ΔΔG(37), kcal/mol | |
| 0 M | 73.5 | −142 | −19.3 | 46.7 | −85.8 | −10.5 | −8.8 |
| 150 mM | 66.4 | −137 | −17.0 | 48.0 | −101 | −10.8 | −6.2 |
| 2 M | 64.9 | −126 | −16.3 | 60.7 | −108 | −14.2 | −2.1 |
| A-Max homodimer | Δ-Max homodimer | ||||||
| Tm | ΔH(Tm) | ΔG(37) | Tm | ΔH(Tm) | ΔG(37) | ||
| 0 M | 42.5 | −89 | −9.6 | 33.0 | −66 | −7.1 | |
| 150 mM | 46.7 | −109 | −10.7 | 34.6 | −77 | −7.0 | |
| 2 M | 56.6 | −116 | −13.9 | 51.3 | −102 | −12.0 | |
Inhibition of DNA Binding.
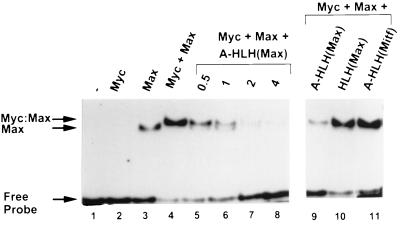
Gel shift experiments indicate that A-Max can inhibit Myc:Max DNA binding in an equimolar competition (Fig. 5). At a concentration of 10−9 M, B-Myc did not bind to a 22-bp double-stranded oligonucleotide containing an E-Box whereas B-Max was able to bind to DNA. The mixture of B-Myc and B-Max showed enhanced binding with a slightly decreased mobility. The addition of A-Max prevented the formation of B-Myc:B-Max complexes with DNA. When a 1-M equivalent of A-Max was added, B-Myc molecules in the sample were expected to preferentially heterodimerize with A-Max, leaving the remaining B-Max to homodimerize and generate a complex with a faster mobility as was, in fact, often observed. Two molar equivalents of A-Max abolished the DNA binding of both B-Myc:B-Max heterodimers and B-Max homodimers. The last three lanes of Fig. 5 document that both the acidic extension and the Max dimerization domain were critical to the inhibition of B-Myc:B-Max binding to DNA. The Max dimerization domain without the acidic extension (Δ-Max) was not effective at inhibiting Myc:Max DNA binding. Replacing the Max dimerization domain with the Mitf dimerization domain (A-Mitf) produced a protein that did not inhibit Myc:Max DNA binding (Fig. 5, lane 11) but did inhibit Mitf DNA binding (data not shown).
Figure 5.
A-Max abolishes DNA binding of B-Myc:B-Max heterodimer. (Left) A gel retardation assay using a 22-bp, double-stranded radioactive oligonucleotide (lane 1), B-Myc (lane 2), B-Max (lane 3), and B-Myc + B-Max (lane 4). Increasing molar equivalents of A-Max (lanes 5–8) inhibit B-Myc:B-Max DNA binding. Note the appearance of the band corresponding to the B-Max homodimer bound to DNA in lane 6. (Right) DNA binding of B-Myc:B-Max challenged by three potential D-Ns at four molar excess: A-Max (lane 9), Δ-Max (lane 10), and A-Mitf (lane 11). Only A-Max inhibits B-Myc:B-Max DNA binding.
Inhibition of Mitf Transactivation Properties.
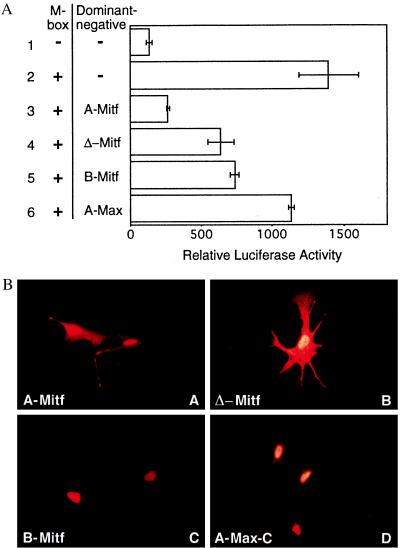
Transient transfection assays in a differentiated mouse melanocyte cell line, melan-c (16), expressing the transcription factor enhancer binding family member Mitf (3) were used to examine the efficiency of potential D-Ns to inactivating Mitf (Fig. 6A). A luciferase reporter gene containing four copies of an M-Box (-CATGTG-) appended to a minimal simian virus 40 promoter (18) was activated 10-fold compared with a similar reporter lacking M-Boxes in melan-c cells. Coexpression of the M Box reporter and A-Mitf, which consists of the acidic extension appended onto the Mitf dimerization domain, strongly inhibited the transactivation of the M-Box-containing reporter in a dose-dependent manner (data not shown). At an intermediate dose where A-Mitf inhibited the M-Box reporter to only 20% of full activation, expression of Δ-Mitf or B-Mitf resulted in 50% activity. A-Max was ineffective at inhibiting the reporter, which suggests that the endogenous transcription factor(s) that activate the reporter dimerize with Mitf but not Max. These data indicate that both the acidic extension and the Mitf dimerization domain were critical for effective D-N activity of A-Mitf.
Figure 6.
(A) A-Mitf inhibits transcription activity of the endogenous Mitf. A luciferase reporter gene controlled by four M Box DNA sequences is activated in melan-c melanocytes (bar 2) compared with the activation of a similar promoter lacking M-Boxes (bar 1). The acidic extension appended onto the dimerization domain, A-Mitf, totally abolished the activity (bar 3). The HLHZip domain (Δ-Mitf) inhibits the activity 50% (bar 4). The B-Mitf is similar to Δ-Mitf (bar 5). A-Max did not interfere appreciably with the transactivation (bar 6). (B) Intracellular accumulation of D-Ns and control proteins after transient transfection of melan-c cells. The proteins were tagged with a hemagglutinin epitope and revealed by double indirect immunofluorescence. A-Mitf (a) and Δ-Mitf (b) accumulate in nuclei and cytoplasm, and B-Mitf (c) and A-Max-C (d) accumulate predominantly in nuclei of cells.
Immunofluorescence identified the intracellular localization of transiently transfected A-Mitf, Δ-Mitf, B-Mitf, and A-Max, each tagged with the identical N-terminal hemagglutinin epitope (Fig. 6B). The assays showed that all proteins were strongly expressed. A-Mitf and Δ-Mitf accumulated in both the nucleus and cytoplasm. B-Mitf and A-Max-C accumulated primarily in the nuclei of cells. The deletion of the basic region in A-Mitf and Δ-Mitf removed the nuclear localization signals (22), which suggests that the nuclear staining of these two proteins occurs from random diffusion of the small proteins into the nucleus or from the dimerization with endogenous nuclear proteins.
Inhibition of Cellular Transformation.
The ability of the acidic extension to inhibit even more complex biological processes was tested using a focus assay in C3H10T1/2 fibroblasts. Expression of the oncogenic H-ras gene in C3H10T1/2 fibroblasts results in a modest level of focus formation that triples in the presence of Myc (Table 3) (19, 24). Expression of B-Max did not affect foci number. Expression of Δ-Max reduced focus formation to 80% of Ras + Myc controls whereas the addition of the acidic extension to create A-Max reduced focus formation further to 59%. Including 57 amino acids of the natural C terminus of Max increased the potency of the D-Ns, with Δ-Max-C producing 56% foci number and A-Max-C reducing focus formation further to 28%. A-Mitf only slightly reduced focus formation to 77%.
Table 3.
A-Max inhibits Myc-dependent transformation
| Groups | Relative focus formation |
|---|---|
| Ras | 0.34 |
| Ras + Myc | 1.00 |
| Ras + Myc + wt Max | 0.96 |
| Ras + Myc + Δ-Max | 0.80 |
| Ras + Myc + A-Max | 0.59 |
| Ras + Myc + Δ-Max-C | 0.56 |
| Ras + Myc + A-Max-C | 0.28 |
| Ras + Myc + A-Mitf | 0.77 |
C3H10T1/2 cells were transfected with expression vectors for the activated human H-ras oncogene (Ras) and the v-myc oncogene (Myc) (18, 23). A 3-fold molar excess (relative to Myc) of expression vectors for wild-type (wt) Max (pEMscribe Max) and potential D-Ns were added, and focus formation was assessed. A number of foci in each set of experiments was normalized to the number of foci in Ras + Myc plates to produce relative focus formation. Relative focus formation was averaged for five sets of experiments.
DISCUSSION
We have developed a method to produce D-Ns (24) to the B-HLHZip family of transcription factors. These D-Ns consist of the dimerization domain with a 12-amino acid acidic sequence replacing the basic region. The acidic extension interacts with the three basic regions examined, stabilizing the heterodimeric complex 3.5–6.3 kcal mol−1. DNA binding assays indicate that a 1-M equivalent of A-Max can abolish the DNA binding of a Myc:Max heterodimer. In both transactivation and transformation assays, the addition of the acidic extension on the HLHZip dimerization domain produced more robust D-Ns than either the HLHZip or B-HLHZip domains.
The interaction between the acidic extension and the basic region is salt-dependent. It was found to be stronger in low salt and shielded in high salt, which argues that the interaction is mainly electrostatic. A close monitoring of the absolute ellipticity measurements indicates that the B-Myc:A-Max heterodimer has slightly less ellipticity than the B-Myc:B-Max heterodimer but is 6.3 kcal⋅mol−1 more stable. This suggests that there is no change in the secondary structure accompanying the association between the acidic extension and the basic region. This is in contrast to D-Ns engineered to interact with the bZIP family of transcription factors (13), where an acidic amphipathic extension of the dimerization domain forms a coiled-coil structure with the basic region.
Several natural examples of D-Ns to B-HLHZip proteins have been described, including a particular spliced version of transcription factor enhancer binding 3 whose activation domain is deleted (25) and Id (26), a protein that appears to regulate multimerization with MyoD via an unknown structural mechanism and thus prevent DNA binding (27). Unfortunately, current understanding of the oligomerization of Id and MyoD is not sufficient to allow the design of additional D-Ns that inhibit the DNA binding of other B-HLHZip proteins. Previously, D-Ns have been built to Max that consist of a deletion within the basic region (28, 29). Our work indicates that replacing the basic region with an acidic region produced a more potent D-N. Because naturally occurring deletions of the basic region and helix 1 have D-N properties, a more thorough biophysical characterization of these molecules is needed (30).
The ability of the described D-Ns to inhibit DNA binding of B-HLHZip proteins in a dimerization specific manner can be used to explore several biological issues. Initially, they could be used to inhibit factor-specific activation of transcription in a dimerization-specific manner. Second, these D-Ns displace proteins from DNA, allowing for the exploration of B-HLHZip proteins whose function on particular promoters is repressive. The reagents described here should help unravel these possibilities. Third, because these reagents also appear to work in the living cell, their mode of action could be monitored by in vivo footprinting techniques (31).
Acknowledgments
We thank G. Prendergast and R. Eisenman for the mouse and human Max DNA, R. DePinho for the Myc DNA, and J. Moitra and A. Goldman for their comments on the manuscript. This work was supported by American Cancer Society Grant NP-924 to E.J.T. D.E. is supported by DAMD17–94-J-4037.
ABBREVIATIONS
- D-N
dominant negative
- CD
circular dichroism
References
- 1.Murre C, McCaw P, Baltimore D. Cell. 1989;56:777–783. doi: 10.1016/0092-8674(89)90682-x. [DOI] [PubMed] [Google Scholar]
- 2.Henriksson M, Luscher B. Adv Cancer Res. 1996;68:109–182. doi: 10.1016/s0065-230x(08)60353-x. [DOI] [PubMed] [Google Scholar]
- 3.Hodgkinson C A, Moore K J, Nakayama A, Steingrimsson E, Copeland N G, Jenkins N A, Arnheiter H. Cell. 1993;74:395–404. doi: 10.1016/0092-8674(93)90429-t. [DOI] [PubMed] [Google Scholar]
- 4.Ferre-D’Amare A, Prendergast G, Ziff E, Burley S. Nature (London) 1993;363:38–44. doi: 10.1038/363038a0. [DOI] [PubMed] [Google Scholar]
- 5.Ellenberger T, Fass D, Arnaud M, Harrison S. Genes Dev. 1994;8:970–980. doi: 10.1101/gad.8.8.970. [DOI] [PubMed] [Google Scholar]
- 6.Ferre-D’Amare A, Pognonnec P, Roeder R, Burley S. EMBO J. 1994;13:180–189. doi: 10.1002/j.1460-2075.1994.tb06247.x. [DOI] [PMC free article] [PubMed] [Google Scholar]
- 7.Clark A, Docherty K. Biochem J. 1993;296:521–541. doi: 10.1042/bj2960521. [DOI] [PMC free article] [PubMed] [Google Scholar]
- 8.MacGregor D, Li L, Ziff E. J Cell Physiol. 1996;167:95–105. doi: 10.1002/(SICI)1097-4652(199604)167:1<95::AID-JCP11>3.0.CO;2-O. [DOI] [PubMed] [Google Scholar]
- 9.Kim J, Spiegelman B. Genes Dev. 1996;10:1096–1107. doi: 10.1101/gad.10.9.1096. [DOI] [PubMed] [Google Scholar]
- 10.Studier F W, Moffatt B A. J Mol Biol. 1986;189:113–130. doi: 10.1016/0022-2836(86)90385-2. [DOI] [PubMed] [Google Scholar]
- 11.Stanton L, Fahrlander P, Tesser P, Marcu K. Nature (London) 1984;310:423–425. doi: 10.1038/310423a0. [DOI] [PubMed] [Google Scholar]
- 12.Blackwood E, Eisenman R. Science. 1991;251:1221–1227. doi: 10.1126/science.2006410. [DOI] [PubMed] [Google Scholar]
- 13.Krylov D, Olive M, Vinson C. EMBO J. 1995;14:5329–5337. doi: 10.1002/j.1460-2075.1995.tb00217.x. [DOI] [PMC free article] [PubMed] [Google Scholar]
- 14.Krylov D, Mikhailenko I, Vinson C. EMBO J. 1994;13:1849–1861. doi: 10.1002/j.1460-2075.1994.tb06579.x. [DOI] [PMC free article] [PubMed] [Google Scholar]
- 15.Olive M, Krylov D, Echlin D R, Gardner K, Taparowsky E, Vinson C. J Biol Chem. 1997;272:18586–18594. doi: 10.1074/jbc.272.30.18586. [DOI] [PubMed] [Google Scholar]
- 16.Bennet D, Cooper P, Dexter T, Devlin L, Heasman J, Nester B. Development. 1989;105:379–385. doi: 10.1242/dev.105.2.379. [DOI] [PubMed] [Google Scholar]
- 17.Hemesath T J, Steingrimsson E, McGill G, Hansen M J, Vaught J, Hodgkinson C A, Arnheiter H, Copeland N G, Jenkins N A, Fisher D E. Genes Dev. 1994;8:2770–2780. doi: 10.1101/gad.8.22.2770. [DOI] [PubMed] [Google Scholar]
- 18.Taparowsky E J, Heaney M L, Parsons J T. Cancer Res. 1987;47:4125–4129. [PubMed] [Google Scholar]
- 19.Taparowsky E, Suard Y, Fasano O, Shimizu K, Goldfarb M, Wigler M. Nature (London) 1982;300:762–765. doi: 10.1038/300762a0. [DOI] [PubMed] [Google Scholar]
- 20.Littlewood T, Evan G. Protein Profile. 1994;1:639–709. [PubMed] [Google Scholar]
- 21.Woody R, Tinoco I. J Chem Phys. 1967;46:4927–4945. [Google Scholar]
- 22.Takebayashi K, Chida K, Tsukamoto I, Morii E, Munakata H, Arnheiter H, Kuroki T, Kitamura Y, Nomura S. Mol Cell Biol. 1996;16:1203–1211. doi: 10.1128/mcb.16.3.1203. [DOI] [PMC free article] [PubMed] [Google Scholar]
- 23.Davenport E, Taparowsky E. Exp Cell Res. 1992;202:532–540. doi: 10.1016/0014-4827(92)90108-k. [DOI] [PubMed] [Google Scholar]
- 24.Herskowitz I. Nature (London) 1987;329:219–222. doi: 10.1038/329219a0. [DOI] [PubMed] [Google Scholar]
- 25.Roman C, Cohn L, Calame K. Science. 1991;254:94–97. doi: 10.1126/science.1840705. [DOI] [PubMed] [Google Scholar]
- 26.Benezra R, Davis R, Lockshon D, Turner D, Weintraub H. Cell. 1990;61:49–59. doi: 10.1016/0092-8674(90)90214-y. [DOI] [PubMed] [Google Scholar]
- 27.Fairman R, Beran-Steed R, Anthony-Cahill S, Lear J, Stafford W, DeGrado W, Benfield P, Brenner S. Proc Natl Acad Sci USA. 1993;90:10429–10433. doi: 10.1073/pnas.90.22.10429. [DOI] [PMC free article] [PubMed] [Google Scholar]
- 28.Billaud M, Isselbacher K, Bernards R. Proc Natl Acad Sci USA. 1993;90:2739–2743. doi: 10.1073/pnas.90.7.2739. [DOI] [PMC free article] [PubMed] [Google Scholar]
- 29.Reddy C, Dasgupta P, Saikumar P, Dudek H, Rauscher F, Reddy E. Oncogene. 1992;7:2085–2092. [PubMed] [Google Scholar]
- 30.Arsura M, Deshpande A, Hann S, Sonenshein G. Mol Cell Biol. 1995;15:6702–6709. doi: 10.1128/mcb.15.12.6702. [DOI] [PMC free article] [PubMed] [Google Scholar]
- 31.Mueller P, Wold B. Science. 1989;246:780–786. doi: 10.1126/science.2814500. [DOI] [PubMed] [Google Scholar]


