Abstract
Dissection of the primary and secondary response to an influenza A virus established that the liver contains a substantial population of CD8+ T cells specific for the immunodominant epitope formed by H-2Db and the influenza virus nucleoprotein peptide fragment NP366–374 (DbNP366). The numbers of CD8+ DbNP366+ cells in the liver reflected the magnitude of the inflammatory process in the pneumonic lung, though replication of this influenza virus is limited to the respiratory tract. Analysis of surface phenotypes indicated that the liver CD8+ DbNP366+ cells tended to be more “activated” than the set recovered from lymphoid tissue but generally less so than those from the lung. The distinguishing characteristic of the lymphocytes from the liver was that the prevalence of the CD8+ DbNP366+ set was always much higher than the percentage of CD8+ T cells that could be induced to synthesize interferon γ after short-term, in vitro stimulation with the NP366–374 peptide, whereas these values were generally comparable for virus-specific CD8+ T cells recovered from other tissue sites. Also, the numbers of apoptotic CD8+ T cells were higher in the liver. The results overall are consistent with the idea that antigen-specific CD8+ T cells are destroyed in the liver during the control and resolution phases of this viral infection, though this destruction is not necessarily an immediate process.
The quantitative dissection of virus-specific CD8+ T cell-mediated immunity (1) has been revolutionized by a new technology, the development of tetrameric complexes of major histocompatibility complex class I glycoprotein and viral peptide for the direct flow-cytometric staining of responding lymphocyte populations (2–6). Similar fluorescence-activated cell-sorter profiles (3, 4) are found for virus-specific CD8+ T cells after in vitro stimulation for 6 h with viral peptide in the presence of brefeldin A (to block protein secretion), fixation, and staining for intracellular interferon γ (IFN-γ). These flow-cytometric approaches show that the numbers of virus-specific precursor and effector cytotoxic T lymphocytes (CTL) generated during the control of an acute infectious process are 10- to 100-fold greater than indicated by limiting dilution analysis, a protocol that requires the T cells to undergo at least 10–11 cycles of replication in microculture wells before assay for effector-CTL function (1, 3, 4, 7). Furthermore, the long-term prevalence of memory CD8+ CTL is also 5–10 times higher than that measured by limiting dilution analysis (1, 3, 4).
The pneumonia caused by the respiratory exposure of C57BL/6J (B6) mice to an H3N2 influenza A virus (8) has been analyzed with both the tetramer and IFN-γ-staining approaches (4). This analysis showed that as many as 12.5% of the CD8+ set recovered by bronchoalveolar lavage (BAL) from the virus-infected lung are specific for the immunodominant viral nucleoprotein (NP366–374) peptide presented by the H-2Db major histocompatibility complex class I glycoprotein (DbNP366). This frequency increases to >70% after the intranasal (i.n.) H3N2 challenge of mice that have first been primed with a serologically non-cross-reactive H1N1 virus that shares the internal NP366–374 epitope (9, 10). Infectious H3N2 virus can be recovered from the lung only up to 11 or 8 days after the primary or secondary challenge, respectively. Infectious H3N2 virus is never detected in distal sites, such as the spleen, liver, or kidney (8, 11, 12).
The high prevalence of virus-specific CD8+ T cells detected in mice with influenza pneumonia, together with comparable findings for lymphocytic choriomeningitis virus, highlights the question of the fate of these very large effector- and precursor-CTL populations (3, 4). Earlier studies with superantigens and with antigen-driven responses in mice that are transgenic for an appropriate T cell receptor (TCR) α and β chain indicated that many, if not all, of the responding effector CTL are eliminated in anatomically defined “grave-yards” (13, 14). These graveyards are located particularly in the gastrointestinal mucosa and the liver, though there is also evidence that the lung and the kidney may be involved (15). Similar experiments suggested the contrary—that this editing of the antigen-specific set occurs predominantly in the responding lymphoid tissue (16).
The correlation between CD8+ T cell phenotype and functional status (17) is explored here for the control and resolution phases of primary and secondary influenza pneumonia. The CD8+ T cell populations that bind the DbNP366 tetramer are compared for the site of pathology (BAL and lung), for the lymphoid tissue (spleen), and for the potential focus of elimination in the liver.
MATERIALS AND METHODS
Animals and Virus Infection.
Specific pathogen-free, female B6 mice were purchased from The Jackson Laboratory. They were anesthetized at 8–10 weeks of age by i.p. injection with avertin (2,2,2-tribromoethanol). They were then infected either i.n. with 30 μl of PBS containing 106.8 egg 50% infective dose units of the A/HKx31 (HKx31, H3N2) influenza A virus to analyze the primary response or i.p. with 108.5 egg 50% infective dose units of the A/PR8/34 (PR8, H1N1) influenza A virus to establish CD8+ T cell memory (8). The HKx31 virus is a laboratory strain that shares the internal components of PR8 but has serologically distinct hemagglutinin (H) and neuraminidase (N) surface glycoproteins (9). The PR8-immune mice were held for at least 2 months before receiving a secondary i.n. challenge, as above, with the HKx31 virus.
Tissue Sampling and Perfusion.
The mice were anesthetized and exsanguinated from the axillary artery. Inflammatory cells were obtained (8) from the lung by BAL, and the adherent cells, which are principally monocyte/macrophages, were removed by adsorption on plastic Petri dishes (Falcon) for 60 min at 37°C. Mononuclear cells were isolated from heparinized blood by ammonium chloride lysis of erythrocytes. Single-cell suspensions were depleted of erythrocytes by hypotonic lysis, then enriched for the CD8+ set by treatment (10) with mAbs to CD4 (GK 1.5) and major histocompatibility complex class II glycoproteins (M5/114.15.2), followed by sheep anti-mouse and sheep anti-rat Dynabeads (Dynal, Oslo). After sampling the blood, BAL, and spleen, the livers, kidneys, and lungs were perfused in situ via the left, then the right ventricle, giving a total of 40–50 ml of PBS to remove the intravascular blood pool. The inferior vena cava was cut to allow outflow. Samples of lung and liver were excised, rinsed in PBS, and forced through a fine stainless-steel mesh before gentle digestion with collagenase (Sigma). The cell populations were filtered twice before the digestion process with 100-μm mesh strainers (Becton Dickinson). They were then washed with 40 ml of Click’s Eagle–Hanks’ amino acid medium (Click’s medium) and incubated for 30 min at 37°C in 20 ml of Click’s medium containing 50 units/ml collagenase IV and 0.001% DNase I (Sigma; ref 13). The digested cell suspensions were washed once in 40 ml of Click’s medium and resuspended in Hank’s balanced salt solution containing 1% BSA, and then erythrocytes were lysed. The cells were washed and resuspended in Click’s medium, and lymphocytes were isolated by density centrifugation over 30% metrizamide/PBS (13). The final cell populations were pooled from six mice.
Phenotyping Virus-Specific CD8+ T Cells.
Single-cell suspensions of lymphocytes were stained (18) in PBS containing 1% BSA and 0.02% sodium azide (stain buffer) with antibodies purchased from PharMingen. Binding to Fc receptors was blocked with anti-CD16/CD32 (FcγIII/II receptor; PharMingen). The various lymphocytes subsets were characterized by using conjugated mAbs (PharMingen) to CD4 (H129–19), CD8 (53–6.7), CD45/B220 (RA3–6b2), LFA-1 (2D7), CD44 (IM7), CD49d (VLA-4), CD62L (MEL-14), CD69 (H1.2F3), CD122 (IL-2Rβ), and CD152 (9H10). Influenza virus-specific CD8+ T cells were stained with the DbNP366 tetramer, and the Sendai virus DbNP324 tetramer was used as a control. The specificity of tetramer staining was confirmed by using virus-specific hybridoma T cell lines (4, 19, 20) and lymphocytes obtained by BAL (9). Cell viability was estimated by flow cytometry after staining with propidium iodide (5 μg/ml) 10 min before examination to detect dead cells. Stained cells were analyzed in two- or three-color mode on a fluorescence-activated cell sorter (FACScan with cellquest software; Becton Dickinson).
Stimulation with Influenza Virus Peptides.
The H-2Db restricted influenza A nucleoprotein NP366–374 (ASNENMETM; ref. 21) peptide was synthesized at the Center for Biotechnology, St. Jude Children’s Research Hospital by using a Perkin—Elmer 433A peptide synthesizer and purified by HPLC. The lymphocytes were cultured for 6 h in 96-well round-bottom plates (Corning) at a concentration of 5–8 × 10⁵ cells per well in 200 μl of RPMI medium 1640 containing 10% fetal calf serum, 50 units/ml human recombinant IL-2, and 5 μg/ml brefeldin A (Epicentre Technologies, Madison, WI) in the presence or absence of 1 μM of the viral peptides NP366–374 or 50 μg/ml anti-mouse CD3ɛ (145–2C11, PharMingen). After being cultured, the cells were washed once in stain buffer/brefeldin A (5 μg/ml), blocked with mAb to FcγIII/II, and stained with rat anti-mouse CD8-fluorescein isothiocyanate (53–6.7) antibody. They were then washed twice in PBS/brefeldin A, fixed in 1% formaldehyde in PBS for 20 min, washed in PBS, placed in PBS/0.5% saponin (Sigma) for 10 min then incubated with phycoerythrin-conjugated rat anti-mouse IFN-γ-E (XMG 1.2) or an isotype control (rat IgG1). Specificity of the staining was determined initially by blocking with excess purified cytokines. In some assays of lymphocyte populations obtained from the liver, EL4 (H-2b) cells were added to the culture wells to ensure that the responder profiles were not influenced by a lack of antigen-presenting cells. Flow cytometry readily distinguishes lymphocytes from EL4 cells by their forward and side-scatter characteristics. In each assay, the percentage of IFN-γ+ without specific peptide (<0.5) or the percentage of staining with the tetrameric complex of H-2Db/Sendai virus NP324–332 peptide (<0.3) from the CD8+ lymphocytes was subtracted from the percentage of IFN-γ+ with peptide or DbNP366 tetramer, respectively, to give the percentage of specific staining.
Terminal Deoxynucleotidyltransferase (TdT)-Mediated UTP-End-Labeling (TUNEL) Assay.
Evidence of DNA fragmentation was detected by using the end-labeling method (22). Briefly, after surface staining, 4 × 10⁶ lymphocytes were washed twice in PBS and fixed with 1% paraformaldehyde in PBS for 15 min on ice, followed by another wash in PBS, fixation in 70% ethanol, and storage at −20°C. The cells were then washed twice in PBS and incubated in the presence or absence of 0.25 unit/μl TdT (Boehringer Mannheim) and digoxigenin-11-dUTP at 37°C for 30 min. After washing in PBS, the cells were incubated for 30 min with fluorescein isothiocyanate-conjugated anti-digoxigenin-11-dUTP (Boehringer Mannheim). Jurkat cells exposed to etoposide (Sigma) for 6 h and thymocytes treated with 10−11 M dexamethasone (Sigma) for 18 h were used as positive controls.
RESULTS
Localization of the Virus-Specific CD8+ T Cells.
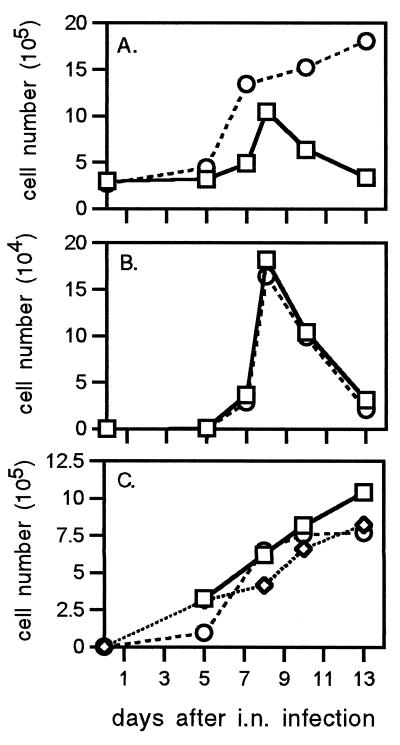
The characteristics of the virus-specific CD8+ T cell response in the BAL and spleen of B6 mice with primary and secondary influenza pneumonia have been described (4), but there has been no analysis of the situation in the liver. The numbers of CD8+ T cells recovered from perfused, collagenase-digested liver were calculated from the total cell counts and the percentage of staining by flow cytometry (data not shown) for naive and H1N1-primed mice challenged i.n. with the H3N2 virus (Fig. 1A). More CD8+ T lymphocytes were present in the liver during the secondary than the primary response, reflecting the difference in magnitude of the inflammatory responses described (4) for the BAL. However, the relative distribution of the two major lymphocyte subsets differs for these two anatomical sites; the CD4+ and CD8+ T cells each ranged between 18% and 28% of the total lymphocyte pool recovered from the livers of mice with influenza pneumonia, whereas the BAL CD8+ population is always 2- to 4-fold more prevalent (8, 10, 12). This distribution could reflect the fact that the process of lymphocyte localization to (or retention in) the liver is much more random.
Figure 1.
(A) Total CD8+ T cells isolated from the liver during primary and secondary influenza-virus infection. Naïve (□, HKx31, primary) and PR8-immune (○, HKx31 → PR8, secondary) B6 mice were infected with the HKx31 virus, and the lymphocytes were isolated from liver after collagenase IV digestion and separation by 30% metrizamide. (B and C) Mononuclear cells were counted after staining by trypan blue (1%) exclusion with a hemocytometer. Flow-cytometric analysis of CD8+ DbNP366+ T cells recovered from BAL, lung, and liver during primary (HKx31; B) and secondary (HKx31 213 → PR8; C) viral infection. Cells were pooled from six mice for each time point, and the mean numbers of each cell type per mouse were derived from the total cell counts and the proportions stained specifically by flow cytometry. In PR8-immune animals, 800 CD8+ DbNP366+ T cells were isolated from lungs at day 0 of HKx31 infection, 64 days after i.p. priming with 108.5 egg 50% infective dose units of the PR8 virus. No influenza virus-specific CD8+ T cells were detectable in liver at day 0 of the primary or secondary infection. Each point shows the mean of one to four determinations. □, BAL; ◊, lung; ○, liver.
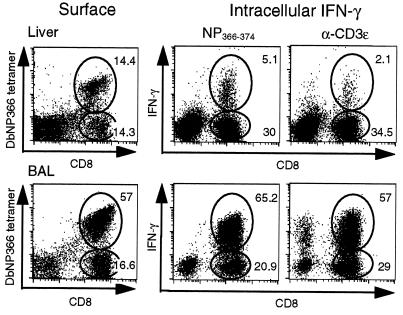
The NP366–374 specific CD8+ set was as readily detected in the liver as in the BAL (Fig. 2, Left). Calculating virus-specific CD8+ T cell numbers from the percentage of CD8+ DbNP366+ and the total lymphocyte counts indicated a remarkable similarity in localization profiles for the BAL and liver during the primary response (Fig. 1B), although, of course, the efficiency of recovery is likely to be much higher after a simple lung lavage than after the more complex procedure used to separate lymphocytes from solid tissue. The peak counts for the virus-specific CD8+ DbNP366+ set were >4-fold enhanced for the secondary response and remained at a high level for longer (Fig. 1C). The numbers of virus-specific CD8+ T cells isolated from lavaged, collagenase-digested, perfused lung were somewhat lower than those from the liver. However, no great significance can be attached to this difference, because the efficiency of lymphocyte recovery from the lung is low (23). The analysis with the lung-derived cells was done only to control for the possible effects of the digestion procedure on lymphocyte function and phenotype (see below).
Figure 2.
Comparison of influenza virus-specific DbNP366 tetramer staining of CD8+ T cells and the NP peptide-specific response (IFN-γ) of liver (Upper) and BAL (Lower) and lymphocytes isolated 10 days after i.n. infection of PR8-immune mice with HKx31. Lymphocytes were pooled from six mice, then stained with anti-CD8 and DbNP366 tetramer and analyzed by flow cytometry (Left) or cultured for 6 h in complete medium/brefeldin A in the presence or absence of the NP peptide (Center) or anti-CD3ɛ (Right), then stained for surface CD8 and intracellular IFN-γ. For samples incubated without peptide, IFN-γ staining was <0.2%. The numbers give the percentage of gated lymphocytes stained. The total CD8+ and CD8+ DbNP366+ populations recovered from the liver were found to be uniformly CD3ɛ+ in other experiments (data not shown).
Thus, the recruitment of virus-specific CD8+ T cells to the liver of mice with primary and secondary influenza pneumonia is not greatly different from the pattern found for the site of inflammatory pathology in the lung (Figs. 1 and 2). Though the profile in the lung is likely to be determined by the extensive virus replication that occurs in the respiratory epithelium, the HKx31 influenza A virus used for both the primary and secondary challenge is not known to replicate in or localize to the liver. The obvious question is whether the CD8+ DbNP366+ T cell populations recovered from the liver and the lung are the same or different.
Cell-Surface Phenotype of the Virus-Specific CD8+ T Cells.
Previous analysis of T cells recovered by collagenase digestion of the liver has indicated more varied levels of both CD8 and TCR expression than those customarily associated with normal lymphoid tissue (17, 24). Though we do not present the data here, we found that both the total CD8+ population and the CD8+ DbNP366+ set were uniformly CD8+ TCRβ+ CD3ɛ+. They tended, however, to be TCRlow CD8low, a phenotype more comparable to that found in the spleen than in the BAL. There was, however, no evidence for the presence of a significant CD8+ TCR− set (data not shown), as described for experiments with nonviral systems (14).
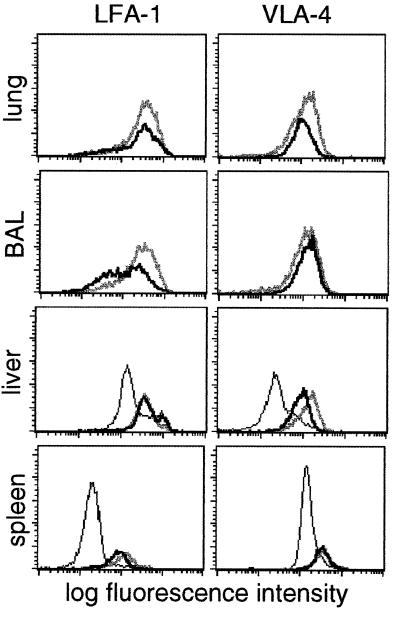
A number of cell-surface glycoproteins are known to influence the localization patterns of T lymphocytes. The CD8+ DbNP366+ T cells detected in all sites from mice with influenza pneumonia were consistently CD44high, and the great majority were CD62Llow (data not shown), the characteristic phenotype of the effector-CTL and recently generated memory-CTL populations (18, 25, 26). The total CD8+ population recovered from the livers of uninfected mice normally contains more LFA-1high and VLA-4high cells than the spleen, indicating that there is a tendency for “activated” CD8+ T cells to localize to the liver (Fig. 3). The levels of LFA-1 and VLA-4 were generally high on the CD8+ DbNP366+ set isolated from the lung, BAL, liver, and spleen (27, 28) 8 days after secondary challenge, with a tendency for the amount of VLA-4 to fall by day 13 in all tissues but not the BAL (Fig. 3).
Figure 3.
Expression of LFA-1 and VLA-4 on CD8+ DbNP366+ T cells during secondary influenza infection. Flow-cytometric analysis of cells within a CD8+ lymphocyte gate isolated from lung, BAL, liver, and spleen is shown for total CD8+ T cells on day 0 (thin line), and for the CD8+ DbNP366+ set on day 8 (thick gray line) and day 13 (thick black line) after i.n. challenge of PR8-immune mice with the HKx31 virus.
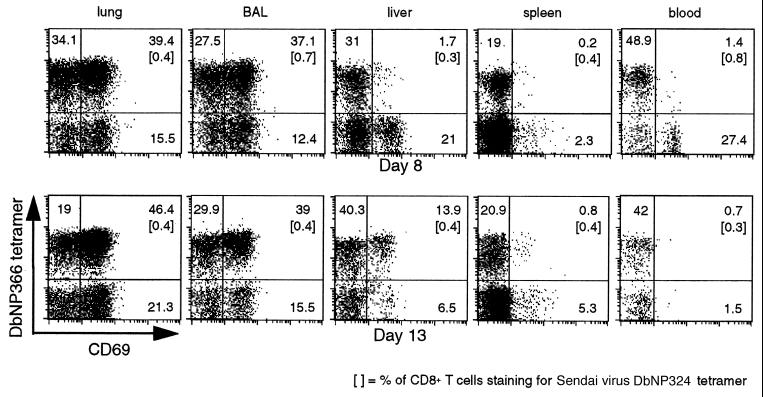
In general, staining the CD8+ DbNP366+ set for levels of CD8, the clonotypic TCR (data not shown), LFA-1, and VLA-4 indicates that the population recovered from the liver is more comparable to that in the spleen than in the BAL or the lung (Fig. 3). The same was true for the early activation marker, CD69 (29), when the lymphocytes were analyzed 8 days after secondary challenge; the profiles in the liver and spleen reflected those in the blood rather than in the BAL or lung (Fig. 4, day 8). However, by day 13, the relative prevalence of CD69high cells had increased for the CD8+ DbNP366+ set in the liver but not in the spleen or in the blood (Fig. 4, day 13). This fact suggests that at least a proportion of the inflammatory CD8+ DbNP366+ CD69high T cells are exiting the lung after the resolution of the infectious process and are being rapidly and selectively (compared with the spleen) removed from the blood by the liver.
Figure 4.
The CD8+ DbNP366+ T cells isolated from different anatomical sites express varying levels of the CD69 “early activation” marker. Mononuclear cells were recovered from the lung, BAL, liver, spleen, and blood 8 and 13 days after HKx31 challenge of B6 mice primed i.p. with the PR8 virus 72 days earlier. The numbers given show the percentage of CD8+ T cells in the lymphocyte gate (forward-light scatter vs. side-scatter characteristics) within the respective quadrants. Lymphocytes from BAL and liver were pooled from six mice at each time point.
Functional Status of the CD8+ DbNP366+ Set.
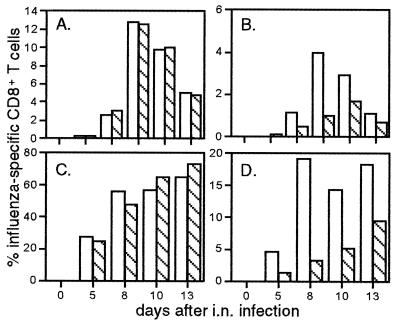
The phenotyping experiments (Figs. 3 and 4) indicated that there was nothing unusual about the virus-specific CD8+ population recovered from the liver. Experiments with the influenza model have established that the percentage of CD8+ T cells that express the DbNP366 tetramer is essentially identical to the percentage of staining for IFN-γ after stimulation with the NP366–374 peptide in the presence of brefeldin A. Comparison of these two parameters for CD8+ T cells recovered from the BAL and liver showed, however, that although this comparability was maintained for the CD8+ DbNP366+ set from the BAL, the functional status of many of the liver T cells was compromised severely (Fig. 2). This defect was apparent for the virus-specific T cells stimulated with the immunodominant NP366–374 peptide and for the total CD8+ population after cross-linking CD3ɛ with the 2C11 mAb (Fig. 2). The CD8+ DbNP366+ T cells from the spleen and the collagenase-digested lung behaved like those in the BAL, so the lack of responsiveness was not a consequence of damage during the tissue processing (Table 1). Kinetic analysis indicated that the defect was least apparent in the late stages (day 13) of both the primary and the secondary response (Fig. 5). In both cases, this is long after the virus has been eliminated from the lung. The only other situation in which this divergence between tetramer and IFN-γ staining profiles has been described is for the “immune exhaustion” that follows exposure to a very high dose of lymphocytic choriomeningitis virus (30).
Table 1.
Comparison of tetramer staining and IFN-γ response profiles for different tissues
| Tissue | Percentage of CD8+ T cells
|
|||
|---|---|---|---|---|
| Day 8 primary
|
Day 8 secondary
|
|||
| DbNP366 | IFN-γ | DbNP366 | IFN-γ | |
| Liver | 12.4 | 7.7 | 53.1 | 8.4 |
| BAL | 12.6 | 11.7 | 72.7 | 65 |
| Lung | 16.5 | 16.4 | 64.2 | 60 |
| Spleen | 1.3 | 1.1 | 24 | 18 |
| Kidney | <0.1 | — | <0.1 | — |
Figure 5.
The percentage of CD8+ T cells staining for DbNP366 (open bars) or for IFN-γ after peptide stimulation (hatched bars) are shown for the primary (A and B) and secondary (C and D) responses in the BAL (A and C) and liver (B and D). Flow-cytometric analysis showing secondary data for a single time point is presented in Fig. 2.
Evidence of Cell Death.
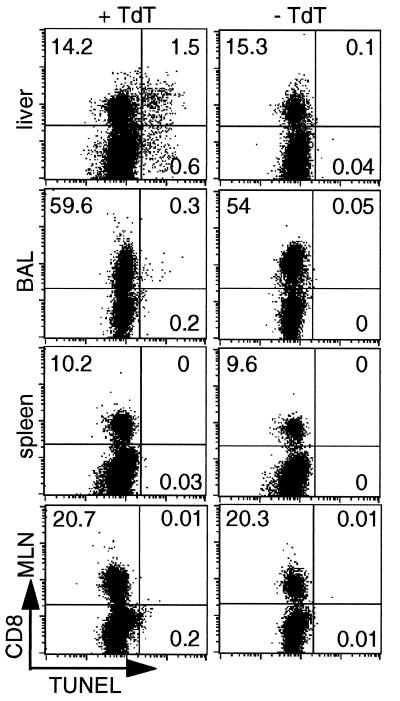
An earlier study of the BAL, spleen, and lymph nodes completed before the DbNP366 tetramer became available showed relatively few TUNEL-positive TdT+ CD8+ cells during the course of either the primary or secondary response to the influenza viruses. The maximum value (1.15%) was found in the BAL. The prevalence of TdT+ CD8+ cells was much higher in the liver than in any of the other sites assayed (Fig. 6). Furthermore, both isolated TdT+ CD8+ cells and focal accumulations could be detected by immunocytochemical staining of the liver parenchyma; these accumulations were most apparent in mice with secondary influenza pneumonia (data not shown). However, there were also many TdT− CD8+ lymphocytes in these sections of perfused liver.
Figure 6.
Apoptosis of CD8+ lymphocytes in peripheral tissues. Lymphocytes isolated from liver, BAL, spleen, and mediastinal lymph nodes were analyzed by flow cytometry for CD8 expression and DNA fragmentation (TUNEL assay) 10 days after infection of naïve mice with HKx31 influenza virus. TUNEL staining (+ TdT, Left) and negative control staining (− TdT, Right) are shown for each tissue. The percentages represent the proportion of cells analyzed in a lymphocyte gate found in each quadrant respectively (forward-light scatter vs. side-scatter characteristics).
DISCUSSION
The involvement of the liver in the fate of a conventionally antigen-specific CD8+ T cell population has been analyzed in normal mice throughout the course of a specific host response to a pathogen, an approach that has only recently become possible with the development of the tetramer technology (2–7). A previous study of the consequences of stimulating TCRαβ-transgenic mice with the influenza NP peptide (ASNENMDAM) expressed in the NT60 influenza A virus showed an increase in the prevalence of apoptotic T cells in the liver, lung, and most strikingly, the kidney (15). This observation contrasts with the finding that, subsequent to the administration of an ovalbumin peptide to mice transgenic for a cognate TCR, most of the apoptotic CD8+ T cells were found in the lymphoid tissue, with little involvement of the liver (16). Neither set of experiments reflected what we found here for normal B6 mice infected with the HKx31 influenza A virus, despite the generation of very substantial numbers of CD8+ DbNP366+ T cells, particularly in the secondary response. In fact, TCR-transgenic mice may be too abnormal to allow any useful analysis of lymphocyte homeostasis. The present results are most like those found for conventional mice exposed to bacterial superantigens (13).
The localization kinetics of the CD8+ DbNP366+ T cells to the BAL and liver were remarkably similar, particularly for the primary response. This profile is not what would be expected for the elimination of effect or for exhausted cells late in the course of a disease (14). Previous analysis has established that that the influenza-specific CD8+ T cells develop first in the lymphoid tissue, principally in the mediastinal lymph nodes (1, 8, 12, 18). The precursor CTL must then extravasate from the blood before they can access the lung or any other somatic tissue. The BAL and liver localization profiles suggest that exiting from the blood, though it will obviously be influenced by the expression of various adhesion molecules and their ligands on both the lymphocytes and endothelium (26–29), is essentially a stochastic process, with the antigen-specific T cells being as likely to enter the liver as the lung. The difference between these two sites is that there are high levels of antigen in the influenza-infected respiratory tract, whereas there is little, if any, virus in the liver (refs. 8 and 11; unpublished results).
The question then becomes whether it is lack of antigen or the micro-environment of the liver that tends to drive the liver T cells toward dysfunction (measured by the failure to make IFN-γ) and apoptosis. Diminished IFN-γ production is a more sensitive measure of functional impairment than loss of cytotoxic activity (31). As such, 51Cr release assays were not done, because they require substantial numbers of cells, and lymphocyte availability was a constraint in these experiments. We have not been able to detect virus in the spleens of mice infected with the HKx31 influenza A virus (refs. 8 and 11; unpublished results), but the CD8+ DbNP366+ set in the spleen shows little evidence of apoptosis. We conclude, based on this and previous analyses, that generally CD8+ DbNP366+ cells in the spleen are able to synthesize IFN-γ (4). Whether the liver is in some sense a hostile environment for activated CD8+ T cells could be investigated further by using, for example, the hepatotrophic variant of lymphocytic choriomeningitis virus that grows extensively in this site. Also, hepatocytes are known to produce galectins, which can induce apoptosis in CD8+ T cells (32, 33).
Perhaps the liver is a graveyard (14, 34, 35) for any activated CD8+ T cells that enter the parenchyma and do not encounter their cognate antigen in that site. Histological analysis showed some focal accumulations of TdT+ CD8+ lymphocytes, but many others seemed to be scattered throughout the tissue. If the liver is a cemetery it should also, perhaps, be regarded as “death row.” By no means were all the CD8+ lymphocytes recovered from the liver or detected by histological analysis dysfunctional or apoptotic. The question remains whether activated CD8+ T cells that enter the liver can ever exit to become part of the effector- or memory-CTL pool.
The profiles of CD69 staining late in the course of the secondary response also suggested that the resolution of the inflammatory process in the lung could result in the return of some of these effector CTL to the blood, followed by their elimination in the liver. The expression of CD69 has been correlated with apoptosis (36), at least for thymocytes. However, the patterns of response and staining in the BAL and the liver indicate that CD69 expression, dysfunction, and apoptosis may be mutually exclusive for mature, antigen-activated CD8+ T cells. Also, there is no evidence that CD8+ T cells that have localized to the lung can indeed reenter the circulation. It seems more likely that most of these lymphocytes are eliminated by retrograde mucus flow and are coughed up or swallowed.
Acknowledgments
We thank Mr. Joe Miller, Dr. E. Usherwood, and Dr. K. Flynn for providing tetramers and Ms. Vicki Henderson for help with the manuscript. These experiments were supported by National Institutes of Health Grants AI29579 and CA21765 and by the American Lebanese Syrian Associated Charities. G.T.B. is a C. J. Martin Fellow of the Australian National Health and Medical Research Council (Fellowship regkey 977 309).
ABBREVIATIONS
- B6 mice
C57BL/6J mice
- BAL
bronchoalveolar lavage
- CTL
cytotoxic T lymphocyte
- DbNP366
tetrameric complex of H-2Db + influenza virus NP366–374 peptide
- IFN-γ
interferon γ
- i.n.
intranasal
- NP
viral nucleoprotein
- TCR
T cell receptor
- TdT
terminal deoxynucleotidyltransferase
- TUNEL
TdT-mediated UTP end labeling
References
- 1.Doherty P C, Topham D J, Tripp R A. Immunol Rev. 1996;150:23–44. doi: 10.1111/j.1600-065x.1996.tb00694.x. [DOI] [PubMed] [Google Scholar]
- 2.Altman J D, Moss P A H, Goulder P J R, Barouch D H, McHeyzer-Williams M G, Bell J I, McMichael A J, Davis M M. Science. 1996;274:94–96. [PubMed] [Google Scholar]
- 3.Murali-Krishna K, Altman J D, Suresh M, Sourdive D J, Zajac A J, Miller J D, Slansky J, Ahmed R. Immunity. 1998;8:177–187. doi: 10.1016/s1074-7613(00)80470-7. [DOI] [PubMed] [Google Scholar]
- 4.Flynn K J, Belz G T, Altman J D, Ahmed R, Woodland D L, Doherty P C. Immunity. 1998;8:683–691. doi: 10.1016/s1074-7613(00)80573-7. [DOI] [PubMed] [Google Scholar]
- 5.Callan M F, Tan L, Annels N, Ogg G S, Wilson J D, O’Callaghan C A, Steven N, McMichael A J, Rickinson A B. J Exp Med. 1998;187:1395–1402. doi: 10.1084/jem.187.9.1395. [DOI] [PMC free article] [PubMed] [Google Scholar]
- 6.Ogg G S, Jin X, Bonhoeffer S, Dunbar P R, Nowak M A, Monard S, Segal J P, Cao Y Z, Rowland-Jones S L, Cerundolo V, et al. Science. 1998;279:2103–2106. doi: 10.1126/science.279.5359.2103. [DOI] [PubMed] [Google Scholar]
- 7.McMichael A J, O’Callaghan C A. J Exp Med. 1998;187:1367–1371. doi: 10.1084/jem.187.9.1367. [DOI] [PMC free article] [PubMed] [Google Scholar]
- 8.Allan W, Tabi Z, Cleary A, Doherty P C. J Immunol. 1990;144:3980–3986. [PubMed] [Google Scholar]
- 9.Kilbourne E D. Bull W H O. 1969;41:643–645. [PMC free article] [PubMed] [Google Scholar]
- 10.Tripp R A, Hou S, McMickle A, Houston J, Doherty P C. J Immunol. 1995;154:6013–6021. [PubMed] [Google Scholar]
- 11.Eichelberger M C, Wang M, Allan W, Webster R G, Doherty P C. J Gen Virol. 1991;72:1695–1698. doi: 10.1099/0022-1317-72-7-1695. [DOI] [PubMed] [Google Scholar]
- 12.Doherty P C, Allan W, Eichelberger M, Carding S R. Annu Rev Immunol. 1992;10:123–151. doi: 10.1146/annurev.iy.10.040192.001011. [DOI] [PubMed] [Google Scholar]
- 13.Huang L, Soldevila G, Leeker M, Flavell R, Crispe I N. Immunity. 1994;1:741–749. doi: 10.1016/s1074-7613(94)80016-2. [DOI] [PubMed] [Google Scholar]
- 14.Crispe I N, Huang L. Semin Immunol. 1994;6:39–41. doi: 10.1006/smim.1994.1006. [DOI] [PubMed] [Google Scholar]
- 15.Wack A, Corbella P, Harker N, Crispe I N, Kioussis D. Eur J Immunol. 1997;27:577–583. doi: 10.1002/eji.1830270302. [DOI] [PubMed] [Google Scholar]
- 16.Koniaras C, Bennett S R M, Carbone F R, Heath W R, Lew A M. Int Immunol. 1997;9:1601–1605. doi: 10.1093/intimm/9.10.1601. [DOI] [PubMed] [Google Scholar]
- 17.Huang L, Sye K, Crispe I N. Int Immunol. 1994;6:533–540. doi: 10.1093/intimm/6.4.533. [DOI] [PubMed] [Google Scholar]
- 18.Tripp R A, Hou S, Doherty P C. J Immunol. 1995;154:5870–5875. [PubMed] [Google Scholar]
- 19.Deckhut A M, Allan W, McMickle A, Eichelberger M, Blackman M A, Doherty P C, Woodland D L. J Immunol. 1993;151:2658–2666. [PubMed] [Google Scholar]
- 20.Cole G A, Hogg T L, Woodland D L. J Immunol. 1995;155:2841–2848. [PubMed] [Google Scholar]
- 21.Townsend A R, Rothbard J, Gotch F M, Bahadur G, Wraith D, McMichael A J. Cell. 1986;44:959–968. doi: 10.1016/0092-8674(86)90019-x. [DOI] [PubMed] [Google Scholar]
- 22.Gavrieli Y, Sherman Y, Ben-Sasson S A. J Cell Biol. 1992;119:493–501. doi: 10.1083/jcb.119.3.493. [DOI] [PMC free article] [PubMed] [Google Scholar]
- 23.Baumgarth N, Kelso A. Eur J Immunol. 1996;26:2189–2197. doi: 10.1002/eji.1830260934. [DOI] [PubMed] [Google Scholar]
- 24.Huang L, Crispe I N. J Immunol. 1993;157:1844–1851. [PubMed] [Google Scholar]
- 25.Hou S, Doherty P C. J Immunol. 1993;150:5494–5500. [PubMed] [Google Scholar]
- 26.Picker L J. Curr Opin Immunol. 1994;6:394–406. doi: 10.1016/0952-7915(94)90118-x. [DOI] [PubMed] [Google Scholar]
- 27.Alon R, Kassner P D, Carr M W, Finger E B, Hemler M E, Springer T A. J Cell Biol. 1995;128:1243–1254. doi: 10.1083/jcb.128.6.1243. [DOI] [PMC free article] [PubMed] [Google Scholar]
- 28.Dustin M L, Carpen O, Springer T A. J Immunol. 1992;148:2654–2663. [PubMed] [Google Scholar]
- 29.Ziegler S F, Levin S D, Johnson L, Copeland N G, Gilbert D J, Jenkins N A, Baker E, Sutherland G R, Feldhaus A L, Ramsdell F. J Immunol. 1994;152:1228–1235. [PubMed] [Google Scholar]
- 30.Gallimore A, Glithero A, Godkin A, Tissot A C, Plückthun A, Elliott T, Hengartner H, Zinkernagel R. J Exp Med. 1998;187:1383–1393. doi: 10.1084/jem.187.9.1383. [DOI] [PMC free article] [PubMed] [Google Scholar]
- 31.Valitutti S, Müller S, Dessing M, Lanzavecchia A. J Exp Med. 1996;183:1917–1921. doi: 10.1084/jem.183.4.1917. [DOI] [PMC free article] [PubMed] [Google Scholar]
- 32.Lotan R, Belloni P N, Tressler R J, Lotan D, Xu X C, Nicholson G L. Glycoconj J. 1994;11:462–468. doi: 10.1007/BF00731282. [DOI] [PubMed] [Google Scholar]
- 33.Perillo N L, Pace K E, Seilhamer J J, Baum L G. Nature (London) 1995;378:736–739. doi: 10.1038/378736a0. [DOI] [PubMed] [Google Scholar]
- 34.Sprent J, Miller J F. Eur J Immunol. 1972;2:384–387. doi: 10.1002/eji.1830020420. [DOI] [PubMed] [Google Scholar]
- 35.Sprent J. Cell Immunol. 1976;21:278–302. doi: 10.1016/0008-8749(76)90057-5. [DOI] [PubMed] [Google Scholar]
- 36.Kishimoto H, Surh D H, Sprent J. J Exp Med. 1995;181:649–655. doi: 10.1084/jem.181.2.649. [DOI] [PMC free article] [PubMed] [Google Scholar]


