

Abstract
Interest centers here on the analysis of two different, but related, phenomena that affect side-chain conformations and consequently 13Cα chemical shifts and their applications to determine, refine, and validate protein structures. The first is whether 13Cα chemical shifts, computed at the DFT level of approximation with charged residues is a better approximation of observed 13Cα chemical shifts than those computed with neutral residues for proteins in solution. Accurate computation of 13Cα chemical shifts requires a proper representation of the charges, which might not take on integral values. For this analysis, the charges for 139 conformations of the protein ubiquitin were determined by explicit consideration of protein binding equilibria, at a given pH, that is, by exploring the 2ξ possible ionization states of the whole molecule, with ξ being the number of ionizable groups. The results of this analysis, as revealed by the shielding/deshield-ing of the 13Cα nucleus, indicated that: (i) there is a significant difference in the computed 13Cα chemical shifts, between basic and acidic groups, as a function of the degree of charge of the side chain; (ii) this difference is attributed to the distance between the ionizable groups and the 13Cα nucleus, which is shorter for the acidic Asp and Glu groups as compared with that for the basic Lys and Arg groups; and (iii) the use of neutral, rather than charged, basic and acidic groups is a better approximation of the observed 13Cα chemical shifts of a protein in solution. The second is how side-chain flexibility influences computed 13Cα chemical shifts in an additional set of ubiquitin conformations, in which the side chains are generated from an NMR-derived structure with the backbone conformation assumed to be fixed. The 13Cα chemical shift of a given amino acid residue in a protein is determined, mainly, by its own backbone and side-chain torsional angles, independent of the neighboring residues; the conformation of a given residue itself, however, depends on the environment of this residue and, hence, on the whole protein structure. As a consequence, this analysis reveals the role and impact of an accurate side-chain computation in the determination and refinement of protein conformation. The results of this analysis are: (i) a lower error between computed and observed 13Cα chemical shifts (by up to 3.7 ppm), was found for ~68% and ~63% of all ionizable residues and all non-Ala/Pro/Gly residues, respectively, in the additional set of conformations, compared with results for the model from which the set was derived; and (ii) all the additional conformations exhibit a lower root-mean-square-deviation (1.97 ppm ≤ rmsd ≤ 2.13 ppm), between computed and observed 13Cα chemical shifts, than the rmsd (2.32 ppm) computed for the starting conformation from which this additional set was derived. As a validation test, an analysis of the additional set of ubiquitin conformations, comparing computed and observed values of both 13Cα chemical shifts and χ1 torsional angles (given by the vicinal coupling constants, 3JN–Cγ and 3JC′–Cγ, is discussed.
Keywords: chemical shift prediction, ubiquitin, proton binding/release equilibria, pH effects, vicinal coupling constant, side-chain prediction, protein refinement
INTRODUCTION
We have been developing methodology to use 13Cα chemical shifts, in addition to other NMR data, to determine, refine, and validate protein structure in solution. 1,2 Proper use of this methodology requires knowledge of the factors affecting side-chain conformation because this could affect the computation of 13Cα chemical shifts and, hence, the accuracy of the computations. The backbone and side-chain conformations of a residue are influenced by interactions with the rest of the protein but, once these conformations are established by these interactions, the 13Cα chemical shift of this residue depends, mainly, on its backbone, 3–6 and its side-chain7–11 conformation, with no significant influence of either the amino acid sequence 1,6,10–12 or the position of the given residue in the sequence. 1 These properties, together with the fact that 13Cα is ubiquitous in proteins, make this nucleus an attractive candidate for computation of theoretical chemical shifts at the quantum chemical level of theory in order to determine, refine, and validate protein structures.1,2,9–12
Missing in the above description of factors that affect 13Cα-shielding, which are important for an accurate computation of observed chemical shifts, is the sensitivity of 13Cα nuclei to the shielding/deshielding induced by changes in the protonation/deprotonation of distant ion-izable groups. 13–16 However, these factors have not been taken into account explicitly in current computations of 13Cα chemical shifts in proteins at the quantum chemical level of theory because, usually, the calculations are carried out in the gas phase, and the ionizable residues are treated as neutral groups.10–12 To our knowledge, the only theoretical evidence indicating that the use of neutral, rather than charged, side chains leads to a better approximation of observed 13Cα chemical shifts in solution was presented by Xu and Case.12 These authors computed the shielding of 13Cα and other nuclei for neutral and charged residues in the sequence Ac-GGXGG-NH2, with X = Asp, Glu, Lys, and Arg, for canonical β-sheet and a-helix conformations. Their computed results were compared with experimental chemical shifts obtained from statistical-coil model peptides for these ionizable residues (X), with the same sequence, in 8M urea at 20°C and pH 2.3.17 From the comparison between computed and observed shielding, Xu and Case12 concluded that: “…the neutral models are much closer to the experimental results than those obtained from the charged model…” However, the acidic condition (pH = 2.3) at which the experiments were carried out by Schwarzinger et al.17 would prevent the acidic groups, Asp and Glu, from being fully deprotonated because their standard pK°s, namely 3.9 and 4.3,18 respectively, are significantly higher than the pH (2.3) of the solution. Thus, the conclusions of Xu and Case12 pertain only to basic groups which have pK°s much larger than 2.3, and are charged at this low pH.
There are other important effects that differ between proteins and oligopeptides, such as Ac-GGXGG-NH2, as models for proton binding/release equilibria. For example, proteins usually contain a large fraction of ionizable side-chain groups, viz., ~30% of the sequence, that can bind or release protons to become positively or negatively charged. Since charged groups may come spatially close to each other at intermediate conformations during folding or in the final native conformation, the equilibrium binding of protons in different conformations should also vary and, hence, the assignment of integral charges in proteins, based only on their pH-dependent ionization equilibria, might contribute an important source of error. This means that the appropriate set of charges of the residues in a protein should be assigned by solving the Poisson equation by explicit consideration of the proton binding/release equilibria. This is because the ionization of the residues in a protein depends on the conformation and on the environment of these groups 19; the conformation, in turn, is sensitive to the state of ionization of the individual amino acid residues.20 Because of these considerations, a protein, rather than an oligopeptide, was selected here as a model with which to analyze the effect of the charge distribution on the computed 13Cα chemical shifts.
For this purpose, ubiquitin was chosen for the analysis. This small 76-residue protein, which contains 22 ionizable amino acid residues, has been used extensively as a model system with which to study protein structure, stability, folding and dynamics, 21–24 and its 13Cα chemical shifts, among those of other nuclei, have been determined experimentally at 292°K and pH 6.5.25 The role of some specific basic residues of this protein, such as Lys-6, in the regulation of the ubiquitin/proteosome pathway of the cell cycle has been investigated recently.26 In addition, the role of other ionizable basic groups in the sequence, such as Lys-11, Lys-29, Lys-48, and Lys-63, in formation of the ubiquitin chain, 27,28 illustrates the importance of an accurate computation of the solvent-exposed side chains of this protein. Lastly, NMR analysis of variant ubiquitins shows that the strength of an interaction between two close residues on the surface of the protein, such as the ion pair between Asp-21 and Lys-29, is influenced by residues beyond the site of mutation.29
In the work presented here, the question of whether the use of neutral, rather than charged, side chains is more accurate for computation of the 13Cα chemical shifts of ubiquitin at a given pH is investigated by introducing the following approximations: first, the average charge distribution is computed by explicit consideration of the 2ξ ionization states for every conformation,30,31 with ξ being the number of ionizable groups in the molecule, namely 22, combined with a reasonably reliable and accurate method to treat the solvent, by using the multigrid boundary element (MBE) method;32–34 and second, the 13Cα chemical shifts were computed for each residue in the sequence, with explicit consideration of the computed average degree of charge, by using a combination of approaches that includes, but is not limited to, the use of density functional theory (DFT).1 This analysis was carried out by using 139 conformations of ubiquitin: 138 of these are NMR-derived conformations, 21,25 while the remaining one is an X-ray structure solved at 1.8-Å resolution.35
An additional set of 50 randomly generated conformations for each amino acid residue X, in the terminally-blocked tripeptide with the sequence Ac-GXG-NMe, with X being Lysine (Lys), Ornithine (Orn), Diaminobutyric acid (Dab), Glutamic acid (Glu), or Aspartic (Asp) acid, was also obtained in order to investigate: (a) the range of shielding/deshielding of the 13Cα nucleus of acidic/basic individual free amino acid residues in solution, in their fully charged and neutral forms, respectively; (b) how these ranges of shielding/deshielding compare with those derived from 3058 ionizable groups of the 139 conformations of the protein ubiquitin; and (c) how the computed shielding/deshielding is influenced by the distance between the charged side-chain group and the 13Cα nucleus; for example there are two chemical bonds in Asp, rather than three in Glu, separating the deprotonated carboxyl group from the 13Cα nucleus. To examine an analogous effect for a basic side-chain group, such as Lys, use was made of the nonnatural amino acids Orn and Dab because, for these amino acids, the protonated amino group is separated from the 13Cα nucleus by four and three chemical bonds, rather than five in Lys.
Finally, the effect of side-chain conformation on both the charge distribution and the computed 13Cα chemical shifts was investigated by carrying out a conformational search, starting with a selected conformation of the ubiquitin protein, in which only the torsional angles of the side chains were allowed to vary, that is, all backbone dihedral angles (Ф, ψ, ω) were fixed at their regularized values. The results have enabled us to determine the role and impact of a proper side-chain conformation for an accurate computation of the observed 13Cα chemical shifts in solution. Validation of the resulting side-chain conformations in terms of measured vicinal coupling constants, 3JN–Cγ and 3JC′–Cγ for Val, Ile, and Thr,36 is also discussed.
METHODS
Experimental set of structures
Computations of the 13Cα chemical shifts were carried out for 3058 ionizable residues, in their charged form, from 139 ubiquitin protein conformations. About 138 of these are NMR-derived conformations: 128 of these structures (PDB code: 1XQQ), shown in Figure 1, were reported by Lindorff-Larsen et al.21 and 10 structures (PDB code: 1D3Z), were reported by Cornilescu et al.25 The remaining one is an X-ray structure solved at 1.8-Å resolution by Vijay-Kumar et al.35 (PDB code: 1UBQ).
Figure 1.
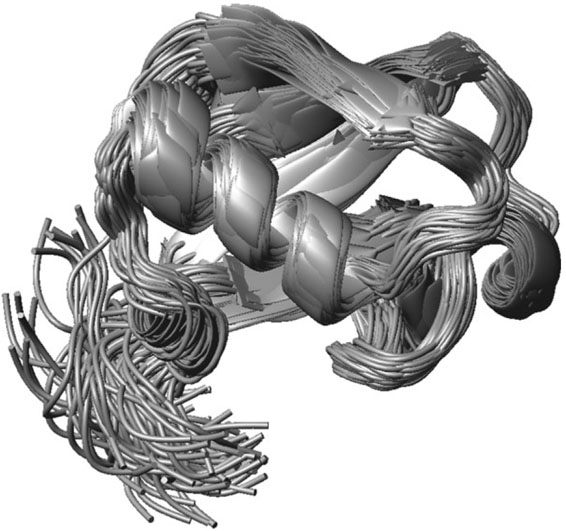
Ribbon diagram of the superposition of 128 NMR-derived conformations of the protein ubiquitin (PDB code: 1XQQ).
All these experimentally determined protein conformations were, first, regularized, that is, all residues were replaced by the standard ECEPP/3 residues37 in which bond lengths and bond angles are fixed (rigid-geometry approximation), and (b) hydrogen atoms were added, if necessary.1
Determination of the average degree of charge at pH 6.5
For a given conformation k of residue i, the average charge distribution, could be determined by solving the Poisson equation by considering the 2ξ ionization states, with ξ being the number of ionizable groups in the molecule, namely 22 for ubiquitin. Use was made of the multiple boundary element (MBE) method,34 in which the free energy associated with the state of ionization of the ionizable groups at a fixed pH value, namely 6.5, is calculated with the general multisite titration for-malism.30,31 The charges and atomic radii parameters for the solvation free energy from the PARSE (parameters for solvation energy) algorithm38 are used in the MBE method, and the internal (εint) and solvent (εsolv) dielectric constants of 2 and 80, respectively31 were adopted for the calculations of The value of εint = 2 is commonly assumed as an adequate representation of the protein interior, and is consistent with the use of PARSE charges. 39 In this approximation, for a given conformation k, the average degree of ionization of the ith ionizable group of this conformation is computed as:
| 1 |
where Z is the partition function, kB is the Boltzmann constant, T is the absolute temperature, is the nth protonation microstate of conformation k for protein Pk, and is the free energy of ionization of the nth microstate of protein Pk in conformation k.30 For a given amino acid residue i, its average charge shown in Figure 2(a–c) was computed as:
| 2 |
where N is the number of protein conformations in the ensemble.
Figure 2.

Grey filled bars indicate the average value () of the charge for each ionizable group i, computed at pH 6.5 by using Eq. (2) for: (a) 10 conformations of 1D3Z, (b) 128 conformations of 1XQQ and (c) 1 X-ray conformation of 1UBQ. Except for 1UBQ, a filled black square and open circle denote the maximum and minimum computed average charge, respectively, from Eq. (1). The N- and C-termini are indicated as N- and C-, respectively. The one-letter code is used for the ionizable groups, followed by a number that represents its position in the sequence of ubiquitin. The values of 3.9, 4.3, 10.5, 10.1, 6.0, and 12.5 were adopted as for the ionizable groups of residues Asp, Glu, Lys, Tyr, His, and Arg, respectively, as an average from the data of Perrin.18 Values of 7.80 and 3.75 for the α-amino and α-carboxyl groups40 were used for the of the ionizable N- and C-terminal groups, respectively
It should be noted that, for any ionizable residue i of a single conformation k, as for an X-ray structure, Eq. (1), can lead to a noninteger average degree of charge, although we know that such noninteger charges do not make physical sense. Because of the Boltzmann nature of the averaged value computed by Eq. (1), a fractional charge should physically be interpreted as follows: for a given conformation k, there are many identical replicas of such a conformation in solution and, hence, a fractional charge computed by Eq. (1), for example, 0.7, means that 70% of these replicas possess the ionizable group i protonated/deprotonated with an integral charge while the remaining 30% of the replicas possess the same ionizable group as deprotonated/protonated, depending on whether the ionizable group is basic or acidic.
Quantum-chemical calculations of the 13Cα chemical shift
Following a recently introduced approach to compute chemical shifts in proteins,41 each amino acid X in the amino acid sequence is treated as a terminally-blocked tri-peptide with the sequence Ac-GXG-NMe in the conformation of each generated protein structure. The backbone and side-chain conformations of residue X of a given amino acid in a particular protein conformation are kept fixed while the conformations of the remaining residues of the terminally-blocked tripeptide are energy-minimized. The 13Cα chemical shifts are computed at the DFT level of approximation by using a 6-311+G(2d,p) locally-dense basis set42 for each amino acid residue X, while the remaining residues in the tripeptide are treated with a 3-21G basis set. This notation refers to the basic basis sets of Pople and co-workers43 as implemented in Gaussian-98.44 All the calculated isotropic shielding values (σ) were referenced with respect to a tetramethylsilane (TMS) 13Cα chemical shift scale (δ), as described previously.41
Conversion of the computed TMS-referenced values for the 13Cα chemical shifts to a 3-(Trimethylsilyl) propi-onate sodium salt (TSP) reference was carried out by adding 1.25 ppm, rather than 1.82 ppm suggested by Wishart et al.,45 because of the need to adjust the reference chemical shift as discussed by Vila et al.1
Computation of the 13Cα chemical shifts as function of the pH
Assuming that the protonation/deprotonation reactions are instantaneous on the NMR time scale, the theoretical 13Cα chemical shifts, , as a function of the pH, for a given residue i in the sequence, are computed by the following equation:
| 3 |
where δ+,i,k and δ0,i,k are the computed 13Cα chemical shifts, for the amino acid i in conformation k, with full charge and neutral side chain, respectively, N is the number of conformations in the protein ensemble, and the averaged degree of charge, as given by Eq. (1).
For presentation of the computed shifts, , for each set of conformations from 1XQQ, 1D3Z, and 1UBQ, respectively, the ionizable residues were divided into acidic (Glu and Asp) and basic (Lys and Arg) groups. The amino acid residues Tyr and His were omitted from this classification because they are always in their neutral form at the computed pH (6.5), as shown in Figure 2(a–c). Even histidine, with pK° = 6.0, is always observed to be deprotonated in proteins at pH = 6.5. The N- and C-termini charge distributions were computed by using Eq. (1) and the results are shown in Figure 2(a–c).
Modeling the side-chain flexibility of ubiquitin
To obtain a set of different side-chain conformations for a given ubiquitin protein conformation, Model 1 of 1D3Z,25 was selected. Then an electrostatically driven Monte Carlo (EDMC)46 conformational search was carried out with all the backbone dihedral angles fixed at the regularized values, that is, only side-chains were allowed to move without constraints, and all torsional angles of Ala, Pro, and Gly were fixed. During the conformational search, the total energy of the molecule was computed with the ECEPP/3 gas phase potential.37 The 90 computed conformations were clustered to a set of nine families by using the Minimal Spanning Tree method47 with an all-heavy-atom rmsd-cutoff of 0.3 Å and no cut-off in energy. The leading member of each family, that is, the lowest-energy conformation, was extracted, and the selected nine conformations were used to, first, determine the charges at pH 6.5, that is, by using Eq. (1), and second, to evaluate the computed chemical shifts, , by using Eq. (2).
Randomly generated conformations for tripeptide Ac-GXG-Nme
To determine the effect of the conformations of residue X in the tripeptide on its 13Cα shielding/deshielding, a set of 50 conformations of this tripeptide was generated randomly. All backbone and side-chain dihedral angles of Ac-GXG-NMe, with X = Lysine (Lys), Ornithine (Orn), Diaminobutyric acid (Dab), Glutamic acid (Glu), and Aspartic (Asp) acid, were chosen randomly between 180.0° and −180.0°, with the exception of the dihedral angles ω of the peptide group which were always chosen in the planar trans (180.0°) conformation. Local energy minimization was carried out for each conformation by using the ECEPP/3 gas phase potential.37 For all 50 generated conformations of each of these five amino acid residues, the 13Cα chemical shifts were computed for the fully charged and neutral side chain of residue X to obtain the range of its shielding/deshielding.
Computation of the chemical shift error, and the conformationally-averaged root-mean-square-deviation (ca-rmsd)
The error between computed and observed 13Cα chemical shifts, for each ionizable group i is computed as:
| 4 |
with given by Eq. (3). In addition, the average error is computed as:
| 5 |
where s is the number of acidic or basic groups in the sequence, namely 11 each, and is the error for the acidic or basic group i, computed by using Eq. (4).
The conformationally-averaged rmsd (ca-rmsd), is defined1 as:
| 6 |
with given by Eq. (4), m being the number of amino acids in the ubiquitin protein sequence, namely 76. For a single structure, as an X-ray derived one, N = k = 1, in Eq. (3), and hence rmsd ≡ ca-rmsd.
The standard deviation (SD) of the conformationally-averaged 13Cα chemical shifts for amino acid residue i is given by:
| 7 |
with
| 8 |
where N is the number of conformations in the protein ensemble.
RESULTS AND DISCUSSION
13Cα chemical shifts as a function of the charge distribution
The average charge for each ionizable residue in the whole protein was computed at pH 6.5 by using Eq. (2), for each conformation of a given set, namely, 128 for 1XQQ, 10 for 1D3Z, and 1 for 1UBQ [see results in Fig. 2(a–c)]. From these figures, a significant variability is noted in both the average charge, , for each of the 22 ionizable groups in the sequence, indicated by the heights of the bars in Figure 2(a–c), and for the maximum and minimum computed values of the average charge, , which are indicated by full squares and open circles, respectively, in the same figure (except for 1UBQ, because k = 1). In particular, the and the computed for 1D3Z show the highest dispersion of values.
Figure 3(a–f) shows the error between computed and observed 13Cα chemical shifts for each ionizable residue i in the sequence. The were computed by using Eq. (4) and the results for charged and neutral side chains are indicated by black and grey filled bars, respectively, in Figure 3. A significant difference between errors, , computed for basic and acidic groups is observed for all the conformations analyzed here, and a discussion of the nature and characteristics of these differences follows.
Figure 3.

Black and grey filled bars denote an average, over all conformations, of the computed error , given by Eq. (4), assuming charged and neutral side chain, respectively. The results are grouped in panels for each set of conformations used during the calculations. Thus, for basic and acidic groups, respectively, obtained with conformations of: 1D3Z, are shown in panels (a,b), 1XQQ, are shown in panels (c,d), and 1UBQ, are shown in panels (e,f).
Analysis of the mean error for the basic residues in 1D3Z, 1XQQ, and 1UBQ
The average errors over all ionizable residues, computed with Eq. (5) for both charged and neutral side chains in 1D3Z, lXQQ, and lUBQ, are in the range 1.0 ≤ ≤ 2.2 ppm. More importantly, they are within the range of the SD (0.90 ppm ≤ σ ≤ 2.25 ppm) observed by Wang and Jardetzky48 for 13Cα chemical shifts (from a database containing more than 6000 amino acid residues in α-helix, β-sheet, and statistical-coil conformations). In other words, use of either charged or neutral side chains for the basic groups leads to very similar errors , as shown in Figure 3(a–e), and hence to similar accuracy for the computations. However, calculations by using neutral side chains do not suffer from the costly evaluation of the charge distribution and therefore, without losing generality, we conclude that use of neutral side chains is a good approximation to compute the 13Cα chemical shifts of basic lysine and arginine groups in solution.
Analysis of Δα for the acid residues
A similar analysis was carried out for the acidic groups, with the errors given in Figure 3(b–f), indicated that the mean error with charged side chains are larger ( ≥ 3.1 ppm), while the errors computed by using neutral side chains are lower ( ≈ 1.4 ppm), than the maximum SD (σ ≤ 2.25 ppm) observed by Wang and Jardetzky.48 In other words, for acidic groups, the use of neutral rather than charged side chains is a significantly better approximation to the observed 13Cα chemical-shift values in solution.
From this analysis, we infer that deprotonation of the acidic groups induces a higher deshielding of the 13Cα nucleus than the shielding induced by protonation of the basic groups, and hence this effect accounts for the differences observed between errors computed for the 13Cα chemical shifts in charged acidic and basic residues, respectively. To investigate whether this behavior depends on the conformations analyzed or on the number of chemical bonds that separate the 13Cα nucleus from the protonation site, that is, two or three chemical bonds for acidic Asp and Glu groups and more than five for basic Lys and Arg groups, additional calculations were carried out, and the results are discussed in section Analysis of the Shielding/Deshielding in Randomly Generated Tripeptides.
Analysis of the shielding/deshielding in randomly generated tripeptides
Fifty randomly generated conformations of each tripep-tide Ac-GXG-NMe, with X = Lysine (Lys), Ornithine (Orn), Diaminobutyric acid (Dab), Glutamic acid (Glu), and Aspartic (Asp) acid were obtained, as explained in the Material and Methods section, and each of these conformations was used to compute the 13Cα chemical shifts with charged and neutral side chains, respectively, with Eq. (3).
Evaluation of the results for the computed 13Cα chemical shifts, from the 50 randomly generated conformations of each tripeptide, indicated that the average shieldings of the 13Cα nucleus in Lys, Orn, and Dab are: 1.0 ± 0.7 ppm, 1.9 ± 1.0 ppm, and 2.3 ± 0.3 ppm, respectively, while the average deshielding of the 13Cα nucleus for Glu and Asp acid are: 2.0 ±1.0 ppm and 3.4 ± 0.6 ppm, respectively. The trend of the averaged computed shielding/deshielding of the 13Cα nucleus follows that of the number of intervening bonds between the ionizable groups and the 13Cα nucleus, independent of whether the charge is positive or negative. The absence of this dependence on the sign of the charge is illustrated by the observed close agreement of the shielding/deshielding between Glu (2.0 ppm) and Dab (2.3 ppm), even though the first one possesses a car-boxylic group while the second one an amino group. The dependence of the shielding/deshielding on the number of bonds separating the charge and the 13Cα nucleus is the same for basic and acidic groups, and also accounts for the significant differences observed in the computed errors for basic and acidic errors in Figure 3(a–f). Moreover, from this calculation for randomly-generated tripep-tides, we can infer that the computed values of the deshielding/shielding range are similar to those computed for the protein ubiquitin. Thus, for example, from 1D3Z the average and SD of deshielding/shielding computed for Asp, Glu, and Lys are: 2.0 ± 1.4, 1.8 ± 0.7, and 1.4 ± 0.6. Conceivably, the small observed differences in the average values of the computed shielding/deshielding for 1D3Z conformations of ubiquitin, and those for the randomly generated tripeptide conformations, might reflect one, or a combination of, the following effects. First, the randomly generated tripeptide conformations include differences of shielding between fully charged and uncharged side-chains, whereas the charges in each residue in a protein depend on the neighboring charge, and hence may not be fully charged or uncharged [as shown in Fig. 2(a–c)]. Second, the randomly generated conformations include a wide dispersion of both backbone and side-chain torsional angles, not just the side-chain torsional angle differences that occur mainly within the 1D3Z ensemble of conformations.9
Analysis of the effects of side-chain conformation on the 13Cα chemical shifts
Visual inspection of the error distribution for the basic groups [see Fig. 3(a,c,e)] indicates that, for some ioniz-able residues, there are significant errors ( ≥ 2.25 ppm) no matter whether the calculations were carried out with charged or neutral side-chains, as for Lys-27 and Lys-33 of 1D3Z, and Lys-33 of 1UBQ [see Fig. 3(a,e)]. Such examples might indicate problems with the side-chain conformations, rather than with the charge distribution assumed during the calculations.1 To determine the origin of these large errors for these three Lys residues, Model 125 out of 10 models of 1D3Z was chosen for a conformational analysis of the side chains. During the EDMC conformational search of this model, the backbone (Ф, ψ, ω) torsional angles for all the residues were kept fixed at their regularized values, as explained in Modeling the Side-Chain Flexibility of Ubiquitin of the Material and Methods section. After clustering all 90 EDMC-generated conformations, a set of 9 new protein conformations was selected.
This set of nine new conformations was used to: (a) analyze the dispersion of the side-chain conformations by computing the average root-mean-square-deviation (rmsd) between the heavy atoms of each residue of Model 1 and those from the nine new conformations (as shown in Fig. 4); (b) analyze the variations in the theoretical 13Cα chemical shifts, computed with Eq. (3), upon changes in the charge distribution (shown in Fig. 5); (c) validate the set of nine new conformations based on the computed ca-rmsd with Eq. (6) [see Fig. 6]; (d) carry out a detailed analysis of the changes in the error distribution, , between the starting conformation, that is, Model 1 of 1D3Z, and the values computed for the set of nine new conformations (shown in Fig. 7); (e) validate the side-chain conformational search by a comparison, between computed and measured vicinal coupling constants 3JN–Cγ and 3JC′–Cγ of Val 5, 17, 26, 70, Thr 7, 9, 12, 14, 22, 55 and Ile 3, 13, 23, 30, 36, 44, 61, for ubiquitin36; and (f) to analyze the possible existence of a correlation between the SD (SD) of the side-chain conformational dispersion with the dispersion of the computed 13Cα chemical shifts. Discussion of each of these points follows.
Figure 4.
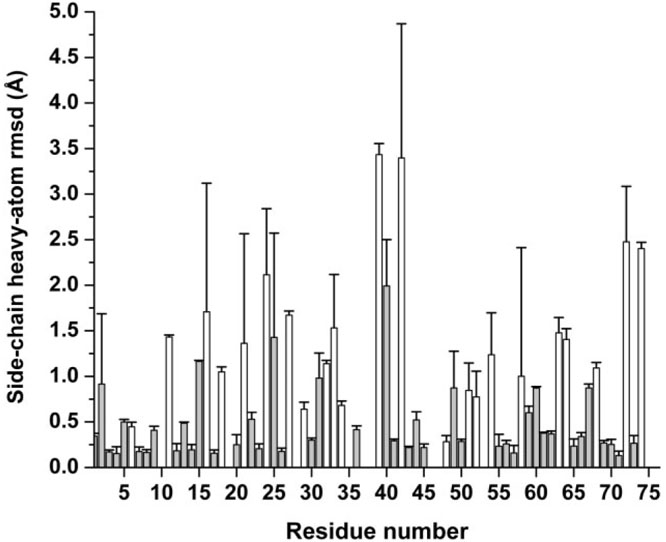
Bars indicate the side-chain heavy atom rmsd (Å) with respect to Model 1 of 1D3Z, for each residue in the sequence, from the average over the new set of 9 conformations. White bars are used to indicate the ionizable groups in the sequence, while grey filled bars are used for the remaining residues. The SD obtained from the reported mean values are indicated by the symbol ( ). Absence of bars in the sequence indicates either Pro, Ala, or Gly amino acid residue.
Figure 5.

Black and grey filled bars denote an average, over all of the new set of nine conformations, of the computed error , as given by Eq. (4), assuming charged and neutral side chain, respectively. The for basic and acidic groups are shown in panels (a) and (b), respectively.
Figure 6.
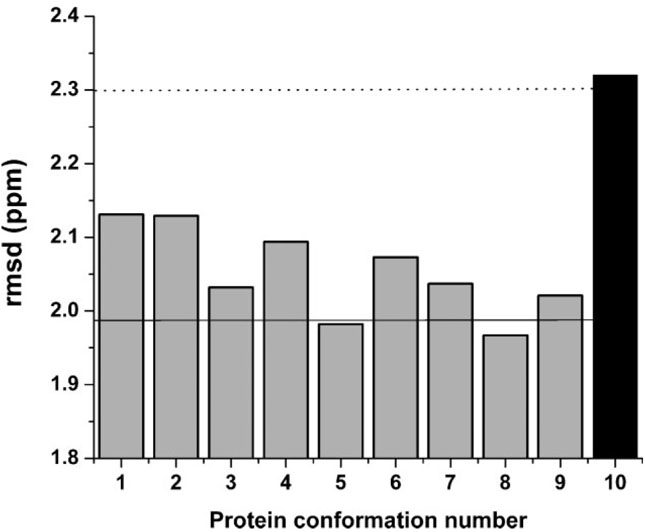
Grey bars indicate the rmsd value computed as described in the Methods section for each member of the set of 9 new conformations of ubiquitin (see section Computation of the Chemical Shift error, , and the Conformationally-Averaged Root-Mean-Square-Deviation (ca-rmsd). The Black bar indicates the rmsd value (2.32 ppm) computed for Model 1 of 1D3Z, from which the set of nine new conformations was derived. The horizontal dotted line (2.30 ppm) represents the ca-rmsd computed for the 10 conformations of 1D3Z.1 The solid horizontal line (1.99 ppm) indicates the ca-rmsd value computed for the set of 9 new conformations (as explained in section Analysis of the Effects of Side-Chain Conformation on the 13Cα Chemical Shifts in Results and Discussion).
Figure 7.

(a) Grey-dashed bars denote the computed error , as given by Eq. (4), assuming neutral side chains for the basic groups, of Model 1 of 1D3Z. The white bars denote an average, over the nine new conformations derived from Model 1 of 1D3Z, of the computed error , as given by Eq. (4); (b) same as (a) for the acidic groups.
Analysis of the mobility of the side chains
Figure 4 shows the side-chain heavy atom rmsd (Å) with respect to Model 1 of 1D3Z, for each residue in the sequence, from the average over the set of nine new conformations. As expected, higher rmsd value are observed for the solvent-exposed residues such as the ionizable groups (indicated by the height of the white bars in Fig. 4). Since each of the fixed backbones of the set of nine new conformations is the same as that of Model 1 of 1D3Z, the analysis of the predicted 13Cα chemical shifts, in terms of the ca-rmsd, for this set of structures must reveal only the influence of the range of the side-chain mobility, and their relevance for an accurate computation of 13Cα chemical shifts.
Effect of charge distribution on the computed 13Cα chemical shifts
Analysis of the effects of changes in the charge distribution of the side chains on the computed 13Cα chemical shifts is shown in Figure 5(a,b). The results indicate that there are no changes in the interpretation of the charge effects in the new set of nine conformations from that obtained from the previous analysis of 139 protein conformations in sections Analysis of the Mean Error for the Basic Residues in 1D3Z, 1XQQ, and 1UBQ and Analysis of Δα for the Acid Residues, that is, the results obtained for the basic groups with charged and neutral side chains lead to similar error distributions [cf. Fig. 3(a,c,e) with Fig. 5(a)], while the results obtained for the acidic groups [cf. Fig. 3(b,d,f) with Fig. 5(b)] are, almost, systematically worse for charged than for neutral residues. For this reason, in the remaining sections, the results obtained with only neutral side chains were used for the analysis.
Validation of the set of nine new structures based on rmsd and ca-rmsd
Figure 6 shows the rmsd between the computed and the observed 13Cα chemical shifts for each of the new set of nine new protein conformations. The solid horizontal line, at 1.99 ppm, and the dotted horizontal line, at 2.30 ppm, 1 indicate the value of the conformational-averaged-rmsd (ca-rmsd) computed for the set of nine new conformations and with the original 10 NMR-derived conformations of 1D3Z, respectively. There is an improvement (~0.3 ppm) in terms of ca-rmsd when the side chains were allowed to vary with backbones remaining fixed in Model 1. It should be noted that every conformation of the new set of structures possesses a better rmsd than that of Model 1 of 1D3Z (black filled bar in Fig. 6). These results, obtained by assuming a fixed backbone, are in line with results derived from the side-chain effect in a β-sheet model peptide,11 indicating that proper consideration of side-chain preferences may be necessary for good agreement between observed and computed 13C chemical shifts.
Analysis of the changes in the error Δα distribution
Figure 7(a,b) shows the results for the error distribution, , computed with Eq. (4), for Model 1 of 1D3Z (grey-dashed bars) and the average error, computed for the set of nine new conformations (white bars). In this figure, by comparing the height of the grey-dashed and white error bars, it can be seen that, for 15 out of 22 ionizable residues, there is an improvement in the computed errors when the side chain is allowed to vary. Of all these particular ionizable residues, it is significant that there is a reduction in the error, computed for Lys-33, that is, = 3.2 ppm, with where the subscripts m_1 and new_set means “from Model 1 of 1D3Z (grey-dashed bars in Fig. 7)” and “from the set of nine new conformations (white bars in Fig. 7)”, respectively. The most notable reduction in the error, , was found for Thr-22 with a = 3.7 ppm (not shown). When considering all the residues, we found a lower computed error for 41 out of 65 (nonalanine, nonproline, nonglycine) residues.
A comparison between the results shown in Figures 4 and 7(a,b) indicates that the correlation between the magnitudes of the side-chain rmsd (as indicated by the height of the white and grey bars in Fig. 4) with the changes of the computed 13Cα chemical shifts, as given by for all residues in the sequence [not only the ionizable residues shown in Fig. 7(a,b)] is almost random (R = 0.3). This is clearly illustrated by the following two examples involving ionizable groups. The higher change in terms of side-chain rmsd occurs for Arg-42 (3.4 ± 1.5 Å), although there is no significant change in the computed error in Figure 7(a), that is, = 0.2 ppm. On the other hand, a similar side-chain rmsd, as seen for residues 33 and 63 in Figure 4, namely ~1.5 Å, leads to significant differences in the accuracy of the 13Cα prediction; that is, reduction of the errors for Lys-33 and Lys-63 are = 3.2 ppm and = 0.7 ppm, respectively, as shown in Figure 7(a). The existence of a correlation between the dispersion, indicated by the symbol ![]() in Figure 4, and the computed chemical shifts is discussed in Analysis of the Standard Deviations and Side-Chain Mobility, below.
in Figure 4, and the computed chemical shifts is discussed in Analysis of the Standard Deviations and Side-Chain Mobility, below.
Analysis of the vicinal coupling constants 3JN–Cγ and 3JC′–Cγ
As an independent test to validate the side-chain con-formational search, the Pearson correlation coefficient, R, between computed and measured vicinal coupling constants, 3JN–Cγ and 3JC′–Cγ of Val 5, 17, 26, 70, Thr 7, 9, 12, 14, 22, 55 and Ile-3, 13, 23, 30, 36, 44, 6136 was evaluated. The vicinal coupling constants were computed from the χ's obtained for the set of nine new conformations by using the Karplus equation, with optimized parameters for ubiquitin given by Chou et al.36 The computed R value with the set of 9 new conformations (R = 0.89) is almost indistinguishable from that of Model 1 of 1D3Z (R = 0.87) and also from the 10 conformations of 1D3Z (R = 0.88). Not surprisingly, these results are less accurate than the prediction from 128 conformations of 1XQQ (R = 0.95). This is a consequence of the fact that the 1XQQ conformations were obtained by explicit consideration of the dynamics of the side chains.21
Among all the analyzed Val, Ile, and Thr residues, we will focus our attention on Thr-22 because this residue shows the most remarkable reduction in the error, namely = 3.7 ppm (see Table I). Although, the variation of the side-chain χ1 torsional angles among the set of nine new conformations is within ~3°, that is, showing small dispersion, all χ1 torsional angles of these nine new conformations differ from that of Model 1 of 1D3Z by ~25°. Therefore, it is clear that the side-chain mobility in the set of nine new conformations, compared with the single conformation of Model 1, is the origin of the improvement in the agreement obtained for both the computed 3JN–Cγ and the 13Cα chemical shifts, by 0.41 Hz and 3.7 ppm, respectively (see Table I). The value obtained for 3JC′–Cγ shows a slightly larger error (0.22 Hz) than that from Model 1 of 1D3Z (0.11 Hz) [see Table I] but within the experimental error, that is, not greater than 0.3 Hz, according to Grzesiek et al.49 For the remaining threonines in the sequence, we found that the trend of the observed changes in the vicinal coupling constant matches those of the variation in the 13Cα chemical shifts. However, the changes in the vicinal coupling constant for some of these residues, for example, Thr-7, Thr-12, Thr-14, and Thr-55 shown for the grey bars in Figure 8, among different conformations, are too close to the experimental error (0.3 Hz) to be considered relevant. There is a change in the vicinal coupling constant greater than the 0.3 Hz error only for Thr-9 (0.43 Hz) and Thr-22 (0.41 Hz). In particular for Thr-9, all the χ1 torsional angles of the set of nine new conformations differ from that of Model 1 of 1D3Z by ~15°.
Table I.
Analysis of the Vicinal Coupling Constants 3JN–Cγ and 3JC′–Cγ and 13Cα Chemical Shifts in Thr-22a
| Vicinal coupling constantb (Hz) |
|||
|---|---|---|---|
| Protein conformation |
3JN–Cγ(0.75) | 3JC′–Cγ(3.39) |
13Cα chemical shiftsc (59.69) |
| Model 1d | 0.21 | 3.28 | 63.50 |
| New sete | 0.87 | 3.61 | 59.79 |
| 1D3Zf | 0.21 | 3.28 | 63.69 |
| 1XQQg | 0.46 | 3.43 | 63.54 |
The best agreement between the computed and the observed vicinal coupling constants 3JN–Cγ (0.75 Hz), 3JC′–Cγ (3.39 Hz), and the 13Cα chemical shifts (59.69 ppm), are underlined and in bold face. Those vicinal coupling constants that are within the experimental error, that is, less than 0.3 Hz, according to Grzesiek et al.,49 are in boldface and italics.
The computed values were obtained using the Karplus equation with optimized parameters given by Chou et al.36 The observed values36 for the vicinal coupling constants 3JN–Cγ and 3JC′–Cγ are in parentheses.
The 13Cα chemical shifts were computed as described in Methods section. The observed value for Thr-22, taken from the Biological Magnetic Resonance Data Bank under accession number 6457, is in parentheses.
The values reported were obtained from Model 1 of 1D3Z.
The values reported were obtained as an average over the new set of nine conformations derived from Model 1 of 1D3Z.25
The values reported were obtained as an average over the 10 conformations of 1D3Z.25
The values reported were obtained as an average over the 128 conformations of 1XQQ.21
Figure 8.
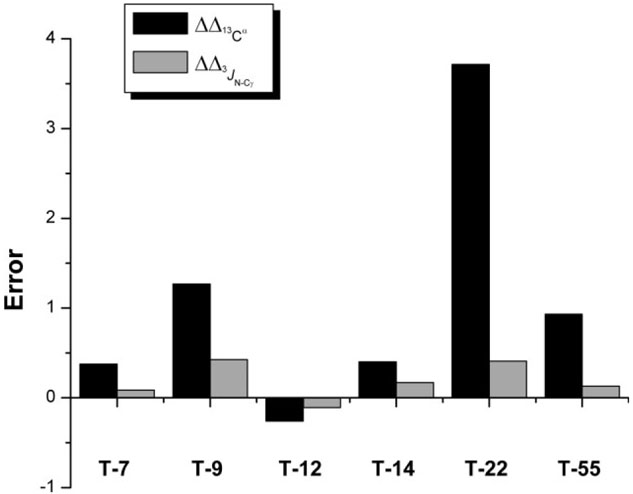
Black and Grey filled bars, respectively, indicate the value of the nn being the number of threonine residues in the sequence, m_1 means “from Model 1 of 1D3Z” and new_set means “from the average value of the set of nine new conformations.”
Caution should be exercised in comparing the 13Cα chemical shifts derived from the set of 9 new conformations with those from the 10 conformations of 1D3Z and the 128 conformations of 1XQQ, shown in Table I for Thr-22, because the 1D3Z and the 1XQQ ensembles differ not only in the side-chain χ1 torsional angle but, even more important, in the backbone (Ф, ψ) torsional angles whereas, in the earlier comparisons in this sub-section, the backbone was fixed to that of Model 1 of 1D3Z.
From a similar analysis, of the set of nine new conformations, for Val and Ile as that for Thr, we found that, among all of these residues, only four isoleucines, namely Ile-13, Ile-30, Ile-44, and Ile-61, show changes in the computed vicinal coupling constant greater than the experimental error (0.3 Hz). The χ1 torsional angles from the set of nine new conformations for residues Ile-13, Ile-44, and Ile-61 differs by more than 15° from that of Model 1, except for Ile-30 which differs by more than 10°. However, analysis of the remaining torsional angles (χ1 χ2, and χ3) for these residues also reveals differences greater than 10° for all these torsional angles and, hence, a correlation between changes of 3JC′–Cγ and 13Cα chemical shifts is not straightforward, as with Thr (which has only χ1 in its side chain), because the 13Cα chemical shifts, but not 3JC′–Cγ are influenced by all the torsional side-chain variations in Val and Ile.
Analysis of the standard deviations and side-chain mobility
The SD of the conformationally-averaged 13Cα chemical shifts, as given by Eq. (7), for the set of nine new conformations is a measure of side-chain mobility. Analysis of the Pearson correlation coefficient, R, computed for all the non-Pro/Gly/Ala residues in the sequence for the set of nine new conformations reveals good, although weak, agreement between the SD of the computed conformationally-averaged 13Cα chemical shifts and the SD of all heavy-atoms side-chain rmsd (R = 0.72). However, analysis for some individual amino acid residues shows a higher, although uneven, variation in the correlation coefficient, for example, Arg (R = 0.94), Lys (R = 0.94), Glu (R = 0.50), Asp (R = 0.54), Thr (R = 0.91), Ile (R = 0.80), Val (R = 0.96), and Gln (R = 0.95) [see Fig. 9(a–d), for Arg, Lys, Thr and Gln]. Analysis of the correlation for these individual residues deserves some consideration. First, for Glu and Asp (not shown in Fig. 9), removing one outlier in the data, namely Glu-16 and Asp-58, increases the correlation significantly, to R = 0.95 and R = 0.98, respectively. Second, the total number of residues of the same type for which the correlations are based is low, namely four (for Arg and Val), 5 (for Asp), six (for Glu and Gln), or seven (for Lys, Ile, and Thr). As a consequence, more research must be carried out before this conclusion about dispersion of the SD compared to that of the side-chain mobility, can be generalized to all the naturally occurring amino acid residues, except Pro, Gly, and Ala.
Figure 9.

Correlation between the standard deviations (SD) of the conformationally-averaged 13Cα chemical shifts (ppm) and the SD of the all heavy-atoms rmsd (Å) for (a) Arg, (b) Lys, (c) Thr, and (d) Gln.
CONCLUSIONS
The results of this work, based on the analysis of 139 conformations of ubiquitin at pH 6.5, indicating that use of neutral, rather than charged, amino acids is a significantly better approximation of the observed 13Cα chemi-cal shifts in solution for the acidic groups, and a slightly better representation, though significantly less expensive in computational time, for the basic groups. These conclusions validate, and generalize, previous results obtained for oligopeptides by Xu and Case12 for the basic groups. Additionally, our analyses also reveal a significantly greater deshielding of the 13Cα nucleus (due to the deprotonation of the acidic groups) than the shielding due to the protonation of the basic groups. The origin of such a difference can be found in the distance between the ionizable groups and the 13Cα nucleus, namely shorter for the acidic than for the basic groups.
Analysis of the side-chain effects of the set of nine new conformations, obtained from Model 1 of 1D3Z, illustrates that: (a) use of neutral, rather than charged, side-chains is a better approximation for the observed chemical shifts in solution, in agreement with the conclusion derived from the analysis of 139 conformations from 1D3Z, 1XQQ, and 1UBQ; (b) ~68% of the ionizable groups have a lower error, up to 3.2 ppm, than the corre-sponding error computed from Model 1 of 1D3Z; (c) such agreement does not change significantly, that is it drop to ~63%, when all non-Ala/Pro/Gly residues are taken into account; notably, the largest improvement in the error, that is, by 3.7 ppm, was observed for Thr-22; (d) the rmsd between computed and observed 13Cα chemical shifts, for each of these nine new conformations, is lower than the rmsd from Model 1 of 1D3Z (as shown in Fig. 6); and (e) the computed ca-rmsd (1.99 ppm) for this set of 9 new conformations is lower than the corresponding value computed for the 10 conformations of 1D3Z (2.3 ppm) or the 128 conformations of 1XQQ (2.1 ppm).1
For some amino acid residues of the set of nine new conformations, there is consistent agreement between the improvement in the calculated 13Cα chemical shifts and the results obtained from the analysis of the vicinal coupling constants 3JN–Cγ and 3JC′–Cγ.36 This was illustrated for all Threonines in the sequence. In particular for Thr-22, better results in terms of the vicinal coupling constant 3JN–Cγ were obtained for the set of 9 new conformations than for Model 1 of 1D3Z, for the 10 conformations of 1D3Z, or for the 128 conformations of 1XQQ. Consistently, a significantly lower error in the computation of 13Cα chemical shifts was also obtained for Thr-22. All these results are in agreement with previous conclusions derived from β-sheet model peptides,11 indicating the importance of a proper consideration of side-chain conformations for an accurate refinement of protein structure.
Given a fixed protein backbone, computation of accurate side-chain conformations is an important undertaking in an assortment of problems, such as protein-protein and protein-DNA interactions, protein docking, rational drug design, and so forth. 50–56 The ability to detect and accurately characterize the mobility of the surface side chains by computing 13Cα chemical shifts constitutes one of the strengths of the current methodology, and hence, it could also be an important tool for determining, refining and validating side-chain conformations in proteins.
ACKNOWLEDGMENTS
This research was conducted using the resources of: (1) two Beowulf-type clusters located at (a) the Instituto de Matemática Aplicada San Luis (CONICET-UNSL) and (b) the Baker Laboratory of Chemistry and Chemical Biology, Cornell University; and (2) the National Science Foundation Terascale Computing System at the Pittsburgh Supercomputer Center.
Grant sponsor: National Institutes of Health; Grant numbers: GM-14312, TW-6335, GM-24893; Grant sponsor: National Science Foundation; Grant number: MCB05-41633; Grant sponsor: National Research Council of Argentina (CONICET); Grant sponsor: FONCyT-ANPCyT; Grant number: PAE 22642/22672; Grant sponsor: Universidad Nacional de San Luis [UNSL], Argentina; Grant number: P-328501.
REFERENCES
- 1.Vila JA, Villegas ME, Baldoni HA, Scheraga HA. Predicting 13Cα chemical shifts for validation of protein structure. J Biomol NMR. 2007;38:221–235. doi: 10.1007/s10858-007-9162-x. [DOI] [PubMed] [Google Scholar]
- 2.Vila JA, Ripoll DR, Scheraga HA. Use of 13Cα chemical shifts in protein structure determination. J Phys Chem B. 2007;111:6577–6585. doi: 10.1021/jp0683871. [DOI] [PMC free article] [PubMed] [Google Scholar]
- 3.Spera S, Bax A. Empirical correlation between protein backbone conformation and Cα and Cβ13C nuclear magnetic resonance chemical shifts. J Am Chem Soc. 1991;113:5490–5492. [Google Scholar]
- 4.deDios AC, Pearson JG, Oldfield E. Secondary and tertiary structural effects on protein NMR chemical shifts: an ab initio approach. Science. 1993;260:1491–1496. doi: 10.1126/science.8502992. [DOI] [PubMed] [Google Scholar]
- 5.Kuszewski J, Qin JA, Gronenborn AM, Clore GM. The impact on direct refinement against 13Cα and 13Cβ chemical shifts on protein structure determination by NMR. J Magn Reson Ser B. 1995;106:92–96. doi: 10.1006/jmrb.1995.1017. [DOI] [PubMed] [Google Scholar]
- 6.Iwadate M, Asakura T, Williamson MP. Cα and Cβ carbon-13 chemical shifs in protein from an empirical database. J Biomol NMR. 1999;13:199–211. doi: 10.1023/a:1008376710086. [DOI] [PubMed] [Google Scholar]
- 7.Havlin RH, Le H, Laws DD, deDios AC, Oldfield E. An ab initio quantum chemical investigation of carbon-13 NMR shielding tensors in glycine, alanine, valine, isoleucine, serine, and threonine: comparisons between helical and sheet tensors, and effects of χ1 on shielding. J Am Chem Soc. 1997;119:11951–11958. [Google Scholar]
- 8.Pearson JG, Le H, Sanders LK, Godbout N, Havlin RH, Oldfield E. Predicting chemical shifts in proteins: structure refinement of valine residues by using ab initio and empirical geometry optimizations. J Am Chem Soc. 1997;119:11941–11950. [Google Scholar]
- 9.Xu X-P, Case DA. Automatic prediction of 15N, 13Cα, 13Cβ and 13C′ chemical shifts in proteins using a density functional database. J Biomol NMR. 2001;21:312–333. doi: 10.1023/a:1013324104681. [DOI] [PubMed] [Google Scholar]
- 10.Sun H, Sanders LK, Oldfield E. Carbon-13 NMR shielding in the twenty common amino acids: comparisons with experimental results in proteins. J Am Chem Soc. 2002;124:5486–5495. doi: 10.1021/ja011863a. [DOI] [PubMed] [Google Scholar]
- 11.Villegas ME, Vila JA, Scheraga HA. Effects of side-chain orientation on the 13C chemical shifts of antiparallel b-sheet model peptides. J Biomol NMR. 2007;37:137–146. doi: 10.1007/s10858-006-9118-6. [DOI] [PubMed] [Google Scholar]
- 12.Xu X-P, Case DA. Probing multiple effects on 15N, 13Cα, 13Cβ and 13C′ chemical shifts in peptides using density functional theory. Biopolymers. 2002;65:408–423. doi: 10.1002/bip.10276. [DOI] [PubMed] [Google Scholar]
- 13.Quirt AR, Lyerla JR, Jr, Peat IR, Cohen JS, Reynolds WF, Freedman MH. Carbon-13 nuclear magnetic resonance titration shifts in amino acids. J Am Chem Soc. 1974;96:570–574. doi: 10.1021/ja00809a038. [DOI] [PubMed] [Google Scholar]
- 14.Sayer TL, Rabenstein DL. Nuclear magnetic resonance studies of the acid-base chemistry of amino acids and peptides. III. Determination of the microscopic and macroscopic acid dissociation constants of α,ω-diaminocarboxylic acids. Can J Chem. 1976;54:3392–3400. [Google Scholar]
- 15.Rabenstein DL, Sayer TL. Carbon-13 shifts parameters for amines, carboxylic acids and amino acids. J Magn Res. 1976;24:27–39. [Google Scholar]
- 16.Surprenant HL, Sarneski JE, Key RR, Byrd JT, Reilley CN. Carbon-13 studies of amino acids: chemical shifts, protonation shifts, microscopic protonation behavior. J Magn Res. 1980;40:231–243. [Google Scholar]
- 17.Schwarzinger S, Kroon GJA, Foss TR, Wright PE, Dyson JH. Random coil chemical shifts in acidic 8 M urea: implementation of random coil shifts data in NMRView. J Biomol NMR. 2000;18:43–48. doi: 10.1023/a:1008386816521. [DOI] [PubMed] [Google Scholar]
- 18.Perrin DD. Dissociation constants of organic bases in aqueous solution: supplement. London: Butterworths; 1972. p. 402. [Google Scholar]
- 19.Laskowski M, Jr, Scheraga HA. Thermodynamic considerations of protein reactions: I. Modified reactivity of polar groups. J Am Chem Soc. 1954;76:6305–6319. [Google Scholar]
- 20.Neurath H, Greenstein JP, Putnam FW, Erickson JO. The chemistry of protein denaturation. Chem Rev. 1994;34:157–265. [Google Scholar]
- 21.Lindorff-Larsen K, Best RB, Depristo MA, Dobson CM, Vendruscolo M. Simultaneous determination of protein structure and dynamics. Nature. 2005;433:128–132. doi: 10.1038/nature03199. [DOI] [PubMed] [Google Scholar]
- 22.Ghosh SD, Mukhopadhyay C. Unfolding dynamics of the protein ubiquitin: insight from simulation. Phys Rev E. 2005;72:051928. doi: 10.1103/PhysRevE.72.051928. [DOI] [PubMed] [Google Scholar]
- 23.Muñoz V, Ghirlando R, Blanco FJ, Gouri SJ, Hofrichter J, Eaton WA. Folding and aggregation kinetics of a β-hairpin. Biochemistry. 2006;45:7023–7035. doi: 10.1021/bi052556a. [DOI] [PubMed] [Google Scholar]
- 24.Irbäck A, Mitternacht S. Thermal versus mechanical unfolding of ubiquitin. Proteins. 2006;65:759–766. doi: 10.1002/prot.21145. [DOI] [PubMed] [Google Scholar]
- 25.Cornilescu G, Marquardt JL, Ottiger M, Bax A. Validation of protein structure from anisotropic carbonyl chemical shifts in a dilute liquid crystalline phase. J Am Chem Soc. 1998;120:6836–6837. [Google Scholar]
- 26.Shang F, Deng G, Liu Q, Guo W, Hass AL, Crosas B, Finley D, Taylor A. Lys6-modified ubiquitin inhibits ubiquitin-dependent protein degradation. J Biol Chem. 2005;280:20365–20374. doi: 10.1074/jbc.M414356200. [DOI] [PMC free article] [PubMed] [Google Scholar]
- 27.Baboshina OV, Haas AL. Novel multiubiquitin chain linkages catalyzed by conjugatin enzymes E2EPF and RAD6 are recognized by 26 S proteasome subunit 5. J Biol Chem. 1966;271:2823–2831. doi: 10.1074/jbc.271.5.2823. [DOI] [PubMed] [Google Scholar]
- 28.Hofmann RM, Pickart CM. In vitro assembly and recognition of Lys-63 polyubiquitin chains. J Biol Chem. 2001;276:27936–27943. doi: 10.1074/jbc.M103378200. [DOI] [PubMed] [Google Scholar]
- 29.Sundd M, Robertson AD. Rearrangement of charge-charge interactions in variant ubiquitins as detected by double-mutant cycles and NMR. J Mol Biol. 2003;332:927–936. doi: 10.1016/s0022-2836(03)00995-1. [DOI] [PubMed] [Google Scholar]
- 30.Ripoll DR, Vorobjev YN, Liwo A, Vila JA, Scheraga HA. Coupling between folding and ionization equilibria: effects of pH on the conformational preferences of polypeptides. J Mol Biol. 1996;264:770–783. doi: 10.1006/jmbi.1996.0676. [DOI] [PubMed] [Google Scholar]
- 31.Vila JA, Ripoll DR, Arnautova YA, Vorobjev YN, Scheraga HA. Coupling between conformation and proton binding in proteins. Proteins. 2005;61:56–68. doi: 10.1002/prot.20531. [DOI] [PubMed] [Google Scholar]
- 32.Vorobjev YN, Scheraga HA, Hitz B, Honig B. Theoretical modeling of electrostatic effects of titratable side-chain groups on protein conformation in a polar ionic solution. 1. Potential of mean force between charged lysine residues and titration of poly(L-lysine) in 95-percent methanol solution. J Phys Chem. 1994;98:10940–10948. [Google Scholar]
- 33.Vorobjev YN, Scheraga HA, Honig B. Theoretical modeling of electrostatic effects of titratable side-chain groups on protein conformation in a polar ionic solution. 2. pH-induced helix-coil transition of poly(L-lysine) in water and methanol ionic-solutions. J Phys Chem. 1995;99:7180–7187. [Google Scholar]
- 34.Vorobjev YN, Scheraga HA. A fast adaptive multigrid boundary element method for macromolecule electrostatic computations in solvent. J Comp Chem. 1997;18:569–583. [Google Scholar]
- 35.Vijay-Kumar S, Bugg CE, Cook WJ. Structure of ubiquitin refined at 1.8 Å resolution. J Mol Biol. 1987;194:531–544. doi: 10.1016/0022-2836(87)90679-6. [DOI] [PubMed] [Google Scholar]
- 36.Chou JJ, Case DA, Bax A. Insights into the mobility of methyl-bearing side chains in proteins from 3JCC and 3JCN coupling. J Am Chem Soc. 2003;125:8959–8966. doi: 10.1021/ja029972s. [DOI] [PubMed] [Google Scholar]
- 37.Némethy G, Gibson KD, Palmer KA, Yoon CN, Paterlini G, Zagari A, Rumsey S, Scheraga HA. Energy parameters in polypeptides. 10. Improved geometrical parameters and nonbonded interactions for use in the ECEPP/3 algorithm, with application to proline-containing peptides. J Phys Chem. 1992;96:6472–6484. [Google Scholar]
- 38.Sitkoff D, Sharp KA, Honig B. Accurate calculation of hydration free energies using macroscopic solvent models. J Phys Chem. 1994;98:1978–1988. [Google Scholar]
- 39.Barth P, Alber T, Harbury PB. Accurate, conformation-dependent predictions of solvent effects on protein ionization constants. Proc Natl Acad Sci USA. 2007;104:4898–4903. doi: 10.1073/pnas.0700188104. [DOI] [PMC free article] [PubMed] [Google Scholar]
- 40.Edsall JT, Wyman J. Biophysical chemistry. Vol. 1. New York: Academic Press (Table IX); 1958. p. 536. [Google Scholar]
- 41.Vila JA, Ripoll DR, Baldoni HA, Scheraga HA. Unblocked statistical-coil tetrapeptides and pentapeptides in aqueous solution: a theoretical study. J Biomolecular NMR. 2002;24:245–262. doi: 10.1023/a:1021633403715. [DOI] [PubMed] [Google Scholar]
- 42.Chesnut DB, Moore KD. Locally dense basis sets for chemical shift calculations. J Comp Chem. 1989;10:648–659. [Google Scholar]
- 43.Hehre WJ, Radom L, Schleyer P, Pople JA. Ab initio molecular orbital theory. New York: Wiley; 1986. [Google Scholar]
- 44.Frisch MJ, Trucks GW, Schlegel HB, Scuseria GE, Robb MA, Cheeseman JR, Zakrzewski VG, Montgomery JA, Jr, Stratmann RE, Burant JC, Dapprich S, Millam JM, Daniels AD, Kudin KN, Strain MC, Farkas O, Tomasi J, Barone V, Cossi M, Cammi R, Mennucci B, Pomelli C, Adamo C, Clifford S, Ochterski J, Petersson GA, Ayala PY, Cui Q, Morokuma K, Malick DK, Rabuck AD, Raghavachari K, Foresman JB, Cioslowski J, Ortiz JV, Baboul AG, Stefanov BB, Liu G, Liashenko A, Piskorz P, Komaromi I, Gomperts R, Martin RL, Fox DJ, Keith T, Al-Laham MA, Peng CY, Nanayakkara A, Gonzalez C, Challacombe M, Gill PMW, Johnson B, Chen W, Wong MW, Andres JL, Gonzalez C, Head-Gordon M, Replogle ES, Pople JA. Pittsburgh PA: 1998. Gaussian 98, Revision A.7, Inc. [Google Scholar]
- 45.Wishart DS, Bigam CG, Yao J, Abildgaard F, Dyson HJ, Oldfield E, Markley JL, Sykes BD. 1H, 13C and 15N chemical shift referencing in biomolecular NMR. J Biomol NMR. 1995;6:135–140. doi: 10.1007/BF00211777. [DOI] [PubMed] [Google Scholar]
- 46.Ripoll DR, Scheraga HA. On the multiple-minima problem in the conformational analysis of polypeptides. II. An electrostatically driven Monte Carlo method—tests on poly(L-alanine) Biopolymers. 1988;27:1283–1303. doi: 10.1002/bip.360270808. [DOI] [PubMed] [Google Scholar]
- 47.Kruskal JB., Jr On the shortest spanning subtree of a graph and the traveling salesman problem. Proc Am Math Soc. 1956;7:48–50. [Google Scholar]
- 48.Wang Y, Jardetzky O. Probability-based protein secondary structure idenfication using combined NMR chemical-shift data. Protein Sci. 2002;11:852–861. doi: 10.1110/ps.3180102. [DOI] [PMC free article] [PubMed] [Google Scholar]
- 49.Grzesiek S, Vuister GW, Bax A. A simple and sensitive experiment for measurement of Jcc couplings between backbone carbonyl and methyl carbons in isotopically enriched proteins. J Biomol NMR. 1993;3:487–493. doi: 10.1007/BF00176014. [DOI] [PubMed] [Google Scholar]
- 50.Vásquez M. Modeling side-chain conformation. Curr Opin Struct Biol. 1996;6:217–221. doi: 10.1016/s0959-440x(96)80077-7. [DOI] [PubMed] [Google Scholar]
- 51.Tufféry P, Etchebest C, Hazaut S. Prediction of protein side chain conformations: a study on the influence of backbone accuracy on conformation stability in the rotamer space. Protein Eng. 1997;10:361–372. doi: 10.1093/protein/10.4.361. [DOI] [PubMed] [Google Scholar]
- 52.Huang ES, Koehl P, Levitt M, Pappu RV, Ponder JW. Accuracy of side-chain prediction upon near-native protein backbones generated by ab initio folding methods. Proteins. 1998;33:204–217. doi: 10.1002/(sici)1097-0134(19981101)33:2<204::aid-prot5>3.0.co;2-i. [DOI] [PubMed] [Google Scholar]
- 53.Wang C, Schueler-Furman O, Baker D. Improved side-chain modeling for protein-protein docking. Protein Sci. 2005;14:1328–1339. doi: 10.1110/ps.041222905. [DOI] [PMC free article] [PubMed] [Google Scholar]
- 54.Jain T, Cerutti DS, McCammon AJ. Configurational-bias sampling technique for predicting side-chain conformation in proteins. Protein Sci. 2006;15:2029–2039. doi: 10.1110/ps.062165906. [DOI] [PMC free article] [PubMed] [Google Scholar]
- 55.Xiang Z, Honig B. Extending the accuracy limits of prediction for side-chain conformations. J Mol Biol. 2001;11:421–430. doi: 10.1006/jmbi.2001.4865. [DOI] [PubMed] [Google Scholar]
- 56.Xiang Z, Steinbach PJ, Jacobson MP, Friesner RA, Honig B. Prediction of side-chain conformations on protein surfaces. Proteins. 2007;66:814–823. doi: 10.1002/prot.21099. [DOI] [PMC free article] [PubMed] [Google Scholar]