Abstract
Protein–protein interaction (PPI) maps provide insight into cellular biology and have received considerable attention in the post-genomic era. While large-scale experimental approaches have generated large collections of experimentally determined PPIs, technical limitations preclude certain PPIs from detection. Recently, we demonstrated that yeast PPIs can be computationally predicted using re-occurring short polypeptide sequences between known interacting protein pairs. However, the computational requirements and low specificity made this method unsuitable for large-scale investigations. Here, we report an improved approach, which exhibits a specificity of ∼99.95% and executes 16 000 times faster. Importantly, we report the first all-to-all sequence-based computational screen of PPIs in yeast, Saccharomyces cerevisiae in which we identify 29 589 high confidence interactions of ∼2 × 10⁷ possible pairs. Of these, 14 438 PPIs have not been previously reported and may represent novel interactions. In particular, these results reveal a richer set of membrane protein interactions, not readily amenable to experimental investigations. From the novel PPIs, a novel putative protein complex comprised largely of membrane proteins was revealed. In addition, two novel gene functions were predicted and experimentally confirmed to affect the efficiency of non-homologous end-joining, providing further support for the usefulness of the identified PPIs in biological investigations.
INTRODUCTION
Proteins are key biomolecules that often realize their functions by interacting with one another. Protein–protein interactions (PPIs) mediate various aspects in the structural and functional organization of a cell including multi-faceted responses to internal and external stimuli. Protein interaction networks have also been shown to possess topological and dynamic properties that may be essential for certain biological events (1,2). Thus, elucidating the complete network of PPIs is expected to garner a greater understanding of the biology of the cell.
The sequencing of the budding yeast Saccharomyces cerevisiae over a decade ago (3), along with its simple genetics which had made this yeast a model eukaryotic organism, led to its emergence as the organism of choice for large-scale functional genomics experiments including expression profiling (4) and identification of PPI networks (interactomes). The genome-wide analyses of yeast PPIs have predominantly relied on yeast-two hybrid (Y2H) and tandem affinity purification (TAP) tag methodologies. These techniques are both time and labor intensive and they both have high rates of false positive and false negative results associated with them [∼45% false positive rate for Y2H and 15–50% false positive rate for TAP tag (5)]. Additionally, these techniques may not be applied to all proteins without discrimination. In TAP tag, the double tag fusion to the target protein may interfere with the formation of some complexes or cause a mutant phenotype (6,7). In Y2H, not all proteins can be safely over-expressed and not all proteins can find their way into the nucleus, which is required for the successful detection via Y2H (8). Such limitations resulted in small overlaps between the PPI data collected using different approaches and even little reproducibility using the same method in different experiments (5,9). This lack of overlap suggests the presence of more undiscovered PPIs. Consequently, there is a growing need for the development of new and improved experimental and computational approaches to better uncover the yeast interactome.
Very recently, we (10,11) as well as others (12) reported that PPI's could be successfully detected from short polypeptide sequences within proteins. Our approach that we termed Protein-protein Interaction Prediction Engine, PIPE, was based on re-occurring short polypeptide sequenzces observed in a database of known interacting protein pairs. Although the original PIPE software was successful in identifying novel interactions, two issues precluded it from being used in a proteome-wide investigation to discover potential PPIs: (i) it was computationally expensive requiring hours of computation per protein pair and (ii) with a specificity of 89%, it would have generated a tremendous number of false positives if applied to all possible protein pairs in a proteome.
In this article, we describe our efforts to systematically investigate all potential yeast protein interaction pairs using an improved sequence-based computational method that executes 16 000 times faster and has a specificity of ∼99.95%. The goal of this investigation is to complement previous genome-wide experimental analyses of PPIs, leading to a more complete PPI map for yeast.
The PIPE portal is available at http://pipe.cgmlab.org/along with executable binaries, source code and our complete dataset.
MATERIALS AND METHODS
Computational advancements and analysis
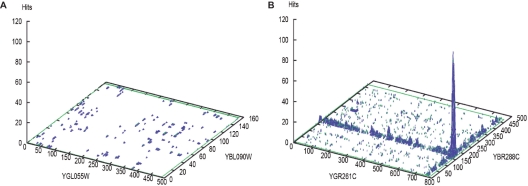
The PIPE method (10) estimates the likelihood of an interaction between a pair of target proteins by measuring the reoccurrence of short polypeptide sequences (referred to henceforth as windows) from protein pairs that are known to interact. To determine whether two given query proteins A and B interact, the proteins are scanned for similarity to a library of known interacting proteins pairs (X, Y). For each known interacting pair (X, Y), we compare protein A against X and protein B against Y by using sliding windows of a fixed size. PIPE measures how many times a window of A finds a match in X and at the same time a window in B matches a window in Y. These matches are counted and added up in a 2D matrix which reports for each pair of windows in A and B the number matches found among known interacting proteins. This 2D matrix is then plotted into a 3D landscape. Figure 1A shows an example of a landscape for a non-interacting pair and Figure 1B shows an interacting pair identified by ‘hills’ or ‘peaks’ in the landscape with scores greater than 10.
Figure 1.
Examples of landscape diagrams produced by PIPE. (A) The lack of ‘hills’ or ‘peaks’ above a value of 10 suggests no interactions. (B) A positive interaction indicated by a peak of 120.
The PIPE2 method presented in this article provides a significant improvement in computational speed and specificity over the original PIPE method (10), making possible the first global investigation of protein–protein interactions in yeast. Details about the improvements of the computational method are found in the Supplementary Data 1. In brief, PIPE2 incorporates two window comparison optimizations and one structural change over the initial algorithm. The first window comparison optimization converts the character-based amino acid representation to a binary representation (digital alphabet) speeding up lookups in the similarity matrix. The second window comparison optimization takes advantage of the fact that we are using sliding windows for our comparisons. Only updating the characters that are removed or added during one move of a window yields another significant improvement. Finally, many window comparisons were repeated in the original PIPE due to the way in which the original PIPE scans the interaction library. We solved this problem by pre-computing all these window comparisons in advance and storing them on local disk. This one-time pre-computation allows PIPE2 to lookup the answer of a comparison instead of computing it. Table 1 shows each change along with the average single-processor runtime per PPI prediction and the overall 16 150-fold performance improvement over the original PIPE implementation. These runtime numbers were obtained after running the program on the same set of 1000 randomly chosen protein pairs.
Table 1.
Successive performance improvement of PIPE to PIPE2. Using all improvements PIPE2 now runs more than 16 000 times faster than the original PIPE
| Version | Average Runtime (s) | Speedup |
|---|---|---|
| Original PIPE implementation | 6944.40 | 1× |
| +Digital alphabet optimization | 389.65 | 18× |
| +Sliding window optimization | 160.53 | 43× |
| +Pre-computation/Query approach (PIPE-2) | 0.43 | 16 150× |
The motivation for the pre-computation/query approach is to eliminate the repetition of the same window comparison throughout the evaluation of all possible protein pairs. We note that the tremendous performance improvement credited to the pre-computation/query approach in Table 1 does not take into account the time spent performing the one-time pre-computation of all possible window comparisons. However, this pre-computation time of ∼30 min is only a small percentage (1%) of the total all-to-all runtime (48 h on 76 processors). If one includes the one-time pre-computation then the performance improvement provided by our new approach is 14 775-fold.
We improved our threshold function and tuned our parameters by using a true positive set and a true negative set of 1274 pairs each. In order to better evaluate the specificity of PIPE2, a larger set of true negatives was needed. Therefore, we constructed a negative set of 100 000 randomly chosen pairs as explained in (13) that are not reported in either our database or in BioGRID (14). To evaluate the sensitivity of PIPE2, we used the true positive dataset of 1274 interactions by taking the intersection of reported PPIs from bioGRID (14), Krogan et al. (15) core data set and our original dataset for PIPE (10).
In contrast to our previous approach of applying a moving average filter, we apply a median filter, which effectively eliminates thin line regions (assumed false positives due to regions of low complexities) and maintains hill regions (assumed true positives). For a cell c in the matrix, a median filter evaluates the surrounding n × n values (n being the width of the filter and always being odd). Those n2 values are then sorted and the cell c is replaced by the median value (Figure S1A). Finally the average of every cell in the matrix is calculated and if that average is above a set cutoff value then there is an interaction reported (‘positive’).
During LOOCV testing, each of the 1274 positive pairs from the true positive dataset is removed individually from our PPI library prior to running that pair through PIPE2. Two types of experiments were performed: ‘No filter’ and ‘Filter + Average’. For the ‘No filter’ experiment the cutoff value was varied from 0.0 to 1.5 in 0.01 increments. In the ‘Filter + Average’ experiments the filter was varied from 3 × 3 to 11 × 11 and the cutoff value from 0.0 to 1.0 in 0.01 increments. The results of this experiment are illustrated in Figure S1B. As indicated in Figure S2, the combination of the median filter and application of a cutoff value on the average is important to achieve reasonable sensitivity rates. A filter size of 3 × 3 and a cutoff value of 0.45 were used for further analysis.
For the all-against-all experiment (∼20 M pairs), every pair was evaluated using PIPE2 with the optimal median filter design and average threshold applied. The experiment was run on a cluster of 38 dual-processor nodes (76× Intel Xeon 2.0 GHz, 1.5 GB RAM). The resulting interactome was compared with those generated by previous Y2H and TAP tag studies. The predicted PPIs were also evaluated in terms of sub-cellular localization, process and function from GO-SLIM annotation (ftp://genome-ftp.stanford.edu/pub/yeast/data_download/literature_curation/go_terms.tab) obtained from the Saccharomyces Genome Database (SGD) (16). The GO-SLIM categories for localization were collapsed as shown in Table S1. The PIPE2 program along with executable binaries and source code can be accessed through an online portal (http://pipe.cgmlab.org/). The portal works on the most common operating systems and web browsers and has been tested on Windows Vista SP1 (Internet Explorer 7.0, Mozilla Firefox 2.0.0.14, Safari 3.1.1), Windows XP SP2 (Internet Explorer 7.0), Linux Fedora 8 (Mozilla Firefox 2.0.0.14) and Mac OSX 10.5.2 (Safari 3.0.4, Safari 3.1.1).
Yeast manipulations
The yeast gene deletion strains are described in ref. (17). Plasmid repair analysis was performed as before using a modified p416 plasmid (18). Each experiment was repeated at least four times.
RESULTS
Genome-Wide (All-To-All) Sequence-Based Computational Screen of PPIs in S. cerevisiae
We ran all 19 867 056 possible pairs of S. cerevisiae proteins through PIPE2 in order to evaluate all possible interactions. This resulted in 29 589 pairs detected as positive interactions (listed in Table S2). Of these, a slight majority 15 151 (51.2%) have been previously reported, leaving 14 438 as novel interactions (listed in Table S2) that have not been previously reported in any of the databases of interacting proteins DIP (19), SGD (20) or BioGRID (14) at the time of the first run of our experiment (January 2007). Interestingly, since then, 373 of our 14 438 novel protein interactions (2.6%) have been added to BioGRID.
We then investigated the total number of interactions, average and maximum degree of nodes (interactions for each protein) and the number of unique proteins participating in interactions according to PIPE2, Gavin et al. (21), Krogan et al. (15) core data set, Ito et al. (22) and Uetz et al. (23) (Table S3). Compared against the TAP tag studies, proteins in the PIPE2 dataset have slightly more interaction partners on average (11.9) than Gavin et al. (8.9%) and approximately double the average found in Krogan et al. (5.25). It is also important to note the significantly increased number of unique proteins found in the PIPE2 dataset compared to Gavin et al. and Krogan et al. (∼3- and 2-folds, respectively). Similarly, when compared against Y2H studies, the PIPE2 dataset contains almost twice the number of unique proteins compared to Ito et al. and over five times more than Uetz et al. These observations may demonstrate one of the strengths of the PIPE2 approach: some PPIs that could not be processed by experimental methods can still be investigated by PIPE2.
Comparing PIPE2 data to those obtained by genome-wide experimental approaches
It has been previously reported that the overlap between various interaction maps obtained using different methods is very small (22,24,25). A comparison study carried out by Aloy and Russell in 2002 showed a low level of overlap among two-hybrid, affinity purification, mass spectrometry, and bioinformatics methods (25). Figure 2 shows the overlap between PIPE2 data and those of other genome-wide experimental studies. PIPE2 identifies 96.3% of Ito et al. (22) and 91.3% of Uetz et al. (23) reported interactions, while Uetz et al. cover only 4.32% of Ito et al. and 20.1% vice versa. Figure 2B presents the overlap between the PIPE2 results and TAP tag studies by Krogan et al. (15) and Gavin et al. (21). PIPE2 covers 48.6% of the interactions in Gavin et al. and 23.0% PPIs reported by Krogan et al. Gavin et al. contains 23.9% of Krogan et al. and 21.9% vice versa. Exclusion of PIPE2 data highlights the little overlap between the other databases especially between the data obtained by Y2H and TAP tag methods. For example Gavin et al. contains only 2.89% of the interactions found in Ito et al. and 1.53% vice versa (for overlap between Y2H and TAP, see Table S4).
Figure 2.
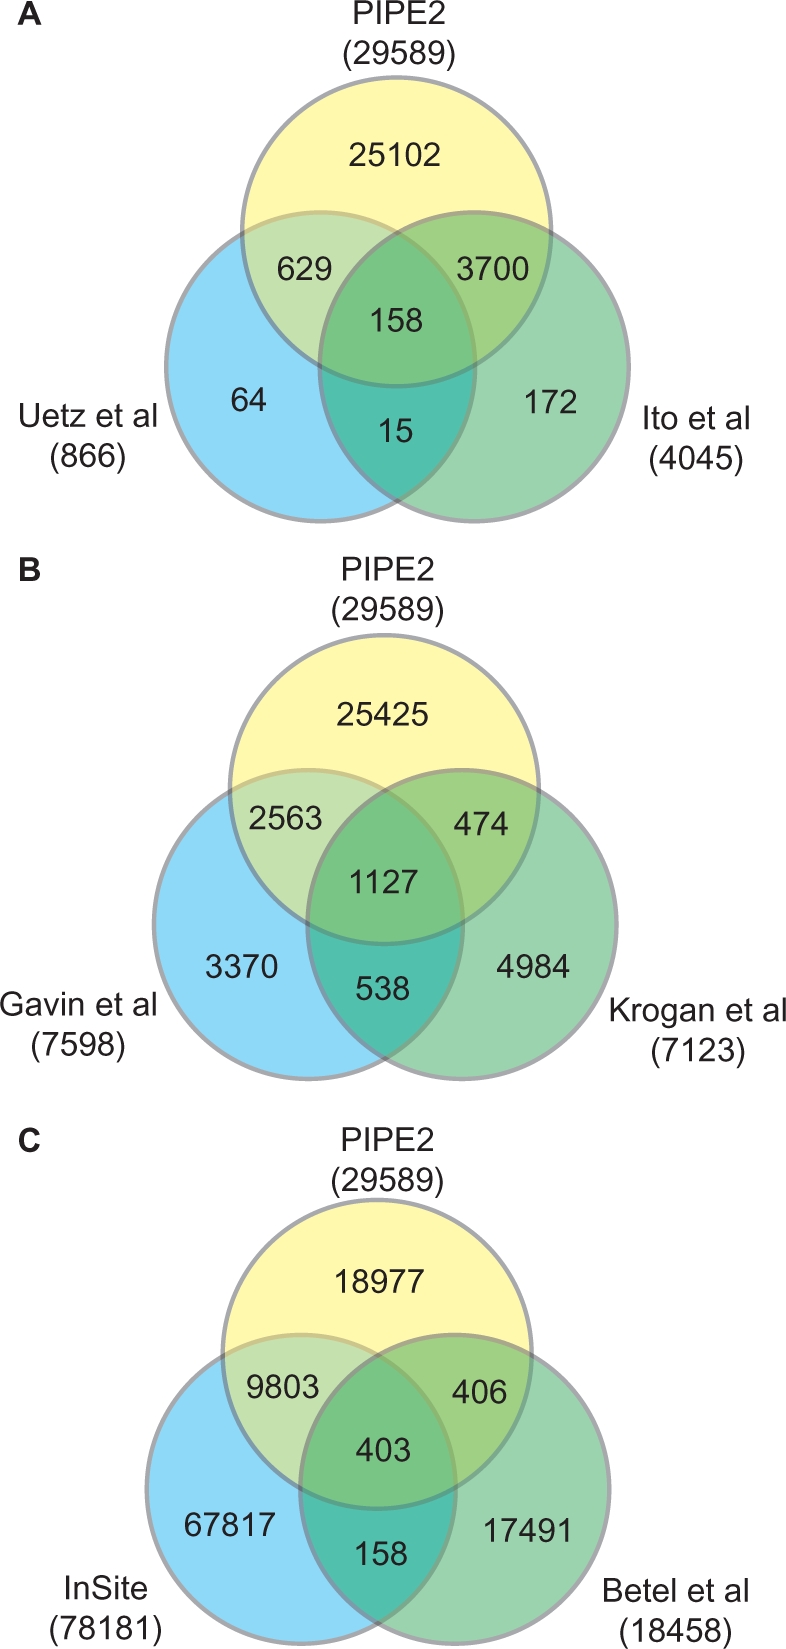
Comparing PIPE2 data to those obtained by (A) Y2H, (B) TAP tag experiments and (C) other computational approaches. The overlaps represent the number of interactions which are common between different databases. There seems to be a significant overlap between PIPE data and those of others. This overlap is even more notable for the data gathered using Y2H, which is similar to PIPE2, and designed to study an interaction between two target proteins. Comparing PIPE2 data to those obtained by other large-scale computational experiments. 34.5% of PIPE2 database is found in InSite but only 2.7% of PIPE2 database is shared with Betel et al. InSite and Betel et al. also share little overlap with 0.7% of Insite found in Betel et al.
Recently, other large-scale computational PPI experiments were published such as InSite (26) and Betel et al. (27) that attempt to predict PPIs in yeast. InSite bases its predictions on a set of affinity parameters between pairs of motifs or domains for the query proteins. The published InSite database contains 78 181 protein interactions between 4450 proteins. However, the lack of a clear specificity for InSite makes the interpretation of this database very difficult. As discussed earlier, large-scale PPI scans without a very high specificity can have a very large number of false positives. The Betel et al. method uses domain–motif interactions based on structure templates of domains of interest. Their database contains 18 458 interactions between 2311 proteins.
As indicated in Figure 2C, PIPE2 data seems to have a better overlap with InSite but less so with Betel et al. (34.5% and 2.7% respectively). This may not be a surprising observation as the method behind InSite that uses affinities between different motifs, has more resemblance to that of PIPE2 that uses re-occurrence of short polypeptide sequences. For the most part Betel et al. utilize known domains within structural data with limited availability of detailed binding information. This may explain the small overlap between Betel et al. and PIPE2 which does not utilize such predefined information. It should be noted that InSite also has very little overlap with Betel et al. (0.7%).
Cellular co-localization of predicted interactors
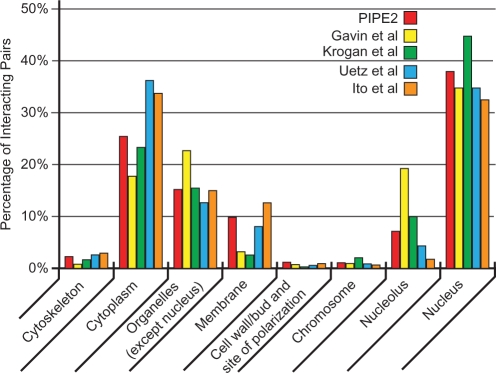
Localization information in the form of GO Slim annotation was obtained from SGD (16). Figure 3 shows the percentage of identified PPIs that were co-localized in the nucleus (37.94%), cytoplasm (25.41%), organelles (except nucleus, 15.19%), membrane (9.84%), etc. Figure 3 also shows a comparison of these numbers with Gavin et al., Krogan et al., Uetz et al. and Ito et al. which indicates that the overall pattern for co-localized protein pairs is very similar for all the datasets including PIPE2.
Figure 3.
Co-localization percentage of predicted interactors for PIPE2 and high throughput experiments. The overall pattern for co-localized protein pairs is very similar for all datasets.
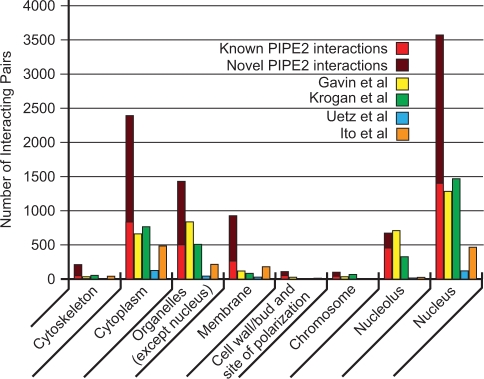
Figure 4 compares the absolute numbers of co-localization across PIPE2 predictions in comparison with large-scale experimental approaches. The total number of co-localized pairs for each dataset is as follows: 9412 for PIPE2, 3692 for Gavin et al., 3283 for Krogan et al., 348 for Uetz et al. and 1435 for Ito et al. (Table S5). Furthermore, Figure 4 shows for each location the number of novel co-localized PIPE2 interactions in comparison with the number of previously known co-localized interactions (union of other datasets), which is now reported by PIPE2. A large number of novel co-localized interactions are found for the nucleus and cytoplasm. In fact, according to PIPE2 it seems that the majority of the PPIs take place in the nucleus followed by the cytoplasm in a cell. PIPE2 generates more co-localized interactions than the experimental methods in seven out of eight categories. PIPE2 predicts almost 4.5 times more interactions in membrane over that with the second highest count (Ito et al.).
Figure 4.
Co-localization of predicted interactors for PIPE2 and high throughput experiments. The location of interacting pairs does not seem to affect the ability of PIPE2 to predict an interaction. Besides nucleolus, PIPE2 predicted more interactions in all other cellular locations. PIPE2 detected almost 4.5 times more interactions in membrane than the second highest count (Ito et al.). PIPE2 data is divided to two categories of novel, and those that overlap with the union of others.
The percentage of interacting pairs which had different (non-matching) locations in the PIPE2 interaction list is ∼38.4%. This is similar to the other experimental datasets: 33.9% for Gavin et al., 30.17% for Krogan et al., 34.51% for Uetz et al. and 36.65% for Ito et al. Due to the incomplete and error-prone location data there is no reason to suspect that these interactions are any less valid than the co-localized interactions.
Investigating the validity of the identified PPIs
Interacting proteins generally participate in functionally related processes (28,29). Consequently, sharing functional properties may provide further validations for the predicted interactors. To investigate the validity of observed interactions, we randomly selected three sets of one hundred (3 × 100) protein pairs from the 14 438 novel PIPE2 interactions. We then investigated primary literature to manually determine the common functional information for each pair. The results of this analysis are shown in Table S6. It was observed that 20, 22 and 17 interacting pairs in the three selected sets of novel protein pairs, respectively, also had a previously reported functional relationship. Hence, 59 of the possible set of 300 novel interactions detected by PIPE2, or 20%, can also be supported by a functional relationship. Similarly, a second potential line of validation for an interaction might be that the interacting proteins often have common interactors (common third protein interaction) (10,30). Our manual survey of interaction databases from primary literature indicated that 49, 45 and 46 protein pairs among the three selected sets of novel interactions, respectively, had previously reported common interactions with at least one other protein (Table S6). Hence, 140 of the possible set of 300 novel interactions detected by PIPE, or 47%, can also be supported by a previously reported common interaction. Altogether, 39 of the 300 novel pairs, or 13%, were supported by both a functional relationship and the presence of a third common interacting partner (Table S6). Similarly 199 of the 300 interactions, or 66%, were supported by at least one of the investigated additional lines of evidence. A complete list of the protein pairs used for these analyses is presented in Table S6.
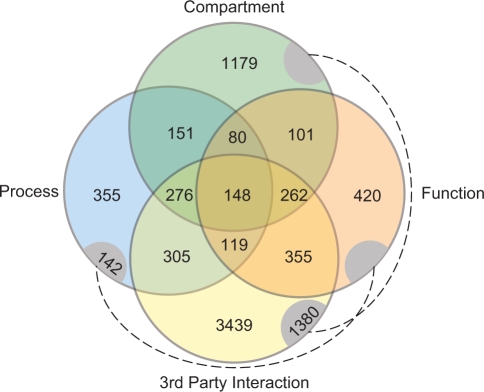
We then use GO-SLIM annotation and SGD database to investigate the entire set of 14 438 novel PPIs detected by PIPE2 for the presence of a relationship between the interacting partners which may support the validity of an interaction (Figure 5). The investigated information included sub-cellular localization (compartment), cellular process, molecular function and common third party protein interaction. Each of these common features is represented by a different circle in Figure 5 and the overlaps indicate the number of pairs that share additional features. As indicated 8712 novel interactions (total number of interactions shown in Figure 5), or 60% (100 × [novel interactions with at least one common feature]/[total novel interactions] or 100 × 8712/14 438), possess at least one common feature for the novel interacting proteins. Similarly, 3319 (overlaps between two or more circles), 885 (three or more circles), and 148 (four circles) protein pairs showed at least two, three and four common features, respectively (Figure 5). The complete lists of the protein interactions that fall in each category are presented in Table S7. These categories of the novel PPIs may also be used by researchers to prioritize their confidence in the predicted interactions.
Figure 5.
Analysis of PIPE2 novel interactions by compartment, function, process and third common protein interaction. A different circle represents each feature. Protein pairs represented here (8721) indicate those that share at least one common feature (of 14 438 total novel pairs). Overlaps represent additional common features. Dashed lines connect overlapping areas for compartment-third party interaction and process-function.
PIPE2 data can reveal novel protein complexes
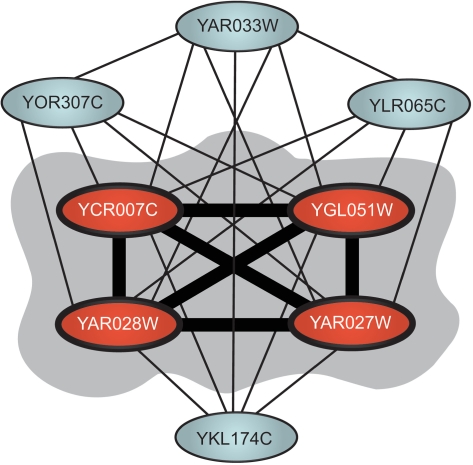
Protein complexes are formed from the interaction of two or more functionally related proteins to carry out a specific cellular function. More than 500 protein complexes have been previously reported in yeast (7). It is estimated that this number might in fact be closer to 800 (8). Consequently, there may remain many complexes, which are yet to be identified. Here we have identified over 14 000 novel interactions. Therefore it might be expected that this information can be used to determine new members of previously determined complexes or to discover novel protein complexes. In particular, membrane proteins often provide a challenge for the experimental PPI identification methods. PIPE2 novel predictions revealed that four characterized or putative membrane proteins belonging to the family of DUP240 proteins, YGL051W, YAR027W, YAR028W and YCR007C interact with each other and with four other proteins YAR033W, YOR307C, YLR065C and YKL174, and form a four-member core for a complex of eight interacting proteins (Figure 6). DUP240 proteins form a family of trans-membrane proteins, which are believed to be involved in vesicle formation (31,32). YAR033W is another member of the DUP240 family. YOR307C and YKL174C are two vesicle-associated proteins, and YLR065C is an uncharacterized open reading frame of unknown function. Such common functional properties of these proteins may provide further support for the predicted interactions. Further, based on the novel interactions that PIPE2 predicted for YLR065C, it can be hypothesized that YLR065C may have a putative role in vesicle formation or function. In agreement with this hypothesis, it has been shown that YLR065C in combination with either YGL020C or YER083C results in a synthetic lethal genetic interaction, both of which are reported to be involved in retrograde vesicle-mediated transport from Golgi to endoplasmic reticulum (33,34).
Figure 6.
A novel yeast complex revealed from PIPE2 data. YAR027W, YGL051W, YCR007C and YAR028W interact with each other as well as all other proteins and may represent the core of the complex. Besides YLR065C, which is uncharacterized, all other proteins are thought to be involved in vesicle formation or function. Consequently, these interactions may also suggest a vesicle associated role for YLR065C.
Novel biological information can be extracted from PIPE2 data
Non-homologous end-joining (NHEJ) is a DNA repair mechanism by which the two ends of a double-stranded DNA break (DSB) rejoin in the absence of a significant homologous template. A number of different proteins and processes have been shown to affect the efficiency of NHEJ in S. cerevisiae and other eukaryotes. This number is continuously growing (18,35,36).
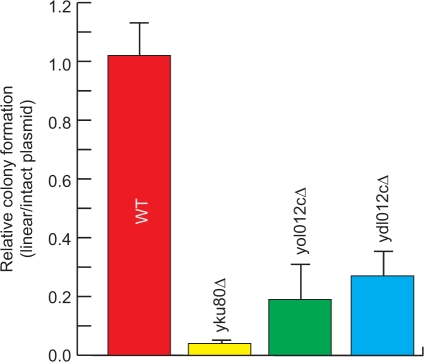
To further investigate the biological relevance of PIPE2 data, we studied PIPE2's novel PPIs to discover potential gene candidates that may be involved in NHEJ. We observed that YDL012C and YOL012C form novel interactions with YMR106C (Yku80), a key factor in NHEJ (37) and YLR442C (Sir3), also known to affect the efficiency of NHEJ (38). YDL012C is an uncharacterized open reading frame and YOL012C is a histone variant involved in regulation of transcription and chromatin silencing (39). Neither of these proteins has been directly linked to NHEJ. To examine a possible role for YDL012C and YOL012C in NHEJ, we subjected their gene deletion yeast strains to a plasmid repair assay analysis as previously described (35,40). It was observed that in the absence of YDL012C and YOL012C, yeast cells had reduced efficiency in repairing linearized plasmid (Figure 7). These observations suggest that both YDL012C and YOL012C affect the efficiency of NHEJ. These data further indicate that novel biologically meaningful information can be extracted from PPI data gathered by PIPE2. It should also be noted that further investigation is required to elucidate the mechanism by which these two proteins affect NHEJ.
Figure 7.
Plasmid repair efficiencies of yeast deletion mutants. The ratio of the number of colonies formed after transformation with linearized plasmid to that formed with the intact plasmid is used to represent the efficiency of NHEJ. This ratio for yku80Δ, yol012cΔ and ydl012cΔ is 0.04 ± 0.01, 0.19 ± 0.12 and 0.27 ± 0.08, respectively. Each experiment is repeated at least four times. Yku80 is a key factor in NHEJ and its deletion strain (yku80Δ) is used as a positive control. WT is the wild-type strain.
Improvement of the computational method
A global (all-to-all) sequence-based computational screen of PPIs in yeast would have been impossible with the original PIPE methods. Even on large processor clusters, it would have taken several decades of computation. In the Optimizing Window Comparisons and Pre-Computation & Query Approach sections in Materials and Methods, we outline algorithmic improvements that led to a 16 150-fold performance improvement of our PIPE method. This enabled us to perform the first all-to-all (∼20 M pairs) sequence-based computational screen of PPIs in yeast in approximately two days of computation time.
A very high specificity is crucial for a meaningful global (all-to-all) sequence-based computational screen of PPIs. For example, our original PIPE method (89% specificity) would have reported 2 200 000 false positives, which is clearly unacceptable. For a negative set of 100 000 protein pairs, PIPE2 correctly identified 99 946 as true negatives (54 false positives) yielding a 99.95% specificity. For a true positive dataset of 1274 interactions, PIPE2 correctly identified 186 pairs as true positives (1088 false negative), which results in a sensitivity of 14.6%. It should be noted that it is also possible to adjust the parameters filter size and average cutoff (see Materials and Methods section) to increase the sensitivity at the expense of lowering the specificity. For example, if we are willing to accept 90% specificity, we can increase the sensitivity to ∼55% by changing the average cutoff. This might be useful for evaluating small numbers of protein pairs.
DISCUSSION
The 16 150-fold performance increases to the PIPE program made possible the first all-to-all sequence comparison based on re-occurring motifs leading to over 14 000 new yeast PPI interactions. PIPE2 can on average predict the interactions for two protein pairs per second, allowing to run an all-to-all experiment on S. cerevisiae (∼6300 proteins, ∼20 M pairs) in ∼2 days (this is of course excluding the time for parameter tuning and pre-computation analysis). The reduced computational requirements also allowed us to refine our method by running thousands of pairs of known positives and negatives. This enabled us to revise our threshold function for determining whether or not a pair interacts, thereby increasing the specificity to 99.95%. This is critical when running a large number of pairs since a large number of false positives will be generated even if the specificity is relatively high. When evaluating only 100 pairs, the 89% specificity of the original PIPE is expected to generate 11 false positives, but for 20M pairs the original PIPE would have reported ∼2 200 000 false positives, which is unacceptable for large-scale investigations. PIPE2 solves this problem.
PIPE2 identified ∼14 000 novel interactions. This may stem from the ability of PIPE2 to investigate all proteins without discrimination. This is a major advantage of PIPE2 over TAP tag and Y2H methods where not all proteins can be subjected to analysis (see above). An example of this is seen in Figure 4, where a significant number of membrane proteins have been identified in the PIPE2-generated interactome. Because of their inherent properties, applying TAP tag and Y2H analysis to membrane proteins has proven to be challenging. PIPE2 analysis also had a high level of success in identifying PPIs in the nucleus. This might be explained by the presence of a high number of essential proteins in the nucleus, which may not be readily manipulated by Y2H or TAP tag analyses. An area where PIPE analysis had a relatively low level of success was for nucleolus proteins; see Figure 4. It appears that TAP tag experiments by Gavin et al. (17) had a significantly higher relative success in identifying these interactions. The nucleolus is the site of ribosomal RNA synthesis and biogenesis. One possible explanation therefore may be that the relatively high number of protein complexes at work in this region (both protein–protein and protein–RNA–protein) may result in an inflated number of interactions detected by TAP tag. This is mainly due to the inability of TAP tag to readily differentiate between direct and indirect (via a third partner) PPIs.
Note that, in order to avoid too many false positives for the all-to-all experiment on S. cerevisiae (∼6300 proteins, ∼ 20M pairs), PIPE2 was chosen to operate at a rather low sensitivity level of 14.6%. Even at that low sensitivity level, PIPE2 identified thousands of novel interactions with high confidence (99.95% specificity). However, when processing smaller sets of protein pairs, it is easy to increase the sensitivity of PIPE2 at the expense of specificity if the user requires it. For example, 90% specificity yields a sensitivity of 55%. The PIPE portal at http://pipe.cgmlab.org/allows to execute PIPE2 at various levels of sensitivity and specificity.
A significant limitation of PIPE2 is that it relies exclusively on a library of pre-existing experimentally derived interaction data for the identification of re-occurring short polypeptide sequences. Consequently, in the absence of sufficient data for an interacting short polypeptide sequence pair, PIPE2 will be ineffective. PIPE2 will also be less effective for motifs that span discontinuous primary sequence, as it does not account for gaps within the short polypeptide sequences. It is expected that the use of more refined algorithms that permit such gaps, along with an increasing number of available libraries of PPIs may increase the accuracy of PIPE2.
Increasing availability of three-dimensional protein structures may also provide an improved starting dataset for PIPE2 analysis, which may result in a further increase in the accuracy of this tool. Another possible future direction is to reduce the rate of false positives by incorporating vigorous filters that consider other information about the target protein pairs, including sub-cellular localization or functional annotation.
The PPI data presented here represent the first computer-based all-to-all interaction prediction data in any organism. These data complement the previous large-scale experimental PPI analyses in yeast and are expected to lead to a more complete PPI map for this organism. The data are also expected to help future studies on individual proteins as well as systems biology.
SUPPLEMENTARY DATA
Supplementary Data are available at NAR Online.
ACKNOWLEDGEMENTS
This study was funded by Natural Sciences and Engineering Research Council of Canada (NSERC); National Institutes of Health (P20 MD001089-02 to A.C.); NCMHD; Department of Health and Human Services. The authors would like to thank Chris Kiani for excellent technical assistance and Joanna Freedman for excellent editorial work. Funding to pay the Open Access publication charges for this article was provided by NSERC.
Conflict of interest statement. None declared.
REFERENCES
- 1.Jeong H, Mason SP, Barabasi AL, Oltvai ZN. Lethality and centrality in protein networks. Nature. 2001;411:41–42. doi: 10.1038/35075138. [DOI] [PubMed] [Google Scholar]
- 2.Han JD, Bertin N, Hao T, Goldberg DS, Berriz GF, Zhang LV, Dupuy D, Walhout AJ, Cusick ME, Roth FP, et al. Evidence for dynamically organized modularity in the yeast protein-protein interaction network. Nature. 2004;430:88–93. doi: 10.1038/nature02555. [DOI] [PubMed] [Google Scholar]
- 3.Goffeau A, Barrell BG, Bussey H, Davis RW, Dujon B, Feldmann H, Galibert F, Hoheisel JD, Jacq C, Johnston M, et al. Life with 6000 genes. Science. 1996;274:563–547. doi: 10.1126/science.274.5287.546. 546. [DOI] [PubMed] [Google Scholar]
- 4.Ghaemmaghami S, Huh WK, Bower K, Howson RW, Belle A, Dephoure N, O'Shea EK, Weissman JS. Global analysis of protein expression in yeast. Nature. 2003;425:737–741. doi: 10.1038/nature02046. [DOI] [PubMed] [Google Scholar]
- 5.Edwards AM, Kus B, Jansen R, Greenbaum D, Greenblatt J, Gerstein M. Bridging structural biology and genomics: assessing protein interaction data with known complexes. Trends Genet. 2002;18:529–536. doi: 10.1016/s0168-9525(02)02763-4. [DOI] [PubMed] [Google Scholar]
- 6.Werler PJ, Hartsuiker E, Carr AM. A simple Cre-loxP method for chromosomal N-terminal tagging of essential and non-essential Schizosaccharomyces pombe genes. Gene. 2003;304:133–141. doi: 10.1016/s0378-1119(03)00402-5. [DOI] [PubMed] [Google Scholar]
- 7.Gavin AC, Bosche M, Krause R, Grandi P, Marzioch M, Bauer A, Schultz J, Rick JM, Michon AM, Cruciat CM, et al. Functional organization of the yeast proteome by systematic analysis of protein complexes. Nature. 2002;415:141–147. doi: 10.1038/415141a. [DOI] [PubMed] [Google Scholar]
- 8.Goll J, Uetz P. The elusive yeast interactome. Genome Biol. 2006;7:223. doi: 10.1186/gb-2006-7-6-223. [DOI] [PMC free article] [PubMed] [Google Scholar]
- 9.Hart GT, Ramani AK, Marcotte EM. How complete are current yeast and human protein-interaction networks? Genome Biol. 2006;7:120. doi: 10.1186/gb-2006-7-11-120. [DOI] [PMC free article] [PubMed] [Google Scholar]
- 10.Pitre S, Dehne F, Chan A, Cheetham J, Duong A, Emili A, Gebbia M, Greenblatt J, Jessulat M, Krogan N, et al. PIPE: a protein-protein interaction prediction engine based on the re-occurring short polypeptide sequences between known interacting protein pairs. BMC Bioinformatics. 2006;7:365. doi: 10.1186/1471-2105-7-365. [DOI] [PMC free article] [PubMed] [Google Scholar]
- 11.Pitre S, Alamgir M, Green JR, Dumontier M, Dehne F, Golshani A. Computational Methods For Predicting Protein-Protein Interactions. Adv. Biochem. Eng. Biotechnol. 2008 doi: 10.1007/10_2007_089. [Epub ahead of print; January 18 2008]. [DOI] [PubMed] [Google Scholar]
- 12.Lehrach WP, Husmeier D, Williams CK. A regularized discriminative model for the prediction of protein-peptide interactions. Bioinformatics. 2006;22:532–540. doi: 10.1093/bioinformatics/bti804. [DOI] [PubMed] [Google Scholar]
- 13.Ben-Hur A, Noble WS. Choosing negative examples for the prediction of protein-protein interactions. BMC Bioinformatics. 2006;7(Suppl. 1):S2. doi: 10.1186/1471-2105-7-S1-S2. [DOI] [PMC free article] [PubMed] [Google Scholar]
- 14.Stark C, Breitkreutz BJ, Reguly T, Boucher L, Breitkreutz A, Tyers M. BioGRID: a general repository for interaction datasets. Nucleic Acids Res. 2006;34:D535–D539. doi: 10.1093/nar/gkj109. [DOI] [PMC free article] [PubMed] [Google Scholar]
- 15.Krogan NJ, Cagney G, Yu H, Zhong G, Guo X, Ignatchenko A, Li J, Pu S, Datta N, Tikuisis AP, et al. Global landscape of protein complexes in the yeast Saccharomyces cerevisiae. Nature. 2006;440:637–643. doi: 10.1038/nature04670. [DOI] [PubMed] [Google Scholar]
- 16.Dwight SS, Harris MA, Dolinski K, Ball CA, Binkley G, Christie KR, Fisk DG, Issel-Tarver L, Schroeder M, Sherlock G, et al. Saccharomyces Genome Database (SGD) provides secondary gene annotation using the Gene Ontology (GO) Nucleic Acids Res. 2002;30:69–72. doi: 10.1093/nar/30.1.69. [DOI] [PMC free article] [PubMed] [Google Scholar]
- 17.Winzeler EA, Shoemaker DD, Astromoff A, Liang H, Anderson K, Andre B, Bangham R, Benito R, Boeke JD, Bussey H, et al. Functional characterization of the S. cerevisiae genome by gene deletion and parallel analysis. Science. 1999;285:901–906. doi: 10.1126/science.285.5429.901. [DOI] [PubMed] [Google Scholar]
- 18.Jessulat M, Alamgir M, Salsali H, Greenblatt J, Xu J, Golshani A. Interacting proteins Rtt109 and Vps75 affect the efficiency of non-homologous end-joining in Saccharomyces cerevisiae. Arch. Biochem. Biophys. 2007;469:157–164. doi: 10.1016/j.abb.2007.11.001. [DOI] [PubMed] [Google Scholar]
- 19.Xenarios I, Salwinski L, Duan XJ, Higney P, Kim SM, Eisenberg D. DIP, the Database of Interacting Proteins: a research tool for studying cellular networks of protein interactions. Nucleic Acids Res. 2002;30:303–305. doi: 10.1093/nar/30.1.303. [DOI] [PMC free article] [PubMed] [Google Scholar]
- 20.Christie KR, Weng S, Balakrishnan R, Costanzo MC, Dolinski K, Dwight SS, Engel SR, Feierbach B, Fisk DG, Hirschman JE, et al. Saccharomyces Genome Database (SGD) provides tools to identify and analyze sequences from Saccharomyces cerevisiae and related sequences from other organisms. Nucleic Acids Res. 2004;32:D311–D314. doi: 10.1093/nar/gkh033. [DOI] [PMC free article] [PubMed] [Google Scholar]
- 21.Gavin AC, Aloy P, Grandi P, Krause R, Boesche M, Marzioch M, Rau C, Jensen LJ, Bastuck S, Dumpelfeld B, et al. Proteome survey reveals modularity of the yeast cell machinery. Nature. 2006;440:631–636. doi: 10.1038/nature04532. [DOI] [PubMed] [Google Scholar]
- 22.Ito T, Chiba T, Ozawa R, Yoshida M, Hattori M, Sakaki Y. A comprehensive two-hybrid analysis to explore the yeast protein interactome. Proc. Natl Acad. Sci. USA. 2001;98:4569–4574. doi: 10.1073/pnas.061034498. [DOI] [PMC free article] [PubMed] [Google Scholar]
- 23.Uetz P, Giot L, Cagney G, Mansfield TA, Judson RS, Knight JR, Lockshon D, Narayan V, Srinivasan M, Pochart P, et al. A comprehensive analysis of protein-protein interactions in Saccharomyces cerevisiae. Nature. 2000;403:623–627. doi: 10.1038/35001009. [DOI] [PubMed] [Google Scholar]
- 24.Franzot G, Carugo O. Computational approaches to protein-protein interaction. J. Struct. Funct. Genomics. 2003;4:245–255. doi: 10.1023/b:jsfg.0000016143.91973.1c. [DOI] [PubMed] [Google Scholar]
- 25.Aloy P, Russell RB. The third dimension for protein interactions and complexes. Trends Biochem. Sci. 2002;27:633–638. doi: 10.1016/s0968-0004(02)02204-1. [DOI] [PubMed] [Google Scholar]
- 26.Wang H, Segal E, Ben-Hur A, Li QR, Vidal M, Koller D. InSite: a computational method for identifying protein-protein interaction binding sites on a proteome-wide scale. Genome Biol. 2007;8:R192. doi: 10.1186/gb-2007-8-9-r192. [DOI] [PMC free article] [PubMed] [Google Scholar]
- 27.Betel D, Breitkreuz KE, Isserlin R, Dewar-Darch D, Tyers M, Hogue CW. Structure-templated predictions of novel protein interactions from sequence information. PLoS Comput. Biol. 2007;3:1783–1789. doi: 10.1371/journal.pcbi.0030182. [DOI] [PMC free article] [PubMed] [Google Scholar]
- 28.Wood A, Krogan NJ, Dover J, Schneider J, Heidt J, Boateng MA, Dean K, Golshani A, Zhang Y, Greenblatt JF, et al. Bre1, an E3 ubiquitin ligase required for recruitment and substrate selection of Rad6 at a promoter. Mol. Cell. 2003;11:267–274. doi: 10.1016/s1097-2765(02)00802-x. [DOI] [PubMed] [Google Scholar]
- 29.Krogan NJ, Dover J, Wood A, Schneider J, Heidt J, Boateng MA, Dean K, Ryan OW, Golshani A, Johnston M, et al. The Paf1 complex is required for histone H3 methylation by COMPASS and Dot1p: linking transcriptional elongation to histone methylation. Mol. Cell. 2003;11:721–729. doi: 10.1016/s1097-2765(03)00091-1. [DOI] [PubMed] [Google Scholar]
- 30.Butland G, Krogan NJ, Xu J, Yang WH, Aoki H, Li JS, Krogan N, Menendez J, Cagney G, Kiani GC, et al. Investigating the in vivo activity of the DeaD protein using protein-protein interactions and the translational activity of structured chloramphenicol acetyltransferase mRNAs. J. Cell. Biochem. 2007;100:642–652. doi: 10.1002/jcb.21016. [DOI] [PubMed] [Google Scholar]
- 31.Poirey R, Despons L, Leh V, Lafuente MJ, Potier S, Souciet JL, Jauniaux JC. Functional analysis of the Saccharomyces cerevisiae DUP240 multigene family reveals membrane-associated proteins that are not essential for cell viability. Microbiology. 2002;148:2111–2123. doi: 10.1099/00221287-148-7-2111. [DOI] [PubMed] [Google Scholar]
- 32.Sandmann T, Herrmann JM, Dengjel J, Schwarz H, Spang A. Suppression of coatomer mutants by a new protein family with COPI and COPII binding motifs in Saccharomyces cerevisiae. Mol. Biol. Cell. 2003;14:3097–3113. doi: 10.1091/mbc.E02-11-0736. [DOI] [PMC free article] [PubMed] [Google Scholar]
- 33.Schuldiner M, Collins SR, Thompson NJ, Denic V, Bhamidipati A, Punna T, Ihmels J, Andrews B, Boone C, Greenblatt JF, et al. Exploration of the function and organization of the yeast early secretory pathway through an epistatic miniarray profile. Cell. 2005;123:507–519. doi: 10.1016/j.cell.2005.08.031. [DOI] [PubMed] [Google Scholar]
- 34.Pan X, Ye P, Yuan DS, Wang X, Bader JS, Boeke JD. A DNA integrity network in the yeast Saccharomyces cerevisiae. Cell. 2006;124:1069–1081. doi: 10.1016/j.cell.2005.12.036. [DOI] [PubMed] [Google Scholar]
- 35.Memarian N, Jessulat M, Alirezaie J, Mir-Rashed N, Xu J, Zareie M, Smith M, Golshani A. Colony size measurement of the yeast gene deletion strains for functional genomics. BMC Bioinformatics. 2007;8:117. doi: 10.1186/1471-2105-8-117. [DOI] [PMC free article] [PubMed] [Google Scholar]
- 36.Krogan NJ, Lam MH, Fillingham J, Keogh MC, Gebbia M, Li J, Datta N, Cagney G, Buratowski S, Emili A, et al. Proteasome involvement in the repair of DNA double-strand breaks. Mol. Cell. 2004;16:1027–1034. doi: 10.1016/j.molcel.2004.11.033. [DOI] [PubMed] [Google Scholar]
- 37.Critchlow SE, Jackson SP. DNA end-joining: from yeast to man. Trends Biochem. Sci. 1998;23:394–398. doi: 10.1016/s0968-0004(98)01284-5. [DOI] [PubMed] [Google Scholar]
- 38.Tsukamoto Y, Kato J, Ikeda H. Silencing factors participate in DNA repair and recombination in Saccharomyces cerevisiae. Nature. 1997;388:900–903. doi: 10.1038/42288. [DOI] [PubMed] [Google Scholar]
- 39.Li B, Pattenden SG, Lee D, Gutierrez J, Chen J, Seidel C, Gerton J, Workman JL. Preferential occupancy of histone variant H2AZ at inactive promoters influences local histone modifications and chromatin remodeling. Proc. Natl Acad. Sci. USA. 2005;102:18385–18390. doi: 10.1073/pnas.0507975102. [DOI] [PMC free article] [PubMed] [Google Scholar]
- 40.Jazayeri A, McAinsh AD, Jackson SP. Saccharomyces cerevisiae Sin3p facilitates DNA double-strand break repair. Proc. Natl Acad. Sci. USA. 2004;101:1644–1649. doi: 10.1073/pnas.0304797101. [DOI] [PMC free article] [PubMed] [Google Scholar]
Associated Data
This section collects any data citations, data availability statements, or supplementary materials included in this article.


