Abstract
ATP enhances Ca2+ release from inositol (1,4,5)-trisphosphate receptors (InsP3R). However, the three isoforms of InsP3R are reported to respond to ATP with differing sensitivities. Ca2+ release through InsP3R1 is positively regulated at lower ATP concentrations than InsP3R3, and InsP3R2 has been reported to be insensitive to ATP modulation. We have reexamined these differences by studying the effects of ATP on InsP3R2 and InsP3R3 expressed in isolation on a null background in DT40 InsP3R knockout cells. We report that the Ca2+-releasing activity as well as the single channel open probability of InsP3R2 was enhanced by ATP, but only at submaximal InsP3 levels. Further, InsP3R2 was more sensitive to ATP modulation than InsP3R3 under similar experimental conditions. Mutations in the ATPB sites of InsP3R2 and InsP3R3 were generated, and the functional consequences of these mutations were tested. Surprisingly, mutation of the ATPB site in InsP3R3 had no effect on ATP modulation, suggesting an additional locus for the effects of ATP on this isoform. In contrast, ablation of the ATPB site of InsP3R2 eliminated the enhancing effects of ATP. Furthermore, this mutation had profound effects on the patterns of intracellular calcium signals, providing evidence for the physiological significance of ATP binding to InsP3R2.
The inositol (1,4,5)-trisphosphate (InsP3)3 receptors (InsP3R) are a family of large tetrameric cation channels composed of four ∼300-kDa subunits primarily localized to the endoplasmic reticulum. InsP3R act as InsP3-gated channels that release Ca2+ from endoplasmic reticulum stores into the cytosol upon activation (1). In mammals, three distinct gene products plus additional splice variants code for three InsP3R isoforms (InsP3R1, InsP3R2, and InsP3R3) (2–6). Sequence diversity, especially in the regions outside the conserved NH2-terminal InsP3-binding and COOH-terminal channel-forming domains, probably results in differential modulation of the three InsP3R isoforms by cellular factors, including Ca2+, ATP, protein kinases, and binding proteins (7–9). Isoform-specific modulation by these factors may partially account for the complex spatial and temporal diversity of intracellular Ca2+ signals displayed by mammalian cells.
ATP enhances InsP3-mediated Ca2+ release from endoplasmic reticulum stores in a variety of cell types expressing mixed or homogenous InsP3R populations (10–13). Consistent with these observations, ATP also increases the open probability of single InsP3R1 and InsP3R3 channels in lipid bilayers as well as in nuclear patches (14–17). Importantly, this form of modulation does not require hydrolysis, since nonhydrolyzable ATP analogues enhance InsP3R activity to the same extent as ATP (10, 14). Analysis of endogenous Xenopus InsP3R or recombinant rat InsP3R3 in Xenopus oocyte nuclear patches has established that ATP acts as an allosteric modulator primarily by enhancing InsP3R stimulation by Ca2+ (8, 16, 17).
Few studies have compared, in isolation, the effects of ATP on the three InsP3R isoforms under identical experimental conditions (13, 15). The limited data suggest that the relative sensitivity to ATP differs among the three isoforms, with InsP3R1 activity being enhanced by micromolar [ATP] and InsP3R3 being augmented by millimolar [ATP] (15). Interestingly, InsP3R2 was shown to be functionally insensitive to ATP modulation in Ca2+ release assays as well as in single channel measurements (13, 15). The observed differences in sensitivity to ATP modulation are thought to be mediated by differential effects of ATP binding to specific motifs present in the receptors. Three glycine-rich regions (GXGXXG), reminiscent of Walker A motifs found in many ATPases and GTPases, are present in the InsP3R sequences (18, 19). One such motif, termed the ATPA site, is unique to InsP3R1 and is presumed to account for the higher sensitivity of this isoform to modulation by ATP (12, 20). The ATPB site is conserved among all three isoforms and is thought to account for the lower sensitivity of InsP3R3 to ATP modulation, since it has a lower affinity for ATP than the ATPA site (12, 15). Although binding of ATP to these motifs has been observed, the effect of mutating these sites has not been thoroughly examined. InsP3R1 harboring the Opisthotonos mutation disrupts the ATPA site, and this construct exhibited a reduced sensitivity to ATP modulation when compared with wild type in lipid bilayers (20). However, no effect was observed on Ca2+ signaling in DT40-3KO cells expressing this mutant receptor (20). An additional site, termed ATPC, is only found in the S2- InsP3R1 splice variant. Prior work from our laboratory established that a mutation in the ATPC site prevented phosphorylation of the receptor by PKA (21). To date, no studies exist to support the idea that the ATPB sites mediate any functional effects of ATP binding to InsP3R.
The goal of this study was to define what role the ATPB sites has in determining the sensitivity of InsP3R2 and InsP3R3 to ATP modulation. In order to address this question, individual wild type or mutant isoforms were stably expressed in DT40-3KO cells, which are null for InsP3R (22). ATP modulation of InsP3R was examined in permeabilized cells using endoplasmic reticulum luminal Ca2+ measurements and using whole cell single channel measurements (25, 26). Our findings establish that, contrary to prior reports, InsP3R2 is enhanced by ATP and is actually more sensitive to ATP modulation than InsP3R3. Further, we demonstrate that despite the two receptors harboring identical ATP binding sites, the effects of mutating these sites were dramatically different. Ablation of the ATPB site in InsP3R2 completely abolished any modulatory effects of ATP, whereas a similar mutation in InsP3R3 had no effect on the ability of ATP to enhance receptor activity. Finally, we show that ATP binding to the ATPB site in InsP3R2 exerts control of the frequency and amplitude of Ca2+ signals in cells expressing InsP3R2.
EXPERIMENTAL PROCEDURES
Construction of GST Fusion Proteins—GST fusion proteins were created using the pFN2A (GST) Flexi Vector (Promega, Madison, WI). Nucleotides corresponding to amino acids 1943–2013 of mouse InsP3R2 and amino acids 1849–1944 of rat InsP3R3 were amplified by PCR. SgfI and PmeI restriction sites were incorporated into the DNA primers used for PCR amplification. The PCR products were ligated into pFN2A at the SgfI and PmeI sites. This creates a fusion construct with GST at the NH2 terminus of the InsP3R sequences and a tobacco etch virus protease recognition sequence in between to allow cleavage and removal of GST. Constructs with mutations corresponding to G1971A in InsP3R2 and G1922A in InsP3R3 were created and were verified by sequencing. Expression constructs were used to transform BL21 (DE3) pLysS cells (Promega, Madison, WI) for protein production. Production of recombinant protein, removal of the GST tag, and subsequent purification of InsP3R protein was accomplished as previously described (21).
ATP Binding Assay—The fluorescent ATP analog trinitrophenyl-ATP (TNP-ATP) (Invitrogen), which increases fluorescence upon binding to protein (excitation, 403 nm; emission, 546 nm), was used to measure ATP binding to the purified InsP3R2 and InsP3R3 ATPB proteins as previously described (21). Increasing concentrations of TNP-ATP were added to 1 mg of purified protein, and fluorescence was measured using a PerkinElmer LS-5B luminescence spectrometer (Wellesley, MA).
Mutagenesis—Expression constructs harboring cDNA for mouse InsP3R2 (6) and rat InsP3R3 (23) were used as templates for mutagenesis. A two-step QuikChange (Stratagene, La Jolla, CA) mutagenesis strategy (24) was used to introduce G5940C, G5946C, and G5955C point mutations into the InsP3R2 cDNA. These mutations code for amino acid substitutions: G1969A, G1971A, and G1974A, respectively. Sequencing of the entire InsP3R2 coding region (GeneWiz, South Plainfield, NJ) confirmed the correct incorporation of the desired mutations but also revealed an additional spurious deviation from the published sequence (T1044A, leading to amino acid substitution I337N). This substitution is unlikely to result in grossly altered receptor function, since the Ca2+ release rates achieved were comparable between the wild type and ΔATPB receptors in the absence of ATP over a range of [InsP3] (see Figs. 2 and 5). Splice-overlap extension PCR of an internal 4225-base pair KpnI fragment of InsP3R3 was used to introduce G5893C, G5899C, and G5908C. These mutations code for amino acid substitutions: G1920A, G1922A, and G1925A, respectively. Correct incorporation of the mutants and the integrity of the amplified region were verified by DNA sequencing (GeneWiz, South Plainfield, NJ).
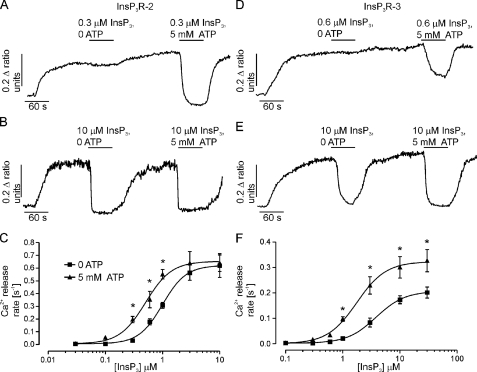
FIGURE 2.
The effects of ATP on InsP3-induced Ca2+ release from InsP3R2 and InsP3R3. Endoplasmic reticulum luminal Ca2+ measurements were obtained from cells stably expressing mouse InsP3R2 (A and B) or rat InsP3R3 (D and E). Cells were loaded with furaptra and permeabilized with β-escin as described under “Experimental Procedures.” 5 mm ATP increased the InsP3-induced Ca2+ release from InsP3R2 when low [InsP3] was used (A) but not when high [InsP3] was used (B). D and E, results obtained from similar experiments using cells expressing rat InsP3R3. ATP enhances InsP3-induced Ca2+ release from InsP3R3 when using low (D) or high (E) [InsP3]. C and F, concentration-response relationships for InsP3 from cells expressing InsP3R2 (C) or InsP3R3 (F) in the absence or presence of 5 mm ATP. Each point is the mean ± S.E. from at least four experiments. Ca2+ release rates were calculated by fitting the average time course from the first 30 s of InsP3 application from 30–50 cells to a single exponential. *, p ≤ 0.05; Student's unpaired t test.
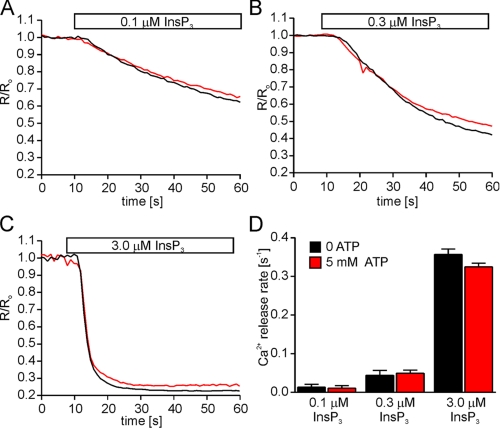
FIGURE 5.
The ATPB site is required for ATP modulation of InsP3R2. The ATPB site was mutated in InsP3R2 by substituting glycines 1969, 1971, and 1974 with alanines. Cells stably expressing mutated InsP3R2 (InsP3R2-ΔATPB) were loaded with furaptra and permeabilized as described under “Experimental Procedures.” A–C, representative Ca2+ release events from cells stimulated with the indicated [InsP3] in the absence (black) or presence (red) of 5 mm ATP. Each trace is the average from 30–50 cells and was normalized to the average 340/380 ratio from the 10 frames prior to InsP3 application. D, the mean Ca2+ release rates ± S.E. from these experiments (n = 3 at 0.1 μm InsP3: 0.01 ± 0.007 s-1 at zero ATP and 0.01 ± 0.006 s-1 at 5 mm ATP; n = 4 at 0.3 μm InsP3: 0.05 ± 0.009 s-1 at zero ATP and 0.05 ± 0.006 s-1 at 5 mm ATP; n = 3 at 3.0 μm InsP3: 0.36 ± 0.013 s-1 at zero ATP and 0.32 ± 0.009 s-1 at 5 mm ATP).
Creation of Stable InsP3R2 and InsP3R3-expressing DT40-3KO Cell Lines—Wild type and mutated InsP3R2 and InsP3R3 constructs were linearized with MfeI and NruI, respectively. Linearized constructs were introduced into DT40-3KO cells by nucleofection using solution T and program B23 as per the manufacturer's instructions (Amaxa, Cologne, Germany). After nucleofection, the cells were incubated in growth medium for 24 h prior to dilution in selection medium containing 2 mg/ml Geneticin (Invitrogen). Cells were then seeded into 96-well tissue culture plates at ∼1000 cells/well and incubated in selection medium for at least 7 days. Wells exhibiting growth after the selection period were picked for expansion.
Permeabilized Cell Ca2+ Measurements—InsP3R2- and InsP3R3-expressing stable DT40-3KO cells were loaded with 20 μm furaptra-AM (Teflabs, Austin, TX) at 39 °C for 30 min in a HEPES-buffered physiological saline solution (HEPES-PSS) containing 5.5 mm glucose, 137 mm NaCl, 0.56 mm MgCl2, 4.7 mm KCl, 1 mm Na2HPO4, 10 mm HEPES (pH 7.4), 1.2 mm CaCl2, and 1% (w/v) bovine serum albumin. Furaptra-loaded cells were permeabilized by superfusion for 1–2 min with 40 μm β-escin in intracellular medium (ICM) containing 125 mm KCl, 19 mm NaCl, 10 mm HEPES, 1 mm EGTA (pH 7.3). Permeabilized cells were then washed in ICM without β-escin for 15 min to facilitate removal of cytosolic dye, and the cells were then superfused in ICM containing 1.4 mm MgCl2, 3 mm Na2ATP, and 0.650 mm CaCl2 (free [Ca2+] of 200 nm, calculated using MAXCHELATOR) to load the intracellular stores. The free [Ca2+] was subsequently maintained at a constant 200 nm throughout all experimental maneuvers and was verified by fluorescent measurement of free Ca2+ in solutions. Prior to application of InsP3, the cells were superfused in ICM without MgCl2 for 1 min to disable SERCA activity. The unidirectional flux of Ca2+ upon InsP3 application was then monitored in the same solution containing various concentrations of InsP3 and ATP by monitoring the emission of the dye above 505 nm following excitation at 340 and 380 nm (exposure for 20 ms, once per second), using a TILL Photonics imaging system. Following the removal of InsP3, refilling of the stores to allow repeated stimulations was accomplished by superfusion of ICM containing MgCl2 and ATP. Ca2+ release events were averages of the 30–50 cells in a field of view. Rates of Ca2+ release were estimated from these average responses by fitting the initial 30-s period of decreasing fluorescence to a single exponential function (GraphPad Prism, San Diego, CA).
Single InsP3R2 Channel Measurements—Whole cell patch clamp recordings of single InsP3R2 channel activity (25, 26) were taken from DT40-3KO cells stably expressing mouse InsP3R2. K+ was utilized as the charge carrier in all experiments, and free Ca2+ was clamped at 200 nm to favor activation of InsP3R (bath: 140 mm KCl, 10 mm HEPES, 500 μm BAPTA, 250 nm free Ca2+ (pH 7.1); pipette: 140 mm KCl, 10 mm HEPES, 100 μm BAPTA, 200 nm free Ca2+, 5 mm Na2-ATP unless otherwise noted (pH 7.1)). Borosilicate glass pipettes were pulled and fire polished to resistances of about 20 megaohms. Following establishment of stable high resistance seals, the membrane patches were ruptured to form the whole-cell configuration with resistances of >5 gigaohms and capacitances of >8 picofarads. Currents were recorded under voltage clamp conditions at the indicated potentials using an Axopatch 200B amplifier and pClamp 9. Channel recordings were digitized at 20 kHz and filtered at 5 kHz with a -3 decibel, 4-pole Bessel filter. Activity was typically evident essentially immediately following break-through with InsP3 in the pipette. Analyses were performed using the event detection protocol in Clampfit 9. Channel openings were detected by half-threshold crossing criteria. We assumed that the number of channels in any particular cell is represented by the maximum number of discrete stacked events observed during the experiment. The Po was calculated using the multimodal distribution for the open and closed current levels.
Digital Imaging of [Ca2+]i in Intact Cells—InsP3R2- and InsP3R3-expressing stable DT40-3KO cells were washed once in a HEPES-PSS containing 1% (w/v) bovine serum albumin. Cells were then resuspended in bovine serum albumin HEPES-PSS with 1 μm Fura-2/AM (Teflabs Inc., Austin, TX), placed on a 15-mm glass coverslip in a low volume perfusion chamber, and allowed to adhere for 20 min at room temperature. Cells were perfused continuously for 10 min with HEPES-PSS before experimentation to allow complete Fura-2 deesterification. [Ca2+]i imaging was performed using an inverted epifluorescence Nikon microscope with a ×40 oil immersion objective lens (numerical aperture, 1.3). Cells were excited alternately with light at 340 and 380 nm (± 10-nm bandpass filters, Chroma, Rockingham, VT) using a monochrometer (TILL Photonics, Pleasanton, CA). Fluorescence images were captured and digitized with a digital camera driven by TILL Photonics software. Images were captured every 2 s with an exposure of 20 ms and 4 × 4 binning. 340/380 ratio images were calculated online and stored immediately to a hard disk. Intracellular Ca2+ transients were analyzed for frequency and amplitude using the template detection option from the event detection protocol in pClamp9. Transients with a change in 340/380 less than 0.05 ratio units were discarded.
Microsomal Preparation and Western Blotting—Microsomal membranes were prepared from nontransfected DT40-3KO or DT40-3KO cells stably expressing InsP3R essentially as previously described (27). Briefly, cells were pelleted and resuspended in homogenization buffer (5 mm NaN3, 0.1 mm EGTA, 1 mm β-mercaptoethanol, 20 mm HEPES, pH 7.4). After homogenization by 60 strokes of a motor-driven Teflon homogenizer, samples were spun in a tabletop centrifuge at 2000 rpm for 10 min. Supernatants were spun at 100,000 × g (50,000 rpm in Beckman centrifuge with a TLA100.3 rotor). Membrane pellets were solubilized in Laemmli running buffer, and protein concentrations were determined using Amido Black. Equal amounts of membrane proteins were separated on 5% polyacrylamide gels and transferred to nitrocellulose. Membranes were probed with antibodies specific for InsP3R2 or InsP3R3. The InsP3R2 antibody was directed against a unique sequence from rat InsP3R2 (320PDYRDAQNEGKTVRDGELP338). The antibody was produced by Pocono Rabbit Farms and Laboratories (Canadensis, PA). The InsP3R3 antibody was from BD Biosciences.
RESULTS
The ATPB Site from InsP3R2 Binds TNP-ATP—ATP has been shown to bind to full-length InsP3R1 and InsP3R3 as well as to purified peptides containing the ATPB sites from both receptor isoforms; however, the ability of ATP to bind to the ATPB site in InsP3R2 has not been tested (12, 28). This is an important consideration, since a possible explanation for the lack of functional effects of ATP on InsP3R2 is that the ATPB site from InsP3R2 cannot bind ATP. In order to compare the ATP binding properties of the ATPB sites from InsP3R2 and InsP3R3, we generated cDNA constructs encoding GST fused to residues 1943–2013 of InsP3R2 and to residues 1849–1944 of InsP3R3. These fusion proteins contain the glycine-rich putative ATPB sites as well as enough flanking sequence to allow for efficient protein expression and purification.
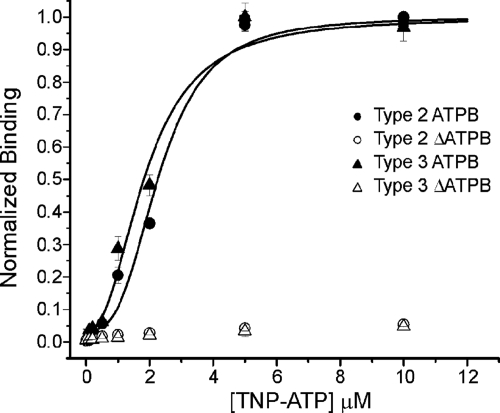
After elution from the GST-agarose and proteolytic removal of the GST tag, binding to the purified ATPB sites was assessed using a TNP-ATP binding assay. Increasing amounts of TNP-ATP were added to 1-mg samples of the purified ATPB proteins, and greater fluorescence indicated binding of the TNP-ATP to the purified proteins. As shown in Fig. 1, TNP-ATP can readily bind to the ATPB sites from both InsP3R2 and InsP3R3, as indicated by the increase in fluorescence with increasing concentrations of TNP-ATP. Additionally, the EC50 values for TNP-ATP binding were similar for both proteins, indicating similar affinities of TNP-ATP for the two binding sites. This could be expected given the high degree of similarity between the receptors in this region but does not necessarily mean that the affinities are the same in the context of the whole receptor. Determination of the absolute affinity of either isoform for ATP was not tenable by this method, because binding was not determined in the context of the full-length receptor and because TNP-ATP binds to proteins with a higher affinity than does unlabeled ATP (29). Even with these caveats, the results clearly show that the ATPB site from InsP3R2 can bind ATP.
FIGURE 1.
TNP-ATP binds to ATPB sites. ATP binding to the ATPB sites from InsP3R2 and InsP3R3 were assessed by monitoring the fluorescence of TNP-ATP as described under “Experimental Procedures.” TNP-ATP binds to purified ATPB from InsP3R2 with an EC50 of 2.3 ± 0.2 μm (filled circles) and binds to purified ATPB from InsP3R3 with an EC50 of 1.9 ± 0.2 μm (filled triangles). TNP-ATP does not bind to mutated ATPB sites from InsP3R2 (open circles) and InsP3R3 (open triangles).
ATP Enhances the Activities of InsP3R2 and InsP3R3—Given that the ATPB from InsP3R2 binds ATP, it is somewhat surprising that functional effects of ATP have not been observed for this isoform. It should be noted that previous studies examining the effects of ATP on InsP3R2 used saturating InsP3 concentrations, raising the possibility that any effects of ATP on InsP3R2 were masked as a result of maximal stimulation (13, 15). In order to examine the effects of ATP on InsP3R function over the full range of InsP3 concentrations, we generated DT40-3KO cell lines stably expressing either mammalian InsP3R2 or InsP3R3 in isolation.
Cells expressing InsP3R2 or InsP3R3 were loaded with the low affinity Ca2+ sensing dye furaptra, and unidirectional luminal Ca2+ measurements were made in β-escin permeabilized cells. InsP3R activity was determined by fitting the release events to single exponentials. Ca2+ release rates were measured over a range of InsP3 concentrations in the presence and absence of 5 mm ATP in order to observe the effects of ATP on InsP3R function under varied levels of stimulation. Interestingly, the ability of ATP to enhance Ca2+ release from InsP3R2 was strictly dependent on the concentration of InsP3 used for stimulation. Representative recordings from InsP3R2-expressing cells treated with low (0.3 μm) or high (10 μm) InsP3 in the presence and absence of 5 mm ATP are shown in Fig. 2, A and B, respectively. ATP clearly enhances Ca2+ release in response to InsP3 levels below 3 μm but is without effect if [InsP3] is higher (Fig. 2C). 5 mm ATP caused a 2-fold shift in the EC50 for InsP3 in cells expressing InsP3R2 (Fig. 2C). In contrast, 5 mm ATP enhanced the Ca2+ release rate from cells expressing InsP3R3 at all InsP3 concentrations tested (Fig. 2, D–F). These data establish for the first time that, in a fashion similar to InsP3R1 and InsP3R3, ATP positively modulates InsP3R2. Additionally, the results highlight possible important differences in the behavior of the receptors under maximal levels of stimulation. Specifically, InsP3R3 activity is enhanced by ATP at supermaximal InsP3 concentrations, whereas InsP3R2 is only subject to modulation at submaximal [InsP3].
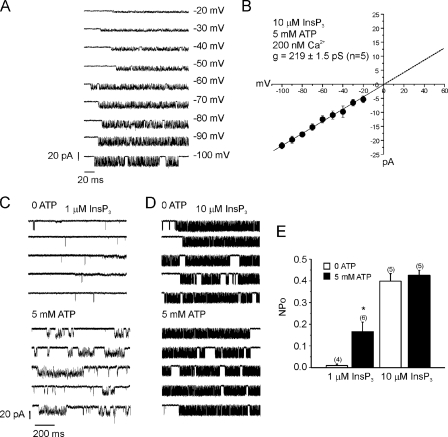
Further evidence to support the premise that ATP can modulate InsP3R2 was gained by measuring single InsP3R2 channel activity in DT40 cells. Taylor and co-workers (25, 26) and Schug et al. (30) recently reported that small numbers of InsP3R are present in the plasma membranes of DT40 cells, which allows recording of single InsP3R in whole cell mode of the patch clamp technique (25, 26, 30). We first confirmed that InsP3R2 is also present in the plasma membrane of DT40 cells stably expressing the receptor. InsP3R2 channel activity was dependent on InsP3, since no activity was observed in cells without InsP3 in the pipette (n = 5 cells, >50 min of total recording time; data not shown). During these experiments, ATP (5 mm) was in the pipette, indicating that ATP is unable to stimulate channel openings in the absence of InsP3. Furthermore, channel activity was absent in nontransfected cells, and heparin blocked the activity in transfected cells with 10 μm InsP3 in the pipette (n = 5 cells; >50 min of total recording time; data not shown). Fig. 3A shows representative recordings from a cell held at various membrane potentials with 10 μm InsP3 in the pipette, and Fig. 3B shows the average single channel current-voltage relationship from five such cells.
FIGURE 3.
ATP increases the single channel open probability InsP3R2 at low [InsP3]. Single channel activity of plasma membrane-resident InsP3R2 was measured in whole cell patch clamp mode. A, representative recordings from a cell expressing InsP3R2 and held at the indicated voltages with 10 μm InsP3 in the pipette. B, current-voltage relationship indicating a slope conductance for K+ of 219 ± 1.9 picosiemens. C, 5 mm ATP increased the NPo of InsP3R2 when low (1 μm) InsP3 was included in the pipette (0.01 ± 0.007 with 0 ATP versus 0.16 ± 0.04 with 5 mm ATP. Recordings are from different cells held at -100 mV with 1 μm InsP3 and the indicated [ATP]. D, no effects of 5 mm ATP were observed in recordings from cells in which 10 μm InsP3 was used (0.40 ± 0.03 versus 0.42 ± 0.02). Recordings are from different cells held at -100 mV with 10 μm InsP3 and the indicated [ATP]. E, the mean NPo ± S.E. and number of cells for each condition. *, p ≤ 0.05; Student's unpaired t test.
We next tested for effects of ATP on the open probability of InsP3R2 using low (1 μm) or high (10 μm) InsP3 to stimulate channel activity. Consistent with results obtained in luminal Ca2+ measurements (Fig. 2); the effects of ATP were dependent on the concentration of InsP3 used for activation. As shown in Fig. 3C, in the presence of 1 μm InsP3, the NPo of InsP3R2 was 10-fold greater when 5 mm ATP was included in the pipette compared with the absence of ATP. The activity of InsP3R2, however, was not enhanced by 5 mm ATP when 10 μm InsP3 was included in the pipette (0.40 ± 0.03 versus 0.42 ± 0.02) (Fig. 3D).
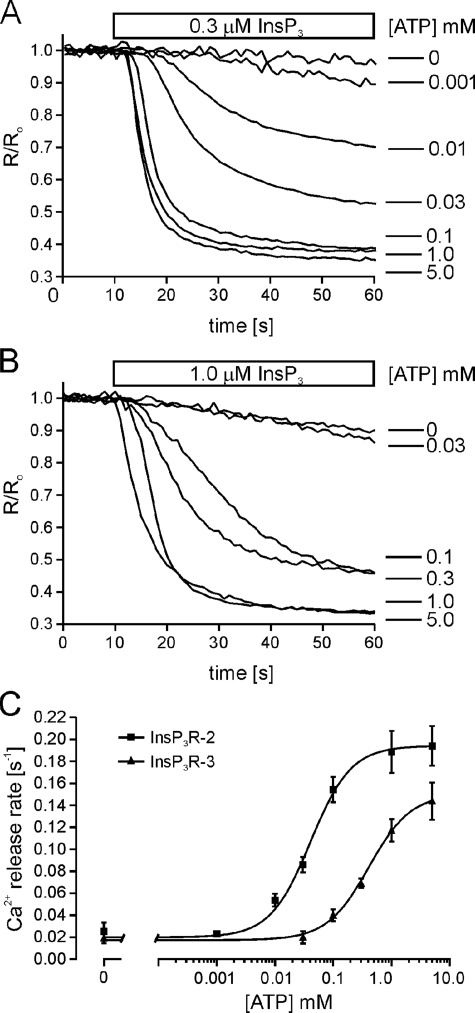
Different Sensitivities of InsP3R2 and InsP3R3 to ATP Modulation—The experiments outlined above tested the effects of presumably saturating [ATP] on InsP3R activity. However, these maneuvers did not address whether InsP3R2 and InsP3R3 have similar ATP sensitivities. Therefore, we next sought to compare the sensitivities of InsP3R2 and InsP3R3 to ATP modulation under similar experimental settings. ATP levels were varied between 0 and 5 mm at fixed InsP3 and Ca2+ concentrations. 0.3 μm InsP3 was chosen for InsP3R2-expressing cells, and 1.0 μm InsP3 was used for InsP3R3-expressing cells, because these InsP3 concentrations elicited similar Ca2+ release rates from both receptor populations in the absence of ATP (0.024 ± 0.007 s-1 for InsP3R2 and 0.019 ± 0.004 s-1 for InsP3R3). In addition, the -fold increases in Ca2+ release rates with 5 mm ATP were similar (∼9-fold for InsP3R2 and ∼8-fold for InsP3R3). Fig. 4 shows the results of representative Ca2+ release experiments using various levels of ATP for cells expressing InsP3R2 (Fig. 4A) or InsP3R3 (Fig. 4B). Cells expressing InsP3R2 exhibited a dramatically higher sensitivity to ATP under these conditions, with an EC50 for ATP of ∼41 μm versus ∼400 μm for cells expressing InsP3R3 (Fig. 4C).
FIGURE 4.
InsP3R2 is more sensitive than InsP3R3 to ATP modulation. Cells stably expressing InsP3R2 or InsP3R3 were loaded with furaptra and permeabilized as described under “Experimental Procedures.” A, representative Ca2+ release events from cells stably expressing InsP3R2. 0.3 μm InsP3 was applied along with the indicated [ATP]. B, representative Ca2+ release events from cells stably expressing InsP3R3 and stimulated with 1.0 μm InsP3 along with the indicated [ATP]. Each trace is the average from 30–50 cells and was normalized to the average 340/380 ratio from the 10 frames prior to InsP3 application. C, concentration-response relationships for ATP. Cells expressing InsP3R2 exhibit an EC50 for ATP of 41 μm, and cells expressing InsP3R3 exhibit an EC50 for ATP of 400 μm. Each point is the mean ± S.E. from at least four experiments. Ca2+ release rates were determined by fitting the average time course from the first 30 s of InsP3 application from 30–50 cells to a single exponential.
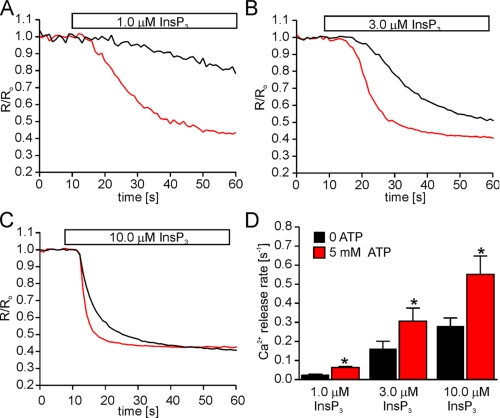
The Consequences of Mutated ATPB Sites on the Modulatory Effects of ATP on InsP3R—The above experiments highlight important differences in the Ca2+ release behavior of the two isoforms, which is especially interesting given that the receptors each contain a single identical putative ATP binding domain. Experiments were performed to determine if these ATPB sites are, in fact, responsible for the observed functional effects of ATP on both receptors. We generated stable DT40 cell lines expressing ATPB-deficient InsP3R2 and InsP3R3. Initially, stable cell lines were generated with receptors harboring single glycine-alanine substitutions (G1971A for InsP3R2 and G1922A for InsP3R3). Cells expressing each of these mutant receptors still exhibited positive modulation by ATP in Ca2+ release experiments (data not shown). This was surprising, since analogous mutations abolished TNP-ATP binding (Fig. 1), but may reflect different binding determinants for the full-length receptor. Additionally, ATP may bind to the ATPB site in a manner different from that of the bulkier TNP-ATP. In order to ensure that ATP could not interact with the ATPB sites, more severe mutations were generated by substituting glycines 1969, 1971, and 1974 in InsP3R2 and glycines 1920, 1922, and 1925 in InsP3R3 with alanines. The effect of ATP on InsP3-induced Ca2+ release was then examined in permeabilized cells expressing these mutant receptors. In contrast to cells expressing wild type receptor, in cells expressing mutated InsP3R2, 5 mm ATP had no effect on the Ca2+ release rates at all InsP3 levels tested (Fig. 5). These data establish the ATPB site as the only functionally relevant ATP binding site in InsP3R2. The results obtained from a mutated InsP3R3 were, however, dramatically different. In contrast to InsP3R2, the effects of ATP were retained in cells expressing an ATPB-deficient InsP3R3 (Fig. 6). In a manner similar to the wild type receptor, the enhancing effects of ATP were observed at all tested [InsP3].
FIGURE 6.
The ATPB site is not required for ATP modulation of InsP3R3. The ATPB site is required for ATP modulation of InsP3R3. The ATPB site was mutated in InsP3R3 by substituting glycines 1920, 1922, and 1925 with alanines. Cells stably expressing mutated InsP3R3 (InsP3R3-ΔATPB) were loaded with furaptra and permeabilized as described under “Experimental Procedures.” A–C, representative Ca2+ release events from cells stimulated with the indicated [InsP3] in the absence (black) or presence (red) of 5 mm ATP. Each trace is the average from 30–50 cells and is normalized to the average 340/380 ratio from the 10 frames prior to InsP3 application. D, the mean Ca2+ release rates ± S.E. from these experiments (n = 4 at 1.0 μm InsP3: 0.02 ± 0.006 s-1 at zero ATP and 0.06 ± 0.005 s-1 at 5 mm ATP; n = 6 at 3.0 μm InsP3: 0.16 ± 0.04 s-1 at zero ATP and 0.31 ± 0.007 s-1 at 5 mm ATP; n = 6 at 10.0 μm InsP3 0.28 ± 0.04 s-1 at zero ATP and 0.55 ± 0.09 s-1 at 5 mm ATP). *, p ≤ .05; Student's paired t test.
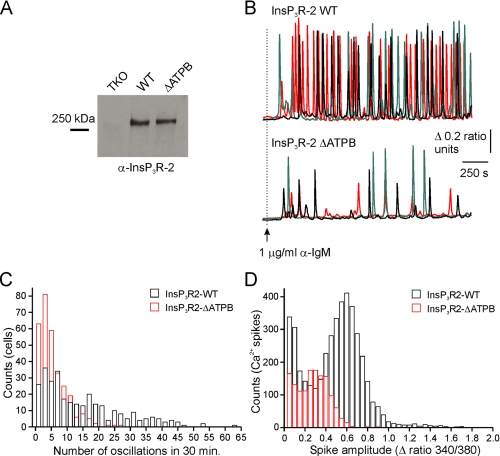
The Effects of ATPB-deficient InsP3R on the Intracellular Ca2+ Signals—DT40 cells generate repetitive intracellular Ca2+ spikes when stimulated with an antibody directed against IgM (13, 31). Ca2+ signals are initiated by cross-linking of the B-cell receptor and are phospholipase C-γ2- and InsP3R-dependent (13, 22, 32). We took advantage of this endogenous signaling pathway to examine the effects of InsP3R mutations on the intracellular Ca2+ responses of cells stably expressing wild type and ΔATPB mammalian InsP3R. Consistent with the reported results from DT40 cells expressing chicken InsP3R2 in isolation, cells expressing mouse InsP3R2 exhibited robust oscillatory intracellular Ca2+ responses after stimulation with 1 μg/ml anti-IgM (Fig. 7B, top). These signals typically initiated within 2–3 min of antibody application and persisted throughout the experimental time course of 30 min. Similar amounts of InsP3R2 were detected in Western blots from cell lines expressing wild type and ATPD-mutated Ins3R2 (Fig. 7A). The properties of the Ca2+ signals in cells expressing the mutated receptor, however, were dramatically different from the patterns elicited from cells expressing the wild type receptor. The properties of the signals were, however, dramatically different from the patterns elicited from cells expressing the wild type receptor (Fig. 7B, bottom). The mean observed number of oscillations was significantly reduced in InsP3R2-ΔATPB-expressing cells compared with wild type InsP3R-expressing cells (5.2 ± 0.9 versus 14.1 ± 1.4 spikes/cell over 30 min; n = 6; 300 cells; p ≤ 0.05; Student's unpaired t test). Additionally, the mean amplitude of the spikes was also reduced in InsP3R2-ΔATPB-expressing cells (0.26 ± 0.03 versus 0.49 ± 0.03 Δ ratio units; n = 6; 300 cells; p ≤ 0.05; Student's unpaired t test).
FIGURE 7.
Mutating the ATPB site in InsP3R2 affects BCR-induced Ca2+ signaling. A, microsomal membranes were prepared from nontransfected DT40-3KO cells (TKO) and from cells stably expressing either wild type InsP3R2 (InsP3R2) or InsP3R2-ΔATPB (ΔATPB). 50 μg of membrane protein were separated by SDS-PAGE, transferred to nitrocellulose, and probed with an antibody directed against InsP3R2. B, representative Fura-2 recordings from three individual cells (black traces, red traces, and green traces) expressing either InsP3R2 (top) or InsP3R2-ΔATPB (bottom) and stimulated with 1 μg/ml anti-IgM where indicated by the arrow. C, a histogram of the number of oscillations/cell over 30 min of stimulation (black outlines, InsP3R2; red outlines, InsP3R2-ΔATPB). D, a histogram of the amplitudes of the Ca2+ spikes counted in C. WT, wild type.
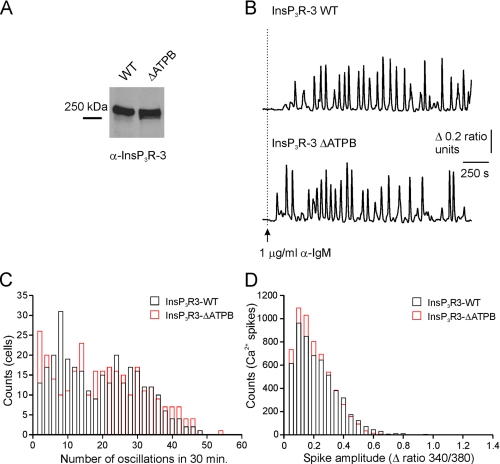
Cells expressing rat InsP3R3 also exhibited repetitive intracellular Ca2+ responses (Fig. 8A), suggesting that the mammalian isoform is able to support oscillatory responses in these cells. This contrasts with the observation that a similar stimulation of cells expressing endogenous chicken InsP3R3 in isolation produced only monophasic Ca2+ responses (13), although anti-IgM-induced oscillations were also observed in another DT40-3KO cell line stably expressing rat InsP3R3 (33). Consistent with the ATPB site having no effect on the enhancing effects of ATP in permeabilized cells (Fig. 6), the BCR-induced Ca2+ signals elicited from ATPB-mutated InsP3R3-expressing cells were indistinguishable from signals elicited from wild type InsP3R3-expressing cells (Fig. 8). The cell lines exhibited similar numbers of oscillations (17.9 ± 2.2 (wild type) versus 19.5 ± 2.0 (ΔATPB) spikes/cell over 30 min; n = 5; 300 cells) as well as similar mean spike amplitudes (0.21 ± 0.01 (wild type) versus 0.20 ± 0.02 (ΔATPB) Δ ratio units; n = 5; 300 cells).
FIGURE 8.
Mutating the ATPB site in InsP3R3 does not affect BCR-induced Ca2+ signaling. A, microsomal membranes were prepared from cells stably expressing wild type InsP3R3 (InsP3R3) or InsP3R3-ΔATPB (ΔATPB). 50 μg of membrane protein were separated by SDS-PAGE, transferred to nitrocellulose, and probed with an antibody directed against InsP3R3. B, representative Fura-2 recordings from individual cells expressing either InsP3R3 (top) or InsP3R3-ΔATPB (bottom) and stimulated with 1 μg/ml anti-IgM where indicated by the arrow. C, a histogram of the number of oscillations per cell over 30 min of stimulation (black outlines, InsP3R3; red outlines, InsP3R3-ΔATPB). D, a histogram of the amplitudes of the Ca2+ spikes counted in C. WT, wild type.
DISCUSSION
The effects of ATP and related nucleotides on InsP3R1 and InsP3R3 function have been extensively studied in numerous systems, but ATP regulation of InsP3R2 function has not been previously reported. Two prior studies have described InsP3R2 as being insensitive to ATP modulation following activation with high [InsP3] (13, 15). Further, the lack of ATP effects was shown to predominate in cells expressing InsP3R2 in combination with the other isoforms (13). A major contribution of the present study is to demonstrate that ATP does, in fact, regulate InsP3R2 but only at submaximal [InsP3]. Additionally, InsP3R2 exhibits a much higher sensitivity to ATP modulation than InsP3R3 at these [InsP3] values. Using a mutagenesis approach, we also demonstrate that, in contrast to InsP3R3, this high sensitivity to ATP is mediated by the ATPB site present in InsP3R2.
All of the effects of ATP observed in these experiments were determined in the absence of MgCl2. Magnesium-bound ATP (MgATP) has been shown to modulate InsP3R1 and InsP3R3 in numerous studies (12, 14) but was not effective in nuclear patch clamp measurements of InsP3R1 or InsP3R3 (16, 17). We excluded MgCl2 from experimental buffers for 1 min prior to and throughout stimulation with InsP3 to prevent SERCA activation. Although allowing unidirectional measures of InsP3R function, this paradigm does not allow for an assessment of the effects of MgATP. We therefore cannot comment on whether MgATP, in particular, is able to modulate InsP3R2 or InsP3R3 function to the same extent as free ATP.
We also find that, in contrast to InsP3R2, ATP increases both the efficacy and potency of InsP3 in cells expressing InsP3R3 in isolation. This divergence from cells expressing InsP3R2 could be explained by an additional locus for ATP modulation in InsP3R3 besides the Walker A-type ATPB site. The possibility of an additional site is likely, given that ablation of the ATPB site in InsP3R3 did not eliminate the enhancing effects of ATP. Currently, no biochemical evidence for additional sites has been reported. InsP3R3 was shown to cross-link with 8-azido-[α-32P]ATP exclusively within a 95-kDa tryptic fragment that contains the ATPB site (28). It is formally possible that additional binding sites exist in the same fragment, but no sequence similarity to known ATP binding sequences, such as Walker motifs or cystathionine β-synthase-related domains (34), exists in this region or indeed any other region of InsP3R3.
The lack of known additional ATP binding motifs in InsP3R3 highlights the possibility of ATP interacting with noncanonical domains elsewhere in the receptor. Consistent with this idea, ATP has been shown to bind the carboxyl termini of certain members of the inward rectifier potassium channel (Kir) family and regulate channel function. Specifically, the Kir1.1, Kir6.1, and Kir6.2 channel-forming subunits of the KATP channel bind TNP-ATP with high affinity, although these proteins do not contain any known nucleotide-binding motifs (35). Extensive molecular modeling and mutagenesis strategies were employed to show that ATP binding occurs at an intermolecular interface between the amino terminus of one subunit of Kir6.2 and the carboxyl terminus of adjacent subunits (36–39). Similar approaches are needed to identify unknown additional ATP binding domains in InsP3R3. Another possible strategy for identifying novel ATP binding domains could involve measuring 8-azido-[α-32P]ATP binding to InsP3R3-ΔATPB in the presence of InsP3 and Ca2+ to initiate receptor activation, the rationale being that the conformational changes occurring during channel activation (40, 41) would reveal otherwise cryptic ATP binding sites. A further possibility is that ATP may exert its effects through an intermediary protein. In this scenario, any candidates must be tightly bound to the receptor, since ATP modulation of InsP3R3 is readily evident in permeabilized cells.
ATP modulation of InsP3R2 and InsP3R3 is probably physiologically relevant in a number of cell types that express these isoforms. For example, in exocrine glands, these isoforms have been shown to be essential for Ca2+-dependent exocytosis and fluid secretion (42), and thus ATP modulation of Ca2+ release might be expected to impact these processes. Also, given that multiple mammalian cell types express InsP3R2 as the predominant isoform (43), ATP may exert modulatory effects on InsP3-induced Ca2+ release in more physiological systems than previously appreciated. For instance, tissues such as liver, heart (43), salivary gland (44), and astrocytes (45) all express more InsP3R2 relative to either InsP3R1 or InsP3R3. Furthermore, InsP3R2 is expressed to some extent in a majority of cell types outside of the cerebellum, which expresses almost exclusively InsP3R1 (43). Although ATP would probably affect InsP3-induced Ca2+ release in these cells, the high sensitivity of InsP3R2 to ATP would require cytosolic ATP levels to fall below 100 μm before adversely impacting signaling. Of note, ATP levels lower than 100 μm have been measured in ischemic brain tissue (46), suggesting that pathological periods of oxygen deprivation could result in a diminished InsP3R response even in cells expressing mostly InsP3R2. Because InsP3R3 has a lower sensitivity to ATP modulation, cells predominantly expressing this isoform might exhibit diminished InsP3R responses at much higher ATP levels. Pancreatic β-cells have been shown to express mostly InsP3R3 (4) and experience metabolic fluctuations in cytosolic ATP levels that could impact the ability of InsP3-raising agonists to modulate insulin secretion.
In summary, we have taken a mutagenic approach to address the contribution of the ATPB sites in the modulation of InsP3R2 and InsP3R3 by ATP. We found that the two isoforms differ in their sensitivity to ATP as well as the mechanisms by which ATP exerts its effects. The lower sensitivity of InsP3R3 is probably bought about by a mechanism that does not require binding of ATP to the ATPB site. This situation may not, however, be unique to InsP3R3. The sensitivity of InsP3R1 to ATP has been determined in multiple systems to be higher than that of InsP3R3, This enhanced sensitivity is thought to be brought about by a high affinity ATPA site unique to InsP3R1, but it is possible that additional unknown ATP binding domains may also be present in InsP3R1. Moreover, the contribution of the ATPB site in mediating the effects of ATP on InsP3R1 has not been established. As reported in this study, mutation of the ATPB site in InsP3R2 produced different results than mutation of the ATPB site in InsP3R3. The sequences are highly similar in the regions surrounding these sites in all three InsP3R isoforms. It is therefore difficult to predict, based on sequence alone, what role the ATPB site in InsP3R1 would play.
The present work adds to a growing body of evidence suggesting that ATP modulation of InsP3R is highly complex with isoform-dependent mechanisms. A complete understanding of these mechanisms will require additional mutagenesis and detailed functional analyses of defined receptor populations.
Acknowledgments
We thank Dr. T. Kurosaki for providing the DT40-KO cells, Dr. S. Joseph for providing the rat InsP3R3 expression construct, and Lyndee Knowlton for excellent technical assistance.
This work was supported, in whole or in part, by National Institutes of Health Grants RO1-DK054568 and RO1-DE016999 (to D. I. Y.). The costs of publication of this article were defrayed in part by the payment of page charges. This article must therefore be hereby marked “advertisement” in accordance with 18 U.S.C. Section 1734 solely to indicate this fact.
Footnotes
The abbreviations used are: InsP3, inositol 1,4,5-trisphosphate; InsP3R, InsP3 receptor(s); GST, glutathione S-transferase; TNP-ATP, trinitrophenyl-ATP; ICM, intracellular medium; NPo, channel open probability.
References
- 1.Patel, S., Joseph, S. K., and Thomas, A. P. (1999) Cell Calcium 25 247-264 [DOI] [PubMed] [Google Scholar]
- 2.Furuichi, T., Yoshikawa, S., Miyawaki, A., Wada, K., Maeda, N., and Mikoshiba, K. (1989) Nature 342 32-38 [DOI] [PubMed] [Google Scholar]
- 3.Sudhof, T. C., Newton, C. L., Archer, B. T., III, Ushkaryov, Y. A., and Mignery, G. A. (1991) EMBO J. 10 3199-3206 [DOI] [PMC free article] [PubMed] [Google Scholar]
- 4.Blondel, O., Takeda, J., Janssen, H., Seino, S., and Bell, G. I. (1993) J. Biol. Chem. 268 11356-11363 [PubMed] [Google Scholar]
- 5.Danoff, S. K., Ferris, C. D., Donath, C., Fischer, G. A., Munemitsu, S., Ullrich, A., Snyder, S. H., and Ross, C. A. (1991) Proc. Natl. Acad. Sci. U. S. A. 88 2951-2955 [DOI] [PMC free article] [PubMed] [Google Scholar]
- 6.Iwai, M., Tateishi, Y., Hattori, M., Mizutani, A., Nakamura, T., Futatsugi, A., Inoue, T., Furuichi, T., Michikawa, T., and Mikoshiba, K. (2005) J. Biol. Chem. 280 10305-10317 [DOI] [PubMed] [Google Scholar]
- 7.Bezprozvanny, I. (2005) Cell Calcium 38 261-272 [DOI] [PubMed] [Google Scholar]
- 8.Foskett, J. K., White, C., Cheung, K. H., and Mak, D. O. (2007) Physiol. Rev. 87 593-658 [DOI] [PMC free article] [PubMed] [Google Scholar]
- 9.Patterson, R. L., Boehning, D., and Snyder, S. H. (2004) Annu. Rev. Biochem. 73 437-465 [DOI] [PubMed] [Google Scholar]
- 10.Iino, M. (1991) J. Gen. Physiol. 98 681-698 [DOI] [PMC free article] [PubMed] [Google Scholar]
- 11.Missiaen, L., Parys, J. B., Smedt, H. D., Sienaert, I., Sipma, H., Vanlingen, S., Maes, K., and Casteels, R. (1997) Biochem. J. 325 661-666 [DOI] [PMC free article] [PubMed] [Google Scholar]
- 12.Maes, K., Missiaen, L., De Smet, P., Vanlingen, S., Callewaert, G., Parys, J. B., and De Smedt, H. (2000) Cell Calcium 27 257-267 [DOI] [PubMed] [Google Scholar]
- 13.Miyakawa, T., Maeda, A., Yamazawa, T., Hirose, K., Kurosaki, T., and Iino, M. (1999) EMBO J. 18 1303-1308 [DOI] [PMC free article] [PubMed] [Google Scholar]
- 14.Bezprozvanny, I., and Ehrlich, B. E. (1993) Neuron 10 1175-1184 [DOI] [PubMed] [Google Scholar]
- 15.Tu, H., Wang, Z., Nosyreva, E., De Smedt, H., and Bezprozvanny, I. (2005) Biophys. J. 88 1046-1055 [DOI] [PMC free article] [PubMed] [Google Scholar]
- 16.Mak, D. O., McBride, S., and Foskett, J. K. (1999) J. Biol. Chem. 274 22231-22237 [DOI] [PubMed] [Google Scholar]
- 17.Mak, D. O., McBride, S., and Foskett, J. K. (2001) J. Gen. Physiol. 117 447-456 [DOI] [PMC free article] [PubMed] [Google Scholar]
- 18.Maes, K., Missiaen, L., Parys, J. B., Sienaert, I., Bultynck, G., Zizi, M., De Smet, P., Casteels, R., and De Smedt, H. (1999) Cell Calcium 25 143-152 [DOI] [PubMed] [Google Scholar]
- 19.Wierenga, R. K., and Hol, W. G. (1983) Nature 302 842-844 [DOI] [PubMed] [Google Scholar]
- 20.Tu, H., Miyakawa, T., Wang, Z., Glouchankova, L., Iino, M., and Bezprozvanny, I. (2002) Biophys. J. 82 1995-2004 [DOI] [PMC free article] [PubMed] [Google Scholar]
- 21.Wagner, L. E., 2nd, Betzenhauser, M. J., and Yule, D. I. (2006) J. Biol. Chem. 281 17410-17419 [DOI] [PubMed] [Google Scholar]
- 22.Sugawara, H., Kurosaki, M., Takata, M., and Kurosaki, T. (1997) EMBO J. 16 3078-3088 [DOI] [PMC free article] [PubMed] [Google Scholar]
- 23.Boehning, D., and Joseph, S. K. (2000) J. Biol. Chem. 275 21492-21499 [DOI] [PubMed] [Google Scholar]
- 24.Wang, W., and Malcolm, B. A. (2002) Methods Mol. Biol. 182 37-43 [DOI] [PubMed] [Google Scholar]
- 25.Dellis, O., Dedos, S. G., Tovey, S. C., Taufiq Ur, R., Dubel, S. J., and Taylor, C. W. (2006) Science 313 229-233 [DOI] [PubMed] [Google Scholar]
- 26.Dellis, O., Rossi, A. M., Dedos, S. G., and Taylor, C. W. (2008) J. Biol. Chem. 283 751-755 [DOI] [PubMed] [Google Scholar]
- 27.Uchida, K., Miyauchi, H., Furuichi, T., Michikawa, T., and Mikoshiba, K. (2003) J. Biol. Chem. 278 16551-16560 [DOI] [PubMed] [Google Scholar]
- 28.Maes, K., Missiaen, L., Parys, J. B., De Smet, P., Sienaert, I., Waelkens, E., Callewaert, G., and De Smedt, H. (2001) J. Biol. Chem. 276 3492-3497 [DOI] [PubMed] [Google Scholar]
- 29.Hiratsuka, T. (2003) Eur. J. Biochem. 270 3479-3485 [DOI] [PubMed] [Google Scholar]
- 30.Schug, Z. T., da Fonseca, P. C., Bhanumathy, C. D., Wagner, L., II, Zhang, X., Bailey, B., Morris, E. P., Yule, D. I., and Joseph, S. K. (2008) J. Biol. Chem. 283 2939-2948 [DOI] [PubMed] [Google Scholar]
- 31.Wagner, L. E., 2nd, Li, W. H., Joseph, S. K., and Yule, D. I. (2004) J. Biol. Chem. 279 46242-46252 [DOI] [PubMed] [Google Scholar]
- 32.Takata, M., Homma, Y., and Kurosaki, T. (1995) J. Exp. Med. 182 907-914 [DOI] [PMC free article] [PubMed] [Google Scholar]
- 33.Li, C., Wang, X., Vais, H., Thompson, C. B., Foskett, J. K., and White, C. (2007) Proc. Natl. Acad. Sci. U. S. A. 104 12565-12570 [DOI] [PMC free article] [PubMed] [Google Scholar]
- 34.Ignoul, S., and Eggermont, J. (2005) Am. J. Physiol. 289 C1369-C1378 [DOI] [PubMed] [Google Scholar]
- 35.Vanoye, C. G., MacGregor, G. G., Dong, K., Tang, L., Buschmann, A. S., Hall, A. E., Lu, M., Giebisch, G., and Hebert, S. C. (2002) J. Biol. Chem. 277 23260-23270 [DOI] [PubMed] [Google Scholar]
- 36.Dong, K., Tang, L. Q., MacGregor, G. G., Leng, Q., and Hebert, S. C. (2005) EMBO J. 24 1318-1329 [DOI] [PMC free article] [PubMed] [Google Scholar]
- 37.Trapp, S., Haider, S., Jones, P., Sansom, M. S., and Ashcroft, F. M. (2003) EMBO J. 22 2903-2912 [DOI] [PMC free article] [PubMed] [Google Scholar]
- 38.Antcliff, J. F., Haider, S., Proks, P., Sansom, M. S., and Ashcroft, F. M. (2005) EMBO J. 24 229-239 [DOI] [PMC free article] [PubMed] [Google Scholar]
- 39.Tucker, S. J., Gribble, F. M., Proks, P., Trapp, S., Ryder, T. J., Haug, T., Reimann, F., and Ashcroft, F. M. (1998) EMBO J. 17 3290-3296 [DOI] [PMC free article] [PubMed] [Google Scholar]
- 40.Hamada, K., Miyata, T., Mayanagi, K., Hirota, J., and Mikoshiba, K. (2002) J. Biol. Chem. 277 21115-21118 [DOI] [PubMed] [Google Scholar]
- 41.Hamada, K., Terauchi, A., and Mikoshiba, K. (2003) J. Biol. Chem. 278 52881-52889 [DOI] [PubMed] [Google Scholar]
- 42.Futatsugi, A., Nakamura, T., Yamada, M. K., Ebisui, E., Nakamura, K., Uchida, K., Kitaguchi, T., Takahashi-Iwanaga, H., Noda, T., Aruga, J., and Mikoshiba, K. (2005) Science 309 2232-2234 [DOI] [PubMed] [Google Scholar]
- 43.Wojcikiewicz, R. J. (1995) J. Biol. Chem. 270 11678-11683 [DOI] [PubMed] [Google Scholar]
- 44.Zhang, X., Wen, J., Bidasee, K. R., Besch, H. R., Jr., Wojcikiewicz, R. J., Lee, B., and Rubin, R. P. (1999) Biochem. J. 340 519-527 [PMC free article] [PubMed] [Google Scholar]
- 45.Holtzclaw, L. A., Pandhit, S., Bare, D. J., Mignery, G. A., and Russell, J. T. (2002) Glia 39 69-84 [DOI] [PubMed] [Google Scholar]
- 46.Abe, K., Kogure, K., Yamamoto, H., Imazawa, M., and Miyamoto, K. (1987) J. Neurochem. 48 503-509 [DOI] [PubMed] [Google Scholar]


