

Abstract
Lipoprotein lipase (LPL) is the central enzyme in plasma triglyceride hydrolysis. In vitro studies have shown that LPL also can enhance lipoprotein uptake into cells via pathways that are independent of catalytic activity but require LPL as a molecular bridge between lipoproteins and proteoglycans or receptors. To investigate whether this bridging function occurs in vivo, two transgenic mouse lines were established expressing a muscle creatine kinase promoter-driven human LPL (hLPL) minigene mutated in the catalytic triad (Asp156 to Asn). Mutated hLPL was expressed only in muscle and led to 3,100 and 3,500 ng/ml homodimeric hLPL protein in post-heparin plasma but no hLPL catalytic activity. Less than 5 ng/ml hLPL was found in preheparin plasma, indicating that proteoglycan binding of mutated LPL was not impaired. Expression of inactive LPL did not rescue LPL knock-out mice from neonatal death. On the wild-type (LPL2) background, inactive LPL decreased very low density lipoprotein (VLDL)-triglycerides. On the heterozygote LPL knock-out background (LPL1) background, plasma triglyceride levels were lowered 22 and 33% in the two transgenic lines. After injection of radiolabeled VLDL, increased muscle uptake was observed for triglyceride-derived fatty acids (LPL2, 1.7×; LPL1, 1.8×), core cholesteryl ether (LPL2, 2.3×; LPL1, 2.7×), and apolipoprotein (LPL1, 1.8×; significantly less than cholesteryl ether). Skeletal muscle from transgenic lines had a mitochondriopathy with glycogen accumulation similar to mice expressing active hLPL in muscle. In conclusion, it appears that inactive LPL can act in vivo to mediate VLDL removal from plasma and uptake into tissues in which it is expressed.
Lipoprotein lipase (LPL) is the rate-limiting enzyme for hydrolysis of lipoprotein triglyceride (TG). The enzyme is bound to proteoglycans on the luminal side of capillaries and arteries and is especially abundant in muscle and adipose tissue. Through hydrolysis of TG in chylomicrons and large very low density lipoproteins (VLDL), LPL controls fatty acid uptake into tissues (reviewed in ref. 1).
It also has been proposed that LPL can facilitate cellular uptake of lipoproteins independent of its catalytic properties. More than 20 years ago, it was found that LPL molecules stay associated with chylomicrons after hydrolysis, and it was hypothesized that they might assist in chylomicron remnant uptake (2). Interest in this hypothesis was revived when Beisiegel et al. found that LPL was a ligand for the low density lipoprotein (LDL) receptor-related protein in hepatocytes and fibroblasts (3). Subsequently, it was shown in tissue culture that direct LPL-receptor interactions can enhance binding and cellular uptake of lipoproteins (reviewed in ref. 4). Evidence also has been provided that LPL can bridge between lipoproteins and heparan sulfate proteoglycans (reviewed in ref. 5). This could concentrate lipoproteins in the vicinity of receptors, resulting in a rapid receptor dependent uptake (6). Alternatively, bound lipoproteins could be taken up by cells along with proteoglycans as the latter are recycled (7). Finally, it is possible that LPL may mediate a selective uptake of cholesteryl ester via a process analogous to that shown for the uptake of high density lipoprotein (HDL) lipids by LPL (8) and hepatic lipase (9).
All of these suggested pathways involve catalytically inactive LPL and are based on in vitro observations. To test whether LPL can act this way in vivo, a structurally intact but catalytically inactive LPL protein was expressed in muscle of transgenic mice, and metabolic studies indicated that LPL devoid of enzymatic activity can increase tissue lipoprotein uptake.
METHODS
Mutation of LPL and Generation of Transgenic Mice.
A construction containing a human LPL (hLPL) minigene driven by a muscle creatine kinase (MCK) promoter (10) was site-specifically mutated at position G721 to A by using a PCR-based mutagenesis kit (Stratagene) and the following primers: 5′-caa tcc agg tcg acc taa ctc cgg tca tta aga c-3′ and 5′-gtc tta atg acc gga gtt agg tcg acc tgg att g-3′. This changed amino acid Asp(D)156 to Asn(N), a mutation shown to produce enzymatically inactive LPL that is secreted normally from cells (11, 12). The 156N-LPL containing construction (MCK-N-LPL) was released from the plasmid and was microinjected as described (13). Founder animals were crossed with wild-type (CBA × C57BL/6)F1 mice (The Jackson Laboratory) and with heterozygote LPL knock-out mice (LPL1; ref. 14). Pups heterozygous for LPL deficiency as well as the MCK-N-LPL transgene (LPL1/MCK-N-LPL) were crossed with LPL1 mice. The following genotypes resulted from this cross: 1/8 wild-type (LPL2), 1/8 wild-type plus 156N-LPL expression (LPL2/MCK-N-LPL), 1/4 LPL1, 1/4 LPL1/MCK-N-LPL, 1/8 LPL knock-out (LPL0), 1/8 LPL knock-out expressing 156N-LPL (LPL0/MCK-N-LPL). In addition, MCK-N-LPL transgenic mice were crossed with human apo CIII transgenic mice (15). Littermate controls (8–10 weeks old) were used for all experiments.
Genotyping of Induced Mutant Mice.
Genotypes at the LPL locus were determined from tail tip DNA by a 3-primer PCR as described (16). The MCK-N-LPL transgene was detected by amplifying a 306-bp fragment of the LPL cDNA with the primers 5′-gtc cat ctc ttg gga tac agc-3′ and 5′-ctc tgc aat cac gcg gat agc-3′ followed by TaqI digestion. This resulted in three fragments (109, 108, and 89 bp) in the unmutated and in two fragments (198 and 108 bp) in the mutated LPL minigene. Apo C-III mice were genotyped as described (17).
RNA Analysis for Tissue-Specific Transgene Expression.
RNA was extracted from frozen tissues and was reverse transcribed into cDNA by using a Gene Amp RNA PCR Kit (Perkin–Elmer). Reverse transcription–PCR on total RNA was performed with hLPL cDNA specific primers (18).
Plasma hLPL Protein Mass and LPL Activity Determination.
Post-heparin plasma (PHP) was obtained from age-matched male mice of each transgenic line and from a mouse line expressing unmutated, active hLPL in the muscle (MCK-WT-LPL; ref. 10). Heparin (100 units/kg) was injected into the tail vein, and 5 min later, blood was collected. The hLPL protein mass in preheparin plasma and PHP of individual mice was determined by ELISA as described (19). Because the mAb 5D2 was used as a capture and detection antibody, only homodimeric hLPL was recognized. LPL activity was determined by using a glycerol-based assay (20). Human and mouse LPL activities were distinguished by antibody inhibition (18).
Lipid and Lipoprotein Analysis.
Mice were fed a chow diet (4.5% wt/wt fat). Blood was taken after 8 h of daytime fasting. Plasma TG and cholesterol were determined by using commercial kits (Sigma) that were adapted to microtiter plates. Lipoprotein separation was performed with 60 μl of plasma from individual mice (21).
VLDL-Turnover and Organ Uptake Study.
VLDL was labeled in vivo with radioactive TG by using [1-14C]palmitic acid (17) and in vitro with [1,2(n)-3H]cholesteryl oleyl ether by using cholesteryl ester transfer protein (provided by A. Tall, Columbia Univ.) as reported (18). In addition, VLDL protein was labeled in vitro with 125I-tyramine cellobiose (22). After protein labeling, radioactive non-B apolipoproteins were removed by two incubations with 1.006 bottom mouse plasma. VLDL was isolated by ultracentrifugation. SDS/PAGE revealed that >90% of the protein label was in apo B. Less than 10% of 125I label was found in VLDL lipids. For turnover studies, VLDL was labeled with 1.5 × 10⁶ dpm [3H]cholesteryl oleyl ether and either 2 × 10⁵ dpm [14C]TG or 2 × 10⁶ dpm 125I-tyramine cellobiose and was injected into the tail vein of anesthetized mice (4–6 per group). VLDL turnover was determined from 15 μl of plasma drawn 1, 2, 5, 10, 20, 30, 45, and 60 min after injection. Data were analyzed for individual animals by using a two pool exponential decay model, and the half-life for each label was calculated. After 60 min, the blood was removed by cardiac puncture, the right atrium was opened, and the carcass was perfused through the left ventricle with 10 ml of PBS containing 10 units of heparin. Organs and plasma first were counted for 125I, then the lipids were extracted (23) and counted.
Histological Analysis.
Organs of 6-month-old mice were dissected, formaldehyde-fixed, paraffin-embedded, and cut and stained for hematoxylin/eosin and periodic acid Schiff by routine techniques. One muscle sample was post-fixed in 3% cacodylate-buffered glutaraldehyde (pH 7.3), was post-fixed with 1% OsO4 in sodium cacodylate, and was dehydrated and embedded in Agar 100. After screening of azur-methylene (L)-blue stained semithin sections by light microscopy, electron microscopy was performed as described (10). For staining of neutral lipids, organs were embedded in Tissue Tek and frozen, and 4-μm sections were stained with oil red-O and hematoxylin-eosin.
Statistical Analysis.
If not otherwise stated, results are given as mean ± SD. Statistical significance was tested by using two-tailed student’s t test or ANOVA. Analysis utilized the computer program prism (GraphPad, San Diego).
RESULTS
Generation of 156N-LPL Transgenic Mice.
After microinjection, four mice positive for the mutated minigene were found, and two transgenic lines were established. The G721 → A mutation resulted in the disappearance of a TaqI cutting site in the hLPL minigene and permitted screening of the transgenic mice. The tissue-specific pattern of transgene expression was determined. Human LPL mRNA was detected by reverse transcription–PCR in skeletal muscle; less was detected in the heart, but none was detected in other examined organs (Fig. 1).
Figure 1.

Generation of mice expressing inactive hLPL in muscle. (A) hLPL minigene with MCK promoter, cDNA (box), and intron 3. The catalytic triad and the mutation are marked. (B) Genomic screening by using a TaqI polymorphism. (C) Reverse transcription–PCR showing expression of hLPL in skeletal (Mu) and less expression in heart (H) muscle. Li, liver; AT, adipose tissue.
Plasma LPL Protein and Activity.
Fasted plasma and PHP were obtained from wild-type mice, both MCK-N-LPL transgenic lines and from mice expressing unmutated LPL in muscle (MCK-WT-LPL), and was analyzed for hLPL protein and activity. As shown in Table 1, wild-type mice had an insignificant amount of hLPL protein whereas the MCK-N-LPL transgenic lines had 3,054 ± 364 (transgenic line 1) and 3,517 ± 660 ng/ml (transgenic line 2) of hLPL protein (P < 0.0001 vs. LPL2 for lines 1 and 2, but the lines were not significantly different from each other). Both transgenic lines had an insignificant amount of hLPL activity, and mouse LPL activities were not significantly different from those of wild-type mice. The MCK-WT-LPL line expressing unmutated active hLPL with the same promoter had 1,478 ± 227 ng/ml hLPL protein and 10.8 ± 8.7 μmol released fatty acids/ml/h of hLPL activity. Therefore, as expected, the N-LPL transgene produced enzymatically inactive LPL protein. Unless otherwise stated, subsequent data are from experiments done by using line 2.
Table 1.
Plasma LPL protein mass and activity
| Genotype | Human LPL mass, ng/ml
|
PHP-LPL activity, μmol/ml/h
|
||
|---|---|---|---|---|
| Pre-heparin | Post-heparin | Human | Mouse | |
| LPL2 | <5.0 (5) | <5.0† (5) | <0.7 (7) | 7.6 ± 2.8* (7) |
| LPL2/MCK-N(1) | 43 ± 6.6* (3) | 3054 ± 364† (3) | <0.7 (3) | 3.5 ± 3.0* (3) |
| LPL2/MCK-N(2) | 42 ± 5.3* (3) | 3517 ± 660† (3) | <0.7 (5) | 3.7 ± 3.0* (5) |
| LPL2/MCK-WT | 36 ± 6.2* (3) | 1478 ± 227 (3) | 15 ± 11 (4) | 10.8 ± 8.7* (4) |
LPL mass measurements were specific for hLPL homodimers. As a control, a line expressing active LPL in muscle was used (LPL2/MCK-WT). Data are mean ± SD (n).
Lines expressing inactive (MCK-N) and normal LPL (MCK-Wt) are not different by ANOVA or t test.
P ANOVA <0.0001; Newman–Keuls post-test; P < 0.001 vs. LPL2 for both transgenic lines but were not significant from each other.
To verify that 156N-LPL bound normally to heparin-sensitive binding sites on endothelial surfaces, hLPL protein in pre-heparin plasma and PHP from the same animal were measured. In the transgenic lines expressing 156N-LPL, >98% of hLPL was heparin releasable (Table 1). The amount of preheparin hLPL in the two mutated LPL-expressing lines was not higher than in the MCK-WT-LPL line. This proved that the Asp156 → Asn mutation did not impair heparin binding of hLPL.
Rescue of LPL Knock-Out Mice.
Both MCK-N-LPL lines were bred with LPL1 mice, and the LPL1/MCK-N-LPL offspring again were crossed with LPL1 mice. In both lines, all LPL0/MCK-N-LPL pups (total of 11) died between 16 and 26 h of life. Therefore, inactive LPL did not rescue LPL0 mice.
Plasma Lipids and Lipoprotein Composition.
Plasma lipid and lipoprotein levels are shown in Table 2. On the LPL2 background, there was no significant difference in total TG levels, but VLDL-TG were decreased 27% in both transgenic lines. Compared with control mice, HDL cholesterol was significantly higher in line 1 but lower in line 2. These changes were reflected in the total cholesterol levels. On the heterozygous (LPL1) background, plasma TG were reduced 22 and 33% in the two MCK-N-LPL transgenic lines, respectively. These changes were mostly caused by decreased VLDL-TG levels. VLDL cholesterol was unchanged. On the apo C-III background, there were no changes in TG and VLDL-TG, but LDL-TG and cholesterol were lower in mice expressing inactive LPL. Therefore, transgenic expression of inactive LPL decreased VLDL-TG and VLDL cholesterol, and this effect was more pronounced on the LPL1 background. However, in the presence of high amounts of apo C-III, inactive LPL did not change VLDL but decreased LDL. It is unclear why HDL cholesterol increases in transgenic line 1 and decreases in line 2 on both the L2 and L1 backgrounds. It is possible that the increase in line 1 is caused by a metabolic effect of increased hydrolytic activity and that the decrease in line 2 is caused by a more severe myopathy obscuring the metabolic effect observed in line 1.
Table 2.
Plasma triglyceride, cholesterol, and lipoprotein levels in adult mice
| n | Total
|
VLDL
|
LDL
|
HDL
|
|||||
|---|---|---|---|---|---|---|---|---|---|
| TG | Cholesterol | TG | Cholesterol | TG | Cholesterol | TG | Cholesterol | ||
| LPL2 background | |||||||||
| LPL2† | 18 | 88 ± 16 | 84 ± 12 | 44 ± 14 | 5.4 ± 2.2 | 17 ± 3.1 | 12 ± 6.0 | 17 ± 4.1 | 69 ± 7.7 |
| LPL2/MCK-N(1) | 7 | 82 ± 8.8 | 98 ± 9.3* | 32 ± 8.0* | 5.1 ± 2.4 | 19 ± 5.8 | 15 ± 3.3 | 20 ± 7.0 | 84 ± 5.5** |
| LPL2/MCK-N(2) | 13 | 77 ± 12 | 75 ± 13 | 32 ± 5.1** | 4.9 ± 1.7 | 14 ± 1.7* | 11 ± 5.2 | 15 ± 3.0 | 58 ± 9.0** |
| P ANOVA | NS | <0.001 | <0.01 | NS | <0.005 | NS | NS | <0.0001 | |
| LPL1 background | |||||||||
| LPL1† | 17 | 118 ± 18 | 75 ± 11 | 67 ± 16 | 8.2 ± 2.4 | 20 ± 4.1 | 7.7 ± 3.9 | 18 ± 3.7 | 58 ± 9.4 |
| LPL1/MCK-N(1) | 8 | 92 ± 15** | 72 ± 5.6 | 49 ± 9.6* | 6.1 ± 2.1* | 23 ± 5.1 | 4.6 ± 1.9 | 22 ± 3.7 | 63 ± 7.2** |
| LPL1/MCK-N(2) | 10 | 79 ± 22** | 59 ± 9.7** | 43 ± 16** | 4.1 ± 1.1** | 17 ± 3.8 | 5.9 ± 2.5 | 16 ± 4.1 | 45 ± 7.3** |
| P ANOVA | <0.0001 | <0.001 | <0.0005 | <0.0001 | <0.05 | NS | NS | <0.0001 | |
| CIII transgenic background | |||||||||
| CIII | 8 | 758 ± 131 | 137 ± 13 | 634 ± 93 | 72 ± 16 | 53 ± 5.7 | 26 ± 5.1 | 35 ± 3.3 | 53 ± 5.4 |
| CIII/MCK-N(2) | 6 | 728 ± 109 | 129 ± 11 | 656 ± 172 | 72 ± 6.8 | 44 ± 4.5 | 14 ± 4.0 | 35 ± 3.9 | 48 ± 5.4 |
| P t test | NS | NS | NS | NS | <0.05 | <0.001 | NS | NS | |
All assays were done after an 8-h daytime fasting and are given as mg/100 ml. Both transgenic lines were bred with LPL1 mice, and the line (2) also was bred with apo CIII transgenic mice. NS, not significant.
Littermate controls from both transgenic lines were not significantly different, and the groups were pooled. Dunnett’s post-test vs. LPL2 or LPL1, respectively: ∗, P < 0.05; ∗∗, P < 0.01; ∗∗∗, P < 0.001.
VLDL Turnover and Organ Uptake Study.
Fig. 2 shows computer-generated plasma decay curves of VLDL labeled with [14C]palmitate-TG, [3H]cholesteryl oleyl ether and 125I-tyramine cellobiose protein by using a two-pool exponential decay model. For the calculation of TG turnover half-life, only 0- to 10-min plasma radioactivities were used because thereafter, >90% of the injected label had been cleared. On the LPL2 background, VLDL-TG and VLDL cholesterol turnover were not significantly different (t1/2 TG: LPL2, 1.2 ± 0.2 min; LPL2/MCK-N-LPL, 1.3 ± 0.2 min; t1/2 cholesteryl ether: LPL2, 11.9 ± 1.6 min; LPL2/MCK-N-LPL, 10.9 ± 4.3 min). As expected, turnover on the LPL1 background was slower than on LPL2 background. The MCK-N-LPL transgene increased the turnover rate on this background for both labels (t1/2 TG: LPL1, 2.7 ± 0.6 min; LPL1/MCK-N-LPL, 1.7 ± 0.4 min; P < 0.05; t1/2 cholesteryl ether: LPL1, 13.8 ± 3.2 min; LPL1/MCK-N-LPL, 10.4 ± 1.1 min; P < 0.05). The half-life of VLDL protein was significantly slower than for cholesteryl ether but was not different for the lines tested (t1/2 LPL2, 21 ± 2.5 min; LPL2/MCK-N-LPL, 21.4 ± 8.4 min; LPL1, 20 ± 5.0 min; LPL1/MCK-N-LPL, 17.9 ± 4.1 min; P not significant).
Figure 2.

VLDL turnover study. VLDL was labeled with [14C]palmitate to observe triglyceride hydrolysis (A), with [3H]cholesteryl oleyl ether as a marker for VLDL core lipids (B) and with [125I]-tyramine cellobiose apo B for lipoprotein particle uptake (C). The experiments were done on LPL2 (not shown in B and C) and on LPL1 background. Plasma radioactivity in percentage of 0-min value was calculated for each animal. Computer generated curves using a two pool decay model were added. ∗, P < 0.05 vs. LPL1.
The organ VLDL-lipid uptakes are shown in Fig. 3. In skeletal muscle, the MCK-N-LPL transgene increased the uptake of fatty acids from VLDL-TG 1.7-fold on LPL2 background (P < 0.001) and 1.8-fold on the LPL1 background (P < 0.01). The fatty acid radioactivity in heart muscle was decreased by ≈50% on both backgrounds; other organs were not affected significantly. The uptake of core cholesteryl ether into skeletal muscle was increased even more by the MCK-N-LPL transgene (2.3-fold on the LPL2; P < 0.01; 2.7-fold on the LPL1 background; P < 0.01). The uptake into heart and other organs was not altered significantly. The uptake of VLDL protein into muscle was not affected significantly on the LPL2 background but was increased 1.8-fold on LPL1 (P < 0.05). In muscle, the MCK-N-LPL transgene increased the ratio of cholesteryl ether dpm to protein dpm from 0.56 ± 0.1 to 0.82 ± 0.1 (P < 0.05, LPL2) and from 0.6 ± 0.1 to 0.83 ± 0.1 (P < 0.005, LPL1). On the LPL1 background, there was also an increase of the cholesteryl ether/protein ratio in the liver (1.4 ± 0.3 to 1.8 ± 0.41, P < 0.05). Therefore, muscle expression of inactive LPL increased the uptake of VLDL-TG, cholesteryl ester, and protein into the muscle tissue, with the uptake of cholesteryl ester more than protein.
Figure 3.

VLDL organ uptake study. The experiment was done as in Fig. 2. Organ uptake of palmitic acid was derived from VLDL-TG (A), VLDL cholesteryl ether (B), and VLDL particle (C) uptake. The mean radioactivity for each organ of the LPL2 animals was set to 100%. ∗, P < 0.05; ∗∗, P < 0.01; ∗∗∗, P < 0.001 each vs. LPL2 or LPL1, respectively.
Muscle Histology.
Routine and glycogen staining of muscle tissue from 6-month-old LPL2/MCK-N-LPL(2) mice showed an increased number of fibers with centralized nuclei and pathological glycogen storage (Fig. 4B). Nonspecific signs of muscle damage (adipose tissue enrichment of the endomysium, atrophic muscle fibers) were found. Azure blue stained semithin sections revealed a significantly increased number of mitochondria-rich muscle fibers (dark blue stained in Fig. 4D). Electron microscopy confirmed an increased number and size of partially pathologically altered mitochondria in the individual myocytes (data not shown). Oil red O stain did not show any neutral lipid storage (data not shown). The histological changes in LPL2/MCK-N-LPL line 1 mice were less pronounced and without glycogen storage. Therefore, muscle expression of inactive LPL resulted in the histological changes of a fatty acid influx induced myopathy.
Figure 4.
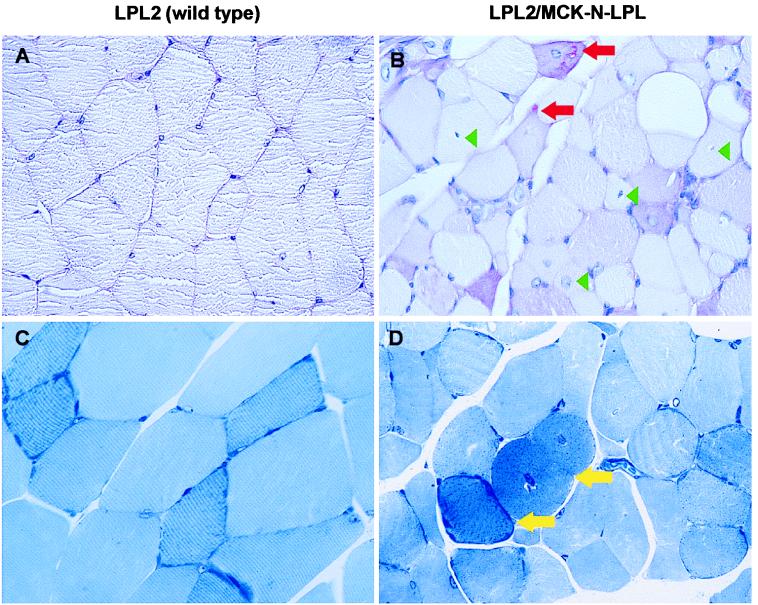
Muscle histology. Expression of inactive LPL in muscle leads to a fatty acid-induced mitochondriopathy. The femoral muscles of 6-month-old wild-type (A and C) and high inactive LPL-expressing mice (B and D) are shown. (A and B) Glycogen staining (periodic acid Schiff, ×113). (C and D) Semithin sections (azur-methylene-blue, ×113). Red arrows, subsarcolemnal glycogen (reddish); green arrowheads, examples for centralized nuclei; yellow arrows, dark-blue stained mitochondria.
DISCUSSION
By creating a transgenic mouse expressing mutated, catalytically inactive LPL in muscle, we show that LPL can affect cellular and plasma lipid metabolism via actions that are exclusive of hydrolysis of triglyceride in circulating lipoproteins. The LPL mutation in the catalytic triad, Asp156 to Asn, was based on one that had been reported in LPL-deficient patients (11). In vitro it produced inactive LPL protein that had normal heparin and lipid binding (12). The transgenic mice created expressing this mutated LPL in muscle had a large amount of hLPL protein in PHP but no hLPL activity. The 156N-LPL was in dimeric form because the ELISA assay only detects LPL dimers. Dimerization is important for lipoprotein particle uptake in vitro (24). Finally, the 156N mutation did not have a defect in binding to cell surface heparin because preheparin plasma concentrations were not higher than in mice expressing unmutated hLPL (MCK-WT-LPL; ref. 10), and plasma concentration of hLPL was increased almost 100-fold by heparin injection.
Muscle expression of inactive LPL affected metabolism of circulating lipoproteins. On the LPL1 background, plasma triglyceride levels were reduced by 22–33%. VLDL-TG were decreased even on the wild-type background. These lipoprotein changes were caused primarily by increased catabolism of VLDL. On the LPL1 background, the turnover rate of VLDL-TG in the 156N-LPL transgenics was almost doubled. VLDL-TG synthesis rate, as calculated from the turnover study, was not changed in the transgenic lines. VLDL-cholesteryl ether turnover was also slightly faster only on the LPL1 background. VLDL protein turnover was not influenced by the transgene, suggesting that the effect of VLDL particle uptake seen in muscle was not big enough to observe against the large amount of normal liver uptake of lipoprotein remnants.
Analysis of lipid uptake into tissues confirmed that the 156N-LPL was functioning in skeletal muscle. On both LPL2 and LPL1 backgrounds, fatty acid uptake from VLDL-TG was ≈70% greater in 156N-LPL containing skeletal muscle. However, this is most likely an underestimation because labeled palmitic acid can be degraded via normal fatty acid pathways and radioactive metabolites may leave the muscle within 60 min of the experiment. The uptake of cholesteryl ether from the VLDL core into skeletal muscle was increased 2.5-fold by the transgene. VLDL protein uptake was insignificantly higher on the LPL2 background but was increased 1.8-fold on the LPL1 background. Because both cholesteryl ether and tyramine cellobiose protein are nondegradable labels, a direct comparison for the muscle uptake of the two labels in individual mice was possible. Muscle expression of inactive LPL increased the cholesteryl ether uptake significantly (90%) more than that of VLDL protein. These data suggest that inactive LPL mediates selective uptake of cholesteryl ether into muscle via a process analogous to that described for uptake of HDL cholesteryl ester by LPL (8) and hepatic lipase (9).
It is not clear whether triglyceride uptake increases via whole particle influx only or also is caused by enhanced lipolysis. Inactive LPL may augment binding of VLDL-particles to the endothelium, and this may allow more effective hydrolysis by normal, active LPL. In the MCK-N-LPL transgenic mice, some active LPL molecules that otherwise would participate only in the binding process might be “free” to perform lipid hydrolysis. If this were true, VLDL binding rather than VLDL hydrolysis would be the rate-limiting step in the metabolism of TG-rich particles. This hypothesis would be consistent with our observation that 156N-LPL was most effective in the LPL1 mice, a model in which LPL hydrolysis is more limiting.
It also appears there was an increase in whole VLDL particle influx, as reflected by the increase of labeled protein uptake. In vitro experiments have shown a number of possible lipoprotein uptake pathways that can use inactive LPL. 156N-LPL may increase cellular uptake of VLDL by attaching to the lipoproteins and serving as a ligand for the LDL receptor-related protein family of receptors. The most likely candidate present in muscle is the VLDL receptor; this receptor has a high affinity for LPL in vitro (25). Alternatively, by increasing the association of VLDL with cells (myocytes and endothelium) via its “bridging” actions to proteoglycans (5), 156N-LPL may concentrate the lipoproteins in the vicinity of receptors (6) or may permit lipoprotein particle uptake along with recycling of cell surface proteoglycans (7). However, for all pathways, lipolysis may be necessary before particle uptake because large triglyceride-rich particles may not cross the endothelial barrier (26). Alternatively, the capillary endothelial layer may become more permeable by localized processes, such as lipolysis (27).
Overexpression of apo CIII in transgenic mice causes an increase in triglycerides because of decreased VLDL catabolism. Apo CIII was shown to inhibit the interaction of VLDL with heparan sulfate proteoglycans rather than be a direct inhibitor of LPL. Apo CIII also was shown to inhibit the interaction of lipoproteins with receptors (17, 28). In the context of the current study, the catalytically inactive LPL does not reduce VLDL levels in the presence of the apo CIII transgene suggesting a model in which LPL acts after the attachment of triglyceride rich lipoproteins to the heparan sulfate proteoglycan matrix. However, the reduction of LDL by inactive LPL suggests that LPL may help to overcome the inhibition of lipoprotein uptake by receptors caused by overexpression of apo CIII. Thus, inactive LPL may act at two steps in the lipoprotein clearance pathway: initially, lipolysis or selective lipid removal and, subsequently, receptor-mediated uptake.
No matter what the mechanism, excessive lipoprotein uptake appears to exceed the storage and oxidative capacity of the muscle and leads to a myopathy very similar to fatty acid-induced changes in the muscle tissue of mice overexpressing active LPL in the muscle (between the low and medium LPL-expressing line; ref. 10). Although the pathology was characteristic of fatty acid induced myopathy, whether this resulted from uptake of fatty acids or resulted from uptake of unlipolyzed lipoprotein triglyceride that was processed aberrantly within the cells is unknown.
If inactive LPL mediates increased lipoprotein uptake into skeletal muscle, why are the labeled fatty acids from VLDL-TG decreased in the hearts of the transgenic lines? Because the MCK-promoter expresses LPL not only in skeletal muscle but also in heart muscle (Fig. 1 and ref. 29), one would expect increased labeling in the heart as well. It is possible that the heart may burn more fatty acids, having over-adjusted to a high fatty acid uptake. Alternatively, because the heart has been shown recently to be capable of apo B synthesis (30), this may be up-regulated with enhanced secretion of reesterified fatty acids in the form of apo B-containing lipoproteins.
Expression of large amounts of inactive LPL in the muscle did not rescue LPL knock-out mice from neonatal death. This raises the interesting question of whether inactive LPL requires active LPL to exert its effects. Using our current mice, we cannot determine whether lipoprotein uptake would be increased in tissues that express only inactive LPL. However, by breeding 156N-LPL onto lines that express no active LPL in muscle, we plan to test whether active and inactive LPL proteins have synergistic actions. Another possibility relates to recent observations suggesting that LPL0 mice die, not of hyperlipidemia but from hypoglycemia associated with defective liver production of ketones, an alternative energy source for the brain and peripheral tissues (18). Thus, without LPL-mediated hydrolysis, remnant particles cannot be produced, and liver lipid uptake may be insufficient for ketone body production for glucose sparing, and the supply of fat to the muscle by inactive LPL may not be sufficient to spare enough energy for survival of these mice.
In summary, we have created a mouse model for exploring the functions of LPL other than catalytic activity. We have shown that inactive LPL increased the selective uptake of cholesteryl ester into cells and mediates organ uptake of VLDL particles. This resulted in a myopathy and in decreased VLDL triglycerides. The mouse model will be used for further investigation of nonenzymatic LPL functions.
Acknowledgments
The authors thank J. D. Smith for reviewing the manuscript and K. Storck, A. Strudl, and A. Fuchsbichler for excellent technical assistance. This study was supported by the National Institutes of Health Grants HL54591 (to J.L.B.), HL30086 (to J.D.B.), and HL45095 (to I.J.G.) and by the educational grant Me 1507/1-1 from the Deutsche Forschungsgemeinschaft (to M.M.).
ABBREVIATIONS
- LPL
lipoprotein lipase
- hLPL
human LPL
- LDL
low density lipoprotein
- TG
triglycerides
- VLDL
very low density lipoprotein
- HDL
high density lipoprotein
- PHP
post-heparin plasma
- MCK
muscle creatine kinase promoter
- MCK-WT-LPL
unmutated MCK-hLPL minigene
- MCK-N-LPL
MCK-hLPL minigene mutated G721 to A resulting in 156N-LPL
- LPL2
wild-type mouse LPL
- LPL1
heterozygote mouse LPL
- LPL0
LPL knock out
References
- 1.Goldberg I J. J Lipid Res. 1996;37:693–707. [PubMed] [Google Scholar]
- 2.Felts J M, Itakura H, Crane R T. Biochem Biophys Res Commun. 1975;66:1467–1475. doi: 10.1016/0006-291x(75)90524-0. [DOI] [PubMed] [Google Scholar]
- 3.Beisiegel U, Weber W, Bengtsson-Olivecrona G. Proc Natl Acad Sci USA. 1991;88:8342–8346. doi: 10.1073/pnas.88.19.8342. [DOI] [PMC free article] [PubMed] [Google Scholar]
- 4.Beisiegel U. Curr Opin Lipidol. 1995;6:117–122. doi: 10.1097/00041433-199506000-00002. [DOI] [PubMed] [Google Scholar]
- 5.Olivecrona G, Olivecrona T. Curr Opin Lipidol. 1995;6:291–305. doi: 10.1097/00041433-199510000-00009. [DOI] [PubMed] [Google Scholar]
- 6.Mulder M, Lombardi P, Jansen H, van Berkel T J, Frants R R, Havekes L M. J Biol Chem. 1993;268:9369–9375. [PubMed] [Google Scholar]
- 7.Obunike J C, Edwards I J, Rumsey S C, Curtiss L K, Wagner W D, Deckelbaum R J, Goldberg I J. J Biol Chem. 1994;269:13129–13135. [PubMed] [Google Scholar]
- 8.Rinninger F, Kaiser T, Mann W A, Meyer N, Greten H, Beisiegel U. J Lipid Res. 1998;39:1335–1348. [PubMed] [Google Scholar]
- 9.Santamarina-Fojo S, Haudenschild C, Amar M. Curr Opin Lipidol. 1998;9:211–219. doi: 10.1097/00041433-199806000-00005. [DOI] [PubMed] [Google Scholar]
- 10.Levak-Frank S, Radner H, Walsh A, Stollberger R, Knipping G, Hoefler G, Sattler W, Weinstock P H, Breslow J L, Zechner R. J Clin Invest. 1995;96:976–986. doi: 10.1172/JCI118145. [DOI] [PMC free article] [PubMed] [Google Scholar]
- 11.Ma Y H, Bruin T, Tuzgol S, Wilson B I, Roederer G, Liu M S, Davignon J, Kastelein J J, Brunzell J D, Hayden M R. J Biol Chem. 1992;267:1918–1923. [PubMed] [Google Scholar]
- 12.Emmerich J, Beg O U, Peterson J, Previato L, Brunzell J D, Brewer H B, Jr, Santamarina-Fojo S. J Biol Chem. 1992;267:4161–4165. [PubMed] [Google Scholar]
- 13.Walsh A, Ito Y, Breslow J L. J Biol Chem. 1989;264:6488–6494. [PubMed] [Google Scholar]
- 14.Weinstock P H, Bisgaier C L, Aalto-Setala K, Radner H, Ramakrishnan R, Levak-Frank S, Essenburg A D, Zechner R, Breslow J L. J Clin Invest. 1995;96:2555–2568. doi: 10.1172/JCI118319. [DOI] [PMC free article] [PubMed] [Google Scholar]
- 15.Ito Y, Azrolan N, O’Connell A, Walsh A, Breslow J L. Science. 1990;249:790–793. doi: 10.1126/science.2167514. [DOI] [PubMed] [Google Scholar]
- 16.Levak-Frank S, Weinstock P H, Hayek T, Hofmann W, Verdery R, Breslow J L, Zechner R. J Biol Chem. 1997;272:17182–17190. doi: 10.1074/jbc.272.27.17182. [DOI] [PubMed] [Google Scholar]
- 17.Aalto-Setala K, Fisher E A, Chen X, Chajek-Shaul T, Hayek T, Zechner R, Walsh A, Ramakrishnan R, Ginsberg H N, Breslow J L. J Clin Invest. 1992;90:1889–1900. doi: 10.1172/JCI116066. [DOI] [PMC free article] [PubMed] [Google Scholar]
- 18.Merkel M, Weinstock P H, Chajek-Shaul T, Radner H, Yin B, Breslow J L, Goldberg I J. J Clin Invest. 1998;102:893–901. doi: 10.1172/JCI2912. [DOI] [PMC free article] [PubMed] [Google Scholar]
- 19.Peterson J, Fujimoto W Y, Brunzell J D. J Lipid Res. 1992;33:1165–1171. [PubMed] [Google Scholar]
- 20.Nilsson-Ehle P, Schotz M C. J Lipid Res. 1976;17:536–541. [PubMed] [Google Scholar]
- 21.Havel R J, Eder H A, Bragdon J H. J Clin Invest. 1955;34:1345–1353. doi: 10.1172/JCI103182. [DOI] [PMC free article] [PubMed] [Google Scholar]
- 22.Pittman R C, Taylor C A., Jr Methods Enzymol. 1986;129:612–628. doi: 10.1016/0076-6879(86)29094-1. [DOI] [PubMed] [Google Scholar]
- 23.Dole V P. J Clin Invest. 1955;35:150–154. doi: 10.1172/JCI103259. [DOI] [PMC free article] [PubMed] [Google Scholar]
- 24.Krapp A, Zhang H, Ginzinger D, Liu M S, Lindberg A, Olivecrona G, Hayden M R, Beisiegel U. J Lipid Res. 1995;36:2362–2373. [PubMed] [Google Scholar]
- 25.Argraves K M, Battey F D, MacCalman C D, McCrae K R, Gafvels M, Kozarsky K F, Chappell D A, Strauss J F R, Strickland D K. J Biol Chem. 1995;270:26550–26557. doi: 10.1074/jbc.270.44.26550. [DOI] [PubMed] [Google Scholar]
- 26.Nordestgaard B G. Curr Opin Lipidol. 1996;7:269–273. doi: 10.1097/00041433-199610000-00002. [DOI] [PubMed] [Google Scholar]
- 27.Rutledge J C, Woo M M, Rezai A A, Curtiss L K, Goldberg I J. Circ Res. 1997;80:819–828. doi: 10.1161/01.res.80.6.819. [DOI] [PubMed] [Google Scholar]
- 28.Aalto-Setala K, Weinstock P H, Bisgaier C L, Wu L, Smith J D, Breslow J L. J Lipid Res. 1996;37:1802–1811. [PubMed] [Google Scholar]
- 29.Johnson J E, Wold B J, Hauschka S D. Mol Cell Biol. 1989;9:3393–3399. doi: 10.1128/mcb.9.8.3393. [DOI] [PMC free article] [PubMed] [Google Scholar]
- 30.Boren J, Veniant M M, Young S G. J Clin Invest. 1998;101:1197–1202. doi: 10.1172/JCI1785. [DOI] [PMC free article] [PubMed] [Google Scholar]