

Abstract
The mouse is an established model organism for the study of genomic imprinting. Mice with genetic material originating from only one parent (e.g., mice with uniparental chromosomal duplications) or gene mutations leading to epigenetic deficiencies have proven to be particularly useful tools. In the process of our studies we have accumulated a large set of expression microarray measurements in samples derived from these types of mice. Here, we present the collation of these and third-party microarray data that are relevant to genomic imprinting into a Web Atlas of Murine genomic Imprinting and Differential EXpression (WAMIDEX: https://atlas.genetics.kcl.ac.uk). WAMIDEX integrates the most comprehensive literature-derived catalog of murine imprinted genes to date with a genome browser that makes the microarray data immediately accessible in annotation-rich genomic context. In addition, WAMIDEX exemplifies the use of the self-organizing map method for the discovery of novel imprinted genes from microarray data. The parent-of-origin-specific expression of imprinted genes is frequently limited to specific tissues or developmental stages, a fact that the atlas reflects in its design and data content.
Keywords: genomic imprinting, gene expression, microarray, uniparental duplication, DNA methylation, histone methylation, self-organizing map
Introduction
Genomic imprinting in mammals refers to the establishment of heritable DNA methylation marks during oogenesis and spermatogenesis at a respectively distinct set of genomic loci, collectively called imprinting control regions (ICRs).1,2 In the offspring, the epigenetic difference in methylation between the maternally and the paternally inherited allele of an ICR leads to the parent-of-origin-specific expression of the imprinted genes under its control. Additional layers of transcriptional regulation limit the parent-of-origin-specific expression of many imprinted genes to subsets of tissues and/or developmental stages.3
Imprinting, while affecting only a relatively small number of genes, is crucial for mammalian development in that both a maternal and a paternal genome are required for viable offspring.4-6 Misregulation of imprinted genes contributes to birth defects, neoplasias, and developmental and neurological disorders in human7-10 and has recently been associated with assisted reproduction techniques.11 The effects of imprinting were first observed in the mouse.4,5 Since then, ∼90 murine and ∼50 human imprinted genes have been identified, with estimates of the total ranging between 100 and 600 for the mouse.12,13
The mouse is the predominant model organism for the study of mammalian genomic imprinting and its effects on growth, development and behaviour.14-17 One of the reasons is the availability of material in which imprinted gene expression is predictably altered, for example, parthenogenotes, gynogenotes and androgenotes,4,5 and mice with uniparental chromosomal duplications (UpDp)18,19 or gene mutations leading to deficiencies in imprint establishment or maintenance.20-24 In combination with expression microarray technology, these genetic tools have recently yielded large amounts of genomic scale data.24-28
WAMIDEX collects and renders immediately accessible expression microarray data sets that are pertinent to the study of genomic imprinting. This is achieved through three inter-connected components. A customized mirror installation of the UCSC genome browser29 serves to display microarray-specific annotation and measurements in the context of the rich genomic annotation and tool set that are provided by the UCSC genome browser project. A comprehensive catalog of known imprinted genes in the mouse relates the microarray data to the biomedical literature. The catalog provides both tissue- and developmental stage-specific information on the allele-specific expression and methylation of murine imprinted genes, as reported in the literature. This enables the direct comparison of microarray measurements with published findings. For a subset of the microarray data, WAMIDEX includes a data exploration interface derived from a similarity-based clustering of the data using the Self-Organizing Map method30,31 (SOM).
Results
A comprehensive catalog of murine imprinted genes
The currently ∼2,000 entries in the WAMIDEX catalog were manually extracted from ∼200 non-review articles, each containing empirical evidence for the allele-specific expression and/or methylation of a gene or genes in the mouse. For some genes, the evidence for imprinting is relatively weak, and for a small number, there are conflicting reports. Information in the original article on the developmental stage and/or tissue type of the assayed sample are also included in the catalog since for many imprinted genes, parent-of-origin-specific expression is limited to specific tissues and/or developmental stages. Continuous curation ensures that the catalog remains current.
The catalog has the form of a table. Each entry comprises a gene name (linked to Entrez Gene), its genomic location (linked to the genome browser component; see below), the developmental stage of the sample (negative values: days post coitum = dpc; positive values: days post partum = dpp), the tissue investigated and the gene's allele (m = maternal; p = paternal) or alleles (b = both; 0 = none) observed to be either expressed or unmethylated in the specified tissue and at the specified developmental stage. Citation details and a link to the PubMed record of the source article are provided. The table schema is fully documented online. The user interface includes download and free-form SQL query facilities.
Genome browser access to expression microarray data
A local customized mirror installation of the UCSC genome browser serves as the main interface to our collection of microarray data. The mirror is complete in the sense that the standard UCSC tools, including BLAT genomic sequence alignments,39 in-silico PCR, the table browser and custom tracks, are available. The microarray data are displayed in the context of the standard and regularly updated UCSC annotation for the mouse genome (NCBI build 36, UCSC mm8 genome).
The collection is organized into browser tracks that are selectable on the front page of WAMIDEX. Each track entry corresponds to a measurement by a particular set of oligonucleotide probes and is labelled with the probe level analysis results. A color code highlights significant results. In addition, a significance threshold can be defined by the user to avoid non-significant results from being displayed. To aid the interpretation of the microarray measurements, we added tracks that show the regions (target sequences) to which Affymetrix designed their oligonucleotide probes and the positions of the probes themselves. The tracks also provide information on the specificity of target sequences and probes. Like the standard UCSC annotation tracks, each added track is accompanied by an online description page with details on methods and usage. Figure 1 illustrates the browser component of WAMIDEX.
Figure 1.
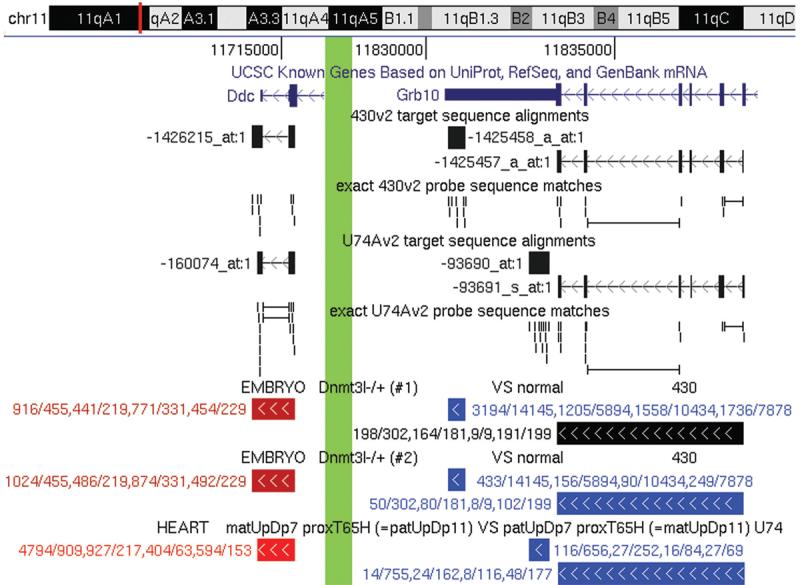
Genome browser output for the imprinted Ddc/Grb10 locus on Chr 11qA1. Because of space limitations, the 5′ part of Ddc and the approximately 70 kb large intergenic region between Ddc and Grb10 was removed from the output (thick green vertical line). The UCSC Known Genes track at the top shows the 3′-most introns and exons of Ddc and Grb10. The subsequent 430v2 and U74Av2 tracks display the target sequence alignments and exact probe matches of the 430v2 and U74Av2 probe sets that represent Ddc and Grb10, respectively. In the following experimental tracks, the measurements displayed for the two replicate Dnmt3l−/+ experiments were taken by 430v2 probe sets (Ddc: 1426215_at; Grb10: 1425458_a_at and 1425457_a_at), while the measurements in UpDp heart samples were made with U74Av2 probe sets (Ddc: 160074_at; Grb10: 93690_at and 93691_s_at). The color of and the text label with the expression ratios (GCOS/MAS5,35 PLIER,36 GC-RMA,37 RMA38) next to the track entries for, for example, Ddc indicate a roughly two-fold upregulation in Dnmt3l−/+ versus normal 8.5 dpc embryos and four- to six-fold more transcript in paternal UpDp than in maternal UpDp newborn heart samples. These data suggested imprinted paternal-only expression of Ddc in heart, which we recently confirmed.47 Grb10 is a known imprinted gene that is expressed from the maternal allele and positively regulated by maternal methylation in all tissues except brain60,61 and this was reflected by our
The data sets for the Dnmt3l−/+ and Chr 12 and Chr 18 UpDp experiments have not previously been publicly available. Design and execution of the UpDp experiments are analogous to our previous investigation of UpDp's of Chrs 7 and 11,27 for which the microarray data are also available via WAMIDEX. Briefly, an imprinted gene within the respectively uniparentally duplicated region is expected to show extreme expression differentials when comparing a maternal UpDp (matUpDp) sample with a matched paternal UpDp (patUpDp) sample, provided the gene is expressed and imprinted in the assayed tissue and at the assayed developmental stage. Similarly, the expression levels of imprinted genes that are under the control of maternally methylated ICRs ought to differ between Dnmt3l−/+ and wildtype embryos, provided they are expressed and imprinted at the 8.5 dpc stage. Figure 2 provides a summary of the actual differential expression measurements for known imprinted genes in the Dnmt3l−/+, Chr 12 UpDp and Chr 18 UpDp experiments.
Figure 2.

Differential expression measurements for known imprinted genes (blue gene name: expressed from the paternal allele; red: maternally expressed). Gene expression was compared between (A) Dnmt3l−/+ (average of two independent samples and array hybridizations) versus normal 8.5 dpc embryos, (B) 15.5 dpc embryos with maternal versus paternal Chr 12 UpDp, (C) 15.5 dpc placentae with maternal versus paternal Chr 12 UpDp, and (D) 8.5 dpc embryos with maternal versus paternal Chr 18 UpDp. Genes expressed at low absolute levels in both respective sample types were excluded. The shown expression ratio (log2 scale) for a gene is the median of four ratios: one for each of the four probe level analysis methods used. The ratios of distinct probe sets representing the same gene and yielding consistent measurements were again summarised by their median. The y-axis has been limited to show ratios up to a 16-fold differential (+/−4), a limit that was exceeded by Cdkn1c in (A) and Gtl2 in (B). (A) genes are ordered by Chr; an uninterrupted block of genes with the same background (white, grey or blue) corresponds to a set of genes belonging to the same coordinately regulated imprinted cluster. A blue background indicates a cluster regulated by a paternally methylated ICR, while white and grey stand for maternally methylated ICRs. For each of Nespas, Ube3a, Gtl2, Rian and Air, multiple representative probe sets exist that gave very different results, shown here side-by-side. For Nesp, GnasXl and Gnas, there is only a single probe set located in the 3′ UTR common to all three genes. (B–D) show only known imprinted genes on the respectively uniparentally duplicated Chr.
WAMIDEX includes the microarray data from ref. 24, which compares gene expression between wildtype and mutant placentae that lack histone methyltransferase G9a activity, because of the role of G9a in placenta-specific imprinting. This complements the embryonic Dnmt3l−/+ data. The microarray-based comparison of gene expression between gynogenetic and androgenetic embryos at the blastocyst stage28 is a whole genome approach to the identification of imprinted genes that is analogous to the chromosome-scale UpDp methodology. An earlier attempt at the 9.5 dpc stage26 suffered from high false-positive rates due to the early and extreme divergence of parthenogenetic and androgenetic embryonic development.42 The gynogenetic/androgenetic blastocyst and UpDp approaches complement each other in that the former is limited to genes that are expressed at at very early stage of development, while the latter is limited to chromosome-scale genomic regions but permits assaying later stages of development and specific tissues. The two sets of gene expression measurements in oocytes at different stages of development32,33 and the analogue for spermatogenesis34 are relevant to epigenetics in general33,34 and to imprinting in particular because of evidence suggesting that transcription events during germ cell development may facilitate imprint establishment3,43,44 (Gavin Kelsey, personal communication).
To complement the microarray expression data, in particular the G9a−/− data set, we have included summary data on histone modifications from ref. 45. The corresponding tracks show genomic intervals that were found to be significantly enriched for H3 K4, K9 and K27 Me3 in embryonic stemcells (ES), mouse embryonic fibroblasts (MEF) and neural progenitor cells (NP). Detailed browser views of the data for genomic regions of limited size can be generated at http://www.broad.mit.edu/seq_platform/chip/ and added to WAMIDEX as custom tracks.
Co-differential expression analysis with the self-organizing map (SOM)
To identify novel and possibly tissue-specifically imprinted genes, we applied the SOM30 to the microarray data from the Dnmt3l−/+ and UpDp experiments for proximal Chrs 7 and 11. The SOM performs a projection of typically high-dimensional data onto a two-dimensional map composed of discrete elements. Each of these elements becomes associated with a set of similar data points, akin to a k-means cluster. On the two-dimensional map, the distance between two elements is inversely proportional to the similarity of the clusters that they represent.
In our analysis, a data point corresponds to a transcript, represented by microarray probe sets, that maps to within the uniparentally duplicated regions of Chrs 7 and 11 proximal of the respective T65H translocation breakpoint.25,46 Each data dimension is equivalent to the comparison of gene expression between two samples, specifically, Dnmt3l−/+ versus wildtype 8.5 dpc embryo, or maternal versus paternal UpDp material of the same age and tissue type. Each of these comparisons results in an expression ratio for each transcript, based on the measurements taken by the representative probe sets. Collectively, we refer to these expression ratios as the differential expression profile of the transcript.
The set of differential expression profiles for transcripts on proximal Chrs 7 and 11 included profiles for 14 known imprinted genes. The assignment of their profiles to clusters and their relative position on the map were overall consistent with reports in the literature on the allele- and tissue-specific expression of these genes and their maternal methylation dependence (Fig. 3 and online documentation). The SOM assigned the gene Ddc to a cluster in close proximity to clusters containing many known imprinted, paternally expressed and maternally methylated genes. The further rapid exploration of this result was facilitated by a web interface that integrates the SOM with the other components of WAMIDEX. This revealed that the allele-specific expression of Ddc was most pronounced in heart and that Ddc is located only ∼70 kb downstream of the known reciprocally imprinted gene Grb10 (Fig. 1). We recently confirmed the imprinted, paternal-specific expression of Ddc in murine heart tissue.47
Figure 3.
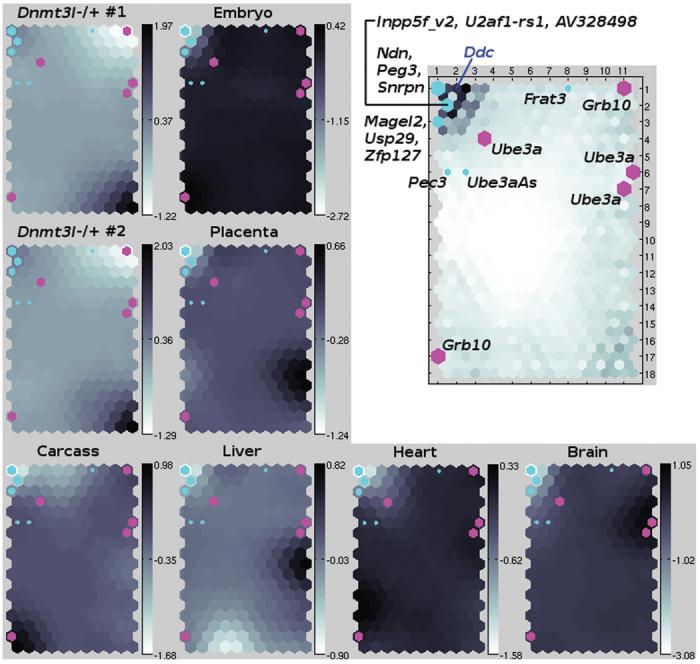
The SOM generated from the Dnmt3l−/+ and UpDp microarray for proximal Chrs 7 and 11. Left and bottom: the map has eight layers, one layer per comparative microarray experiment (2x Dnmt3l−/+ versus normal 8.5 dpc embryo; maternal versus paternal UpDp in 13.5 dpc embryo and placenta, newborn brain, heart, liver and carcass). Hexagons correspond to SOM elements, i.e., clusters of similar differential expression profiles. The degree of shading of a hexagon in a particular layer indicates the degree (log2-scale) and direction of differential expression that was observed on average for members of the cluster in the experiment that corresponds to the layer. The superimposed turquoise or magenta hexagons mark clusters containing differential expression profiles of known paternally or maternally expressed imprinted genes, respectively. Top-right: In this universal distance matrix visualisation of the SOM,62,31 hexagons have been labeled with known imprinted gene symbols. Ddc (blue) marks the cluster containing the paternally expressed heart-specifically imprinted Dopa decarboxylase gene.47 Here, the degree of hexagon shading indicates how dissimilar the neighboring clusters are, which helps to identify particularly distinct “super”-clusters like the region in the top-left corner of the map that contains Ddc and most of the other known paternally expressed imprinted genes.
Discussion
Related web resources
There are three other web resources devoted to genomic imprinting: the University of Otago's Imprinted Gene and Parent-of-origin Effect Database12 (http://igc.otago.ac.nz/), the MRC's Imprinting Resource at Harwell46 (http://www.har.mrc.ac.uk/research/genomic_imprinting/) and the Genomic Imprinting Website (http://www.geneimprint.org/). While there necessarily is some overlap with WAMIDEX, each of these sites has a unique and different focus. The MRC's resource relates known imprinted genes to chromosomal abnormalities and their phenotypes in the mouse. The Otago database provides brief literature-derived descriptions of known imprinted genes and other parent-of-origin effects for a wide range of different organisms. The Genomic Imprinting Website is a portal to imprinting-related news, articles and meetings that also provides tables of murine and human imprinted genes.
Role of WAMIDEX
WAMIDEX aims to provide access to microarray expression data that are specifically relevant to genomic imprinting and epigenetics, in a way that allows the immediate exploration of the data, their relation to the biomedical literature on imprinting, and the generation of testable hypotheses. Cases where a hypothesis regards predetermined genomic loci are served by exploring the microarray measurements via the genome browser component. The SOM method supports hypothesis generation based on similarities between expression profiles across multiple experiments.
Choice of the SOM method
Several computational methods have been developed that aid the analysis of multi-dimensional data like the above differential expression profiles; for example, principal components/curves analysis (PCA),48,49 k-means clustering,50 and the Sammon projection.51 We chose to utilise the SOM since it combines PCA-like dimensionality reduction and k-means-like similarity-based clustering with intuitive and space efficient map-like visualisations of the analysis results that can readily be turned into a graphical and interactive data exploration tool.31 The SOM component of WAMIDEX exemplifies this for the purpose of novel imprinted gene identification, and illustrates how its integration with other tools helps to rapidly test and refine initial hypotheses.
Chr 12 UpDp and Chr 18 UpDp and Dnmt3l−/+ results
The microarray measurements in matUpDp versus patUpDp samples for Dlk1, Gtl2 and Rian on Chr 12, and Impact on Chr 18 reflected their known parent-of-origin-specific expression pattern (Fig. 2B-D). The genome-wide expression data in Dnmt3l−/+ embryos and G9a−/− placentae provide a global view of the effects on transcription during early development of a lack of key epigenetic regulators. Reference 24 discusses the G9a−/− results in detail. Specifically for the Ddc/Grb10 locus, the Dnmt3l−/+ results are discussed in ref. 47.
The mechanism by which a particular ICR regulates the imprinted genes under its control differs in complexity between distinct imprinted clusters, with “microimprinted” domains being the most parsimonious cases.3 In these cases, a CGI over or in close proximity to a promoter serves as the ICR. The ICR is maternally methylated with the direct effect of silencing the maternal allele of the promoter. This model of regulation implies that failure to establish maternal methylation marks during oogenesis in Dnmt3l−/− females ought to reactivate the maternal allele of the affected imprinted genes in Dnmt3l−/+ offspring, leading to a roughly two-fold increase of expression relative to wildtype controls. Our microarray measurements were consistent with the model's prediction in nearly all cases (Mcts2, Mest, Peg3, Inpp5f_v2, U2af1-rs1, Slc38a4, Impact) of a known maternally methylated and promoter-associated CGI ICR where the respective gene is not embedded in a larger cluster (Fig. 2A). The exceptions were Nnat (only a ∼35% increase in expression), Zac1 (a more than 5-fold increase) and Air (inconsistent probe set-dependent results). However, the observed silencing of Igf2r is consistent with the established model of regulation at the Air/Igf2r locus.52
Of the larger clusters with maternally methylated ICRs, the Kvlqt1 cluster behaved closest to expectations. While the probe set for Kvlqt1as only detected a minor increase in expression, the observed downregulation/silencing of the other, maternally expressed imprinted genes is broadly consistent with the model of silencing by Kvlqt1as in cis.53
The regulation of the Sgce/Peg10 cluster has not been studied in detail. A CGI overlapping the Peg10 promoter and in close proximity to the Sgce promoter was identified as the likely ICR.54 Our results are consistent with a direct silencing effect of maternal methylation on Sgce and Peg10 and an indirect activating effect on Neurabin and Asb4. Pon2 was only found to be imprinted in the placenta so that its upregulation in Dnmt3l−/+ embryo (including yolk sac) is unexpected.
The regulation of the Ube3a cluster is complex and incompletely understood. It involves an ICR at the Snrpn promoter and a large paternally expressed Ube3a antisense transcript that initiates upstream of but also incorporates Snrpn.55,56 Only two of the many paternally expressed genes in the cluster were significantly upregulated in Dnmt3l−/+ embryo. The results for Ube3a, the only maternally expressed gene, were inconsistent, depending on the position of measurement within the gene.
A similar inconsistency was observed for Nespas in the Gnas cluster. For Nesp, GnasXl and Gnas, only a single probe set in the common 3′ UTR is available that did not detect a change of transcript amounts in Dnmt3l−/+ embryo, likely due to the reciprocal effects on these genes57 that are normally expressed from different parental alleles.58
Paternally methylated ICRs regulate imprinting in the Igf2/H19 and Dlk1/Gtl2 clusters, and at the Rasgrf1 locus. The microarrays did not detect Rasgrf1 expression at the 8.5 dpc stage, precluding comparisons between Dnmt3l−/+ and wildtype embryos. In contrast, gene expression in the Igf2/H19 and the Dlk1/Gtl2 clusters was readily detectable. Furthermore and contrary to expectations, expression levels differed between Dnmt3l−/+ and wildtype embryos. The effect on Igf2/H19 was a relatively mild (∼20%) but consistent upregulation of both the maternally and the paternally expressed genes. Dlk1 responded with a more than two-fold increase in expression, Rtl1as increased by ∼40%, while the results for Gtl2 and Rian were probe set-dependent. The ICR imprint and parent-of-origin-specific expression are unchanged at Igf2/H19 in Dnmt3l−/+ embryos.21 and we assume that to be the case at Dlk1/Gtl2 as well. Thus, we propose that the observed effects are instead due to changes in the developmental progression of Dnmt3l−/+ versus wildtype embryos and specifically, the action of Zac1 within the network of imprinted genes.59
Novel imprinted gene identification and false positives
We previously quantified the relationship between sensitivity and false positive rate for our expression microarray-based methodology of identifying novel imprinted genes in mice carrying uniparental duplications.27 In general, the abundance of a transcript in a sample positively correlates with the accuracy of microarray measurements of its quantity. For genes with overall low expression levels, the false positive rate when identifying novel imprinted genes from comparative microarray data is therefore higher than the averages calculated in ref. 27. The different probe level analysis algorithms (MAS5, PLIER etc.,) provide results on different scales that are not strictly comparable. However, a practical rule with respect to the microarray data in WAMIDEX is to consider absolute measurements in the low hundreds (linear scale) and expression ratios derived from two such measurements with scepticism. In these cases, corroborating measurements by other probe sets and/or from independent experiments are crucial to avoid false positives.
Future additions to WAMIDEX
Currently, our collection of microarray data on gene expression in UpDp mice covers Chrs 7, 11, 12 and 18, home to ∼60% of all known murine imprinted genes. We recently conducted additional microarray experiments that will extend the covered portion of the genome to Chrs 2, 4, 6 and 9. An additional set of expression microarray measurements in embryos that lack maternal as well as paternal methylation imprint marks will soon be made available too.
R.S., the corresponding author, is the main developer and curator of the atlas, who invites suggestions for improvements, corrections and contributions.
Methods
Previously described and deposited microarray experiments
Sample preparation and array hybridization details for these experiments (G9a−/− placentae,24 various tissues of mice with UpDp's of Chrs 7 and 11,27 gynogenetic and androgenetic blastocysts,28 oocytes32,33 and male germ cells34 at different stages of development) are given in the referenced publications.
Dnmt3l−/+ microarray experiment
The majority of ICRs are methylated on the maternally inherited allele. During oogenesis, DNA methyltransferase 3-like (Dnmt3l) is required for the establishment of these methylation imprints.21 Dnmt3l-deficient dams were crossed with wildtype sires to obtain Dnmt3l−/+ embryos that lack maternal methylation imprints.21 Total RNA from eight and six (two distinct litters) 8.5 dpc Dnmt3l−/+ embryos and their visceral yolk sacs was pooled and gene expression assayed using Affymetrix 430 2.0 microarrays, constituting two biologically independent replicate experiments. A single wildtype sample derived from six pooled 8.5 dpc embryos including their yolk sacs was assayed to provide a baseline of expression. The microarray hybridisations were performed according to the standard Affymetrix protocols, as described in ref. 27. The raw array data are available from the Gene Expression Omnibus (GEO) under accession number GSE8756.
UpDp of Chr 12 microarray experiment
This and the following (UpDp of Chr 18) experiment are analogous in design to our previous study of UpDp's of Chrs 7 and 11.27 RNA probes were made from single 15.5 dpc embryos and placentae with either maternal or paternal UpDp of Chr 12.19 Embryo samples were hybridised to 430A 2.0 arrays, while the U74v2 array set was used for placental samples. The standard Affymetrix protocols were used, as described in ref. 27. GEO accession number: GSE10081.
UpDp of Chr 18 microarray experiment
Total RNA was extracted from pools of 8.5 dpc embryos (excluding yolk sacs) with either maternal or paternal UpDp of Chr 18. The RNA was amplified using the RiboAmp RNA amplification kit (Arcturus) and biotin-labelled with an Enzo labelling kit, according to the RiboAmp manual. The samples were hybridised to 430 2.0 arrays according to the standard Affymetrix protocols. GEO accession number: GSE10085.
Microarray probe level analysis
For each of the above experiments, all arrays of the same model were analysed together to yield absolute expression values that are directly comparable across arrays. The analysis was repeatedly and independently performed for each of four commonly used methods (GCOS/MAS5,35 PLIER,36 GC-RMA37 and RMA;38 ArrayAssist implementations with standard parameters). While each method yields absolute values on a distinct scale, derived expression ratios are comparable between methods and ought to be similar (large discrepancies suggest an unreliable measurement). For some studies, comparisons between two arrays were carried out using the Affymetrix GCOS35 comparative gene expression analysis feature to calculate change p-values and Signal Log Ratios (SLRs). Change p-value weighted SLRs (vSLR and uSLR) were computed as described in ref. 27. The online documentation for each microarray browser track contains further details.
Microarray target sequence and probe alignments
The target sequences of the Affymetrix expression microarray probe sets on the 430 2.0 array and the U74v2 array set were aligned to the mouse genome (NCBI build 36) using BLAT.39 Exact matches of single probes to the genome were determined using Perl where probes spanning splice sites were identified based on the set of UCSC Known Genes.40
Self-organizing map analysis
Matlab in conjunction with the SOM toolbox41 was used for the similarity-based clustering of the microarray data for UpDp's of Chrs 7 and 11, and for the visualisation of the results. The process is documented in detail online.
Acknowledgements
We thank Andrew Wood, Ruth McCole, Thomas Schlitt and Ian Morison for critical reading of the manuscript and helpful comments, Colin Beechey and Jo Peters for the T65H mouse translocation samples, Lara Underkoffler and Joelle Collins for experimental assistance with some of the microarrays, and the MRC's Imprinting Resource at Harwell whose literature section provided the seed for the catalog component of our atlas. This work was supported by the European Molecular Biology Organization (R. S.), the Biotechnology and Biological Sciences Research Council and The Wellcome Trust (R. O.), the Guy's and St. Thomas' Charity (R. O.), the Agence Nationale pour la Recherche (D. B.).
Abbreviations
- BLAT
blast-like alignment tool
- CGI
CpG island
- Chr
chromosome
- Chrs
chromosomes
- GC-RMA
see RMA
- GCOS
genechip operating software
- GEO
gene expression omnibus
- ICR
imprinting control region
- MAS5
microarray suite, version 5
- MRC
medical research council
- PCR
polymerase chain reaction
- PLIER
probe logarithmic intensity error
- RMA
robust multi-array analysis
- SLR
signal log ratio
- SOM
self-organizing map
- SQL
structured english query language
- UCSC
university of california, santa cruz
- UpDp
uniparental chromosomal duplication
- WAMIDEX
web atlas of murine genomic imprinting and differential expression
References
- 1.da Rocha ST, Ferguson Smith AC. Genomic imprinting. Curr Biol. 2004;14:646–9. doi: 10.1016/j.cub.2004.08.007. [DOI] [PubMed] [Google Scholar]
- 2.Bourc'his D, Proudhon C. Sexual dimorphism in parental imprint ontogeny and contribution to embryonic development. Mol Cell Endocrinol. 2008;282:87–94. doi: 10.1016/j.mce.2007.11.025. [DOI] [PubMed] [Google Scholar]
- 3.Wood AJ, Oakey RJ. Genomic imprinting in mammals: emerging themes and established theories. PLoS Genetics. 2006;2:147. doi: 10.1371/journal.pgen.0020147. [DOI] [PMC free article] [PubMed] [Google Scholar]
- 4.McGrath J, Solter D. Completion of mouse embryogenesis requires both the maternal and paternal genomes. Cell. 1984;37:179–83. doi: 10.1016/0092-8674(84)90313-1. [DOI] [PubMed] [Google Scholar]
- 5.Surani MA, Barton SC, Norris ML. Development of reconstituted mouse eggs suggests imprinting of the genome during gametogenesis. Nature. 1984;308:548–50. doi: 10.1038/308548a0. [DOI] [PubMed] [Google Scholar]
- 6.Wu Q, Kumagai T, Kawahara M, Ogawa H, Hiura H, Obata Y, Takano R, Kono T. Regulated expression of two sets of paternally imprinted genes is necessary for mouse parthenogenetic development to term. Reproduction. 2006;131:481–8. doi: 10.1530/rep.1.00933. [DOI] [PubMed] [Google Scholar]
- 7.Jiang YH, Bressler J, Beaudet AL. Epigenetics and human disease. Annu Rev Genomics Hum Genet. 2004;5:479–510. doi: 10.1146/annurev.genom.5.061903.180014. [DOI] [PubMed] [Google Scholar]
- 8.Monk D, Moore GE. Intrauterine growth restriction—genetic causes and consequences. Semin Fetal Neonatal Med. 2004;9:371–8. doi: 10.1016/j.siny.2004.03.002. [DOI] [PubMed] [Google Scholar]
- 9.Nicholls RD, Knepper JL. Genome organization, function, and imprinting in Prader-Willi and Angelman syndromes. Annu Rev Genomics Hum Genet. 2001;2:153–75. doi: 10.1146/annurev.genom.2.1.153. [DOI] [PubMed] [Google Scholar]
- 10.Feinberg AP. Cancer epigenetics is no Mickey Mouse. Cancer Cell. 2005;8:267–8. doi: 10.1016/j.ccr.2005.09.014. [DOI] [PubMed] [Google Scholar]
- 11.Trasler JM. Gamete imprinting: setting epigenetic patterns for the next generation. Reprod Fertil Dev. 2006;18:63–9. doi: 10.1071/rd05118. [DOI] [PubMed] [Google Scholar]
- 12.Morison IM, Ramsay JP, Spencer HG. A census of mammalian imprinting. Trends Genet. 2005;21:457–65. doi: 10.1016/j.tig.2005.06.008. [DOI] [PubMed] [Google Scholar]
- 13.Luedi PP, Hartemink AJ, Jirtle RL. Genome-wide prediction of imprinted murine genes. Genome Res. 2005;15:875–84. doi: 10.1101/gr.3303505. [DOI] [PMC free article] [PubMed] [Google Scholar]
- 14.Barlow DP. Gametic imprinting in mammals. Science. 1995;270:1610–3. doi: 10.1126/science.270.5242.1610. [DOI] [PubMed] [Google Scholar]
- 15.Ogawa H, Ono Y, Shimozawa N, Sotomaru Y, Katsuzawa Y, Hiura H, Ito M, Kono T. Disruption of imprinting in cloned mouse fetuses from embryonic stem cells. Reproduction. 2003;126:549–57. doi: 10.1530/rep.0.1260549. [DOI] [PubMed] [Google Scholar]
- 16.Li L, Keverne EB, Aparicio SA, Ishino F, Barton SC, Surani MA. Regulation of maternal behavior and offspring growth by paternally expressed Peg3. Science. 1999;284:330–3. doi: 10.1126/science.284.5412.330. [DOI] [PubMed] [Google Scholar]
- 17.Plagge A, Isles AR, Gordon E, Humby T, Dean W, Gritsch S, Fischer Colbrie R, Wilkinson LS, Kelsey G. Imprinted Nesp55 influences behavioral reactivity to novel environments. Mol Cell Biol. 2005;25:3019–26. doi: 10.1128/MCB.25.8.3019-3026.2005. [DOI] [PMC free article] [PubMed] [Google Scholar]
- 18.Oakey RJ, Beechey CV. Imprinted genes: Identification by chromosome rearrangements and post-genomic strategies. Trends Genet. 2002;18:359–66. doi: 10.1016/s0168-9525(02)02708-7. [DOI] [PMC free article] [PubMed] [Google Scholar]
- 19.Georgiades P, Watkins M, Surani MA, Ferguson Smith AC. Parental origin-specific developmental defects in mice with uniparental disomy for chromosome 12. Development. 2000;127:4719–28. doi: 10.1242/dev.127.21.4719. [DOI] [PubMed] [Google Scholar]
- 20.Li E, Beard C, Jaenisch R. Role for DNA methylation in genomic imprinting. Nature. 1993;366:362–5. doi: 10.1038/366362a0. [DOI] [PubMed] [Google Scholar]
- 21.Bourc'his D, Xu GL, Lin CS, Bollman B, Bestor TH. Dnmt3L and the establishment of maternal genomic imprints. Science. 2001;294:2536–9. doi: 10.1126/science.1065848. [DOI] [PubMed] [Google Scholar]
- 22.Mager J, Montgomery ND, de Villena FP, Magnuson T. Genome imprinting regulated by the mouse Polycomb group protein Eed. Nat Genet. 2003;33:502–7. doi: 10.1038/ng1125. [DOI] [PubMed] [Google Scholar]
- 23.Kaneda M, Okano M, Hata K, Sado T, Tsujimoto N, Li E, Sasaki H. Essential role for de novo DNA methyltransferase Dnmt3a in paternal and maternal imprinting. Nature. 2004;429:900–3. doi: 10.1038/nature02633. [DOI] [PubMed] [Google Scholar]
- 24.Wagschal A, Sutherland HG, Woodfine K, Henckel A, Chebli K, Schulz R, Oakey RJ, Bickmore WA, Feil R. G9a histone methyltransferase contributes to imprinting in the mouse placenta. Mol Cell Biol. 2008;28:1104–13. doi: 10.1128/MCB.01111-07. [DOI] [PMC free article] [PubMed] [Google Scholar]
- 25.Choi JD, Underkoffler LA, Collins JN, Marchegiani SM, Terry NA, Beechey CV, Oakey RJ. Microarray expression profiling of tissues from mice with uniparental duplications of chromosomes 7 and 11 to identify imprinted genes. Mamm Genome. 2001;12:758–64. doi: 10.1007/s00335-001-3027-5. [DOI] [PubMed] [Google Scholar]
- 26.Nikaido I, Saito C, Mizuno Y, Meguro M, Bono H, Kadomura M, Kono T, Morris GA, Lyons PA, Oshimura M, Hayashizaki Y, Okazaki Y. Discovery of imprinted transcripts in the mouse transcriptome using large-scale expression profiling. Genome Res. 2003;13:1402–9. doi: 10.1101/gr.1055303. [DOI] [PMC free article] [PubMed] [Google Scholar]
- 27.Schulz R, Menheniott TR, Woodfine K, Wood AJ, Choi JD, Oakey RJ. Chromosome-wide identification of novel imprinted genes using microarrays and uniparental disomies. Nucl Acids Res. 2006;34:88. doi: 10.1093/nar/gkl461. [DOI] [PMC free article] [PubMed] [Google Scholar]
- 28.Kuzmin A, Han Z, Golding MC, Mann MR, Latham KE, Varmuza S. The PcG gene Sfmbt2 is paternally expressed in extraembryonic tissues. Gene Expr Patterns. 2008;8:107–16. doi: 10.1016/j.modgep.2007.09.005. [DOI] [PMC free article] [PubMed] [Google Scholar]
- 29.Kent JW, Sugnet CW, Furey TS, Roskin KM, Pringle TH, Zahler AM, Haussler D. The Human Genome Browser at UCSC. Genome Res. 2002;12:996–1006. doi: 10.1101/gr.229102. [DOI] [PMC free article] [PubMed] [Google Scholar]
- 30.Kohonen T. Self-organizing formation of topologically correct feature maps. Biol Cybern. 1982;43:59–69. [Google Scholar]
- 31.Kohonen T. Self-Organizing Maps. 3rd edition Berlin, Heidelberg, New York: Springer; 2001. [Google Scholar]
- 32.Pan H, O'brien MJ, Wigglesworth K, Eppig JJ, Schultz RM. Transcript profiling during mouse oocyte development and the effect of gonadotropin priming and development in vitro. Dev Biol. 2005;286:493–506. doi: 10.1016/j.ydbio.2005.08.023. [DOI] [PubMed] [Google Scholar]
- 33.Oliveri RS, Kalisz M, Schjerling CK, Andersen CY, Borup R, Byskov AG. Evaluation in mammalian oocytes of gene transcripts linked to epigenetic reprogramming. Reproduction. 2007;134:549–58. doi: 10.1530/REP-06-0315. [DOI] [PubMed] [Google Scholar]
- 34.Namekawa SH, Park PJ, Zhang LF, Shima JE, McCarrey JR, Griswold MD, Lee JT. Postmeiotic sex chromatin in the male germline of mice. Curr Biol. 2006;16:660–7. doi: 10.1016/j.cub.2006.01.066. [DOI] [PubMed] [Google Scholar]
- 35.Affymetrix . Statistical Algorithms Description Document. Santa Clara, CA: Affymetrix; 2002. URL: http://www.affymetrix.com/support/technical/whitepapers/sadd_whitepaper.pdf. [Google Scholar]
- 36.Affymetrix . Guide to probe logarithmic intensity error (PLIER) estimation. Santa Clara, CA: Affymetrix; 2005. URL: http://www.affymetrix.com/support/technical/technotes/plier_technote.pdf. [Google Scholar]
- 37.Wu Z, Irizarry RA. Stochastic models inspired by hybridization theory for short oligonucleotide arrays. J Comput Biol. 2005;12:882–93. doi: 10.1089/cmb.2005.12.882. [DOI] [PubMed] [Google Scholar]
- 38.Irizarry RA, Bolstad BM, Collin F, Cope LM, Hobbs B, Speed TP. Summaries of Affymetrix GeneChip probe level data. Nucleic Acids Res. 2003;31:15. doi: 10.1093/nar/gng015. [DOI] [PMC free article] [PubMed] [Google Scholar]
- 39.Kent JW. BLAT—the BLAST-like alignment tool. Genome Res. 2002;12:656–64. doi: 10.1101/gr.229202. [DOI] [PMC free article] [PubMed] [Google Scholar]
- 40.Hsu F, Kent JW, Clawson H, Kuhn RM, Diekhans M, Haussler D. The UCSC Known Genes. Bioinformatics. 2006;22:1036–46. doi: 10.1093/bioinformatics/btl048. [DOI] [PubMed] [Google Scholar]
- 41.Vesanto J, Himberg J, Alhoniemi E, Parhankangas J. SOM Toolbox for Matlab 5. Espoo, Finland: Helsinki University of Technology, Neural Networks Research Centre; 2000. p. 57. [Google Scholar]
- 42.Ruf N, Dünzinger U, Brinckmann A, Haaf T, Nürnberg P, Zechner U. Expression profiling of uniparental mouse embryos is inefficient in identifying novel imprinted genes. Genomics. 2006;87:509–19. doi: 10.1016/j.ygeno.2005.12.007. [DOI] [PubMed] [Google Scholar]
- 43.Dittrich B, Buiting K, Korn B, Rickard S, Buxton J, Saitoh S, Nicholls RD, Poustka A, Winterpacht A, Zabel B, Horsthemke B. Imprint switching on human chromosome 15 may involve alternative transcripts of the SNRPN gene. Nat Genet. 1996;14:163–70. doi: 10.1038/ng1096-163. [DOI] [PubMed] [Google Scholar]
- 44.Mapendano CK, Kishino T, Miyazaki K, Kondo S, Yoshiura K, Hishikawa Y, Koji T, Niikawa N, Ohta T. Expression of the Snurf-Snrpn IC transcript in the oocyte and its putative role in the imprinting establishment of the mouse 7C imprinting domain. J Hum Genet. 2006;51:236–43. doi: 10.1007/s10038-005-0351-8. [DOI] [PubMed] [Google Scholar]
- 45.Mikkelsen TS, Ku M, Jaffe DB, Issac B, Lieberman E, Giannoukos G, Alvarez P, Brockman W, Kim TK, Koche RP, Lee W, Mendenhall E, O'Donovan A, Presser A, Russ C, Xie X, Meissner A, Wernig M, Jaenisch R, Nusbaum C, Lander ES, Bernstein BE. Genome-wide maps of chromatin state in pluripotent and lineage-committed cells. Nature. 2007;448:553–60. doi: 10.1038/nature06008. [DOI] [PMC free article] [PubMed] [Google Scholar]
- 46.Beechey CV, Cattanach BM, Blake A, Peters J. Mouse imprinting data and references. MRC Mammalian Genetics Unit; Harwell, Oxfordshire: 2005. URL: http://www.har.mrc.ac.uk/research/genomic_imprinting/ [Google Scholar]
- 47.Menheniott TR, Woodfine K, Schulz R, Wood AJ, Monk D, Giraud AS, Baldwin HS, Moore GE, Oakey RJ. Genomic imprinting of Dopa decarboxylase in heart and reciprocal allelic expression with neighbouring Grb10. Mol Cell Biol. 2008;28:386–96. doi: 10.1128/MCB.00862-07. [DOI] [PMC free article] [PubMed] [Google Scholar]
- 48.Pearson K. On lines and planes of closest fit to systems of points in space. Philosophical Magazine. 1901;2:559–72. [Google Scholar]
- 49.Hastie T, Stuetzle W. Principal Curves. Journal of the American Statistical Association. 1989;84:502–16. [Google Scholar]
- 50.Forgy E. Cluster analysis of multivariate data: efficiency versus interpretability of classifications. Biometrics. 1965;21:768–80. [Google Scholar]
- 51.Sammon J. A nonlinear mapping for data structure analysis. IEEE Transactions on Computers. 1969;18:401–9. [Google Scholar]
- 52.Sleutels F, Zwart R, Barlow DP. The non-coding Air RNA is required for silencing autosomal imprinted genes. Nature. 2002;415:810–3. doi: 10.1038/415810a. [DOI] [PubMed] [Google Scholar]
- 53.Mancini-Dinardo D, Steele SJ, Levorse JM, Ingram RS, Tilghman SM. Elongation of the Kcnq1ot1 transcript is required for genomic imprinting of neighboring genes. Genes Dev. 2006;20:1268–82. doi: 10.1101/gad.1416906. [DOI] [PMC free article] [PubMed] [Google Scholar]
- 54.Ono R, Shiura H, Aburatani H, Kohda T, Kaneko Ishino T, Ishino F. Identification of a large novel imprinted gene cluster on mouse proximal chromosome 6. Genome Res. 2003;13:1696–705. doi: 10.1101/gr.906803. [DOI] [PMC free article] [PubMed] [Google Scholar]
- 55.Chamberlain SJ, Brannan CI. The Prader-Willi syndrome imprinting center activates the paternally expressed murine Ube3a antisense transcript but represses paternal Ube3a. Genomics. 2001;73:316–22. doi: 10.1006/geno.2001.6543. [DOI] [PubMed] [Google Scholar]
- 56.Landers M, Bancescu DL, Le Meur E, Rougeulle C, Glatt-Deeley H, Brannan C, Muscatelli F, Lalande M. Regulation of the large (approximately 1000 kb) imprinted murine Ube3a antisense transcript by alternative exons upstream of Snurf/Snrpn. Nucleic Acids Res. 2004;32:3480–92. doi: 10.1093/nar/gkh670. [DOI] [PMC free article] [PubMed] [Google Scholar]
- 57.Liu J, Chen M, Deng C, Bourc'his D, Nealon JG, Erlichman B, Bestor TH, Weinstein LS. Identification of the control region for tissue-specific imprinting of the stimulatory G protein alpha-subunit. Proc Natl Acad Sci USA. 2005;102:5513–8. doi: 10.1073/pnas.0408262102. [DOI] [PMC free article] [PubMed] [Google Scholar]
- 58.Coombes C, Arnaud P, Gordon E, Dean W, Coar EA, Williamson CM, Feil R, Peters J, Kelsey G. Epigenetic properties and identification of an imprint mark in the Nesp-Gnasxl domain of the mouse Gnas imprinted locus. Mol Cell Biol. 2003;23:5475–88. doi: 10.1128/MCB.23.16.5475-5488.2003. [DOI] [PMC free article] [PubMed] [Google Scholar]
- 59.Varrault A, Gueydan C, Delalbre A, Bellmann A, Houssami S, Aknin C, Severac D, Chotard L, Kahli M, Le Digarcher A, Pavlidis P, Journot L. Zac1 regulates an imprinted gene network critically involved in the control of embryonic growth. Dev Cell. 2006;11:711–22. doi: 10.1016/j.devcel.2006.09.003. [DOI] [PubMed] [Google Scholar]
- 60.Arnaud P, Monk D, Hitchins M, Gordon E, Dean W, Beechey CV, Peters J, Craigen W, Preece M, Stanier P, Moore GE, Kelsey G. Conserved methylation imprints in the human and mouse GRB10 genes with divergent allelic expression suggests differential reading of the same mark. Hum Mol Genet. 2003;12:1005–19. doi: 10.1093/hmg/ddg110. [DOI] [PubMed] [Google Scholar]
- 61.Hikichi T, Kohda T, Kaneko Ishino T, Ishino F. Imprinting regulation of the murine Meg1/Grb10 and human GRB10 genes; roles of brain-specific promoters and mouse-specific CTCF-binding sites. Nucleic Acids Res. 2003;31:1398–406. doi: 10.1093/nar/gkg232. [DOI] [PMC free article] [PubMed] [Google Scholar]
- 62.Ultsch A, Siemon HP. Kohonen's self organizing feature maps for exploratory data analysis; Proceedings of the International Neural Network Conference (INNC); Dordrecht, Netherlands: Kluwer; 1990. pp. 305–8. [Google Scholar]