ECOLOGY. For the article “Anthropogenic increase in carbon dioxide compromises plant defense against invasive insects,” by Jorge A. Zavala, Clare L. Casteel, Evan H. DeLucia, and May R. Berenbaum, which appeared in issue 13, April 1, 2008, of Proc Natl Acad Sci USA (105:5129–5133; first published March 28, 2008; 10.1073/pnas.0800568105), the authors note errors involving Figs. 1 and 4. In Fig. 1, several gel bands were inserted incorrectly during editing of the figure. In addition, Fig. 4 was a duplicate of Fig. 2. These errors do not affect the conclusions of the article. The corrected figures and their legends appear below.
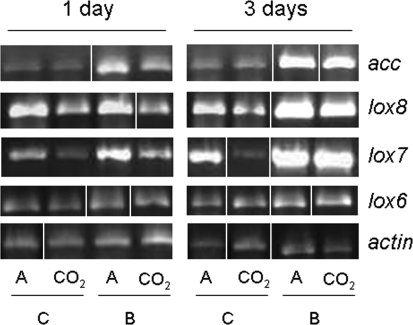
Fig. 1.
Expression analysis of genes related with JA and ethylene biosynthesis. Quantitative RT-PCR of five genes from fully expanded leaves of soybean grown either under elevated [CO2] (CO2) or ambient [CO2] (A): 1-aminocyclopropane-1-carboxylate synthase (acc), lipoxygenase 7 (lox7), 8 (lox8), and 6 (lox6). RNA was extracted from four replicates (one replicate per plot) of leaves either unattacked (C) or attacked by Japanese beetles (B) for 1 or 3 days and reverse-transcribed to cDNA. PCRs were replicated from four independent cDNA samples for all primers. Prior to statistical analysis, the spot intensity values generated by image analysis software for each gene were normalized to the intensity of actin to correct for differences in amplification of cDNA. The figure is a composite of multiple experiments and contains images spliced into place.
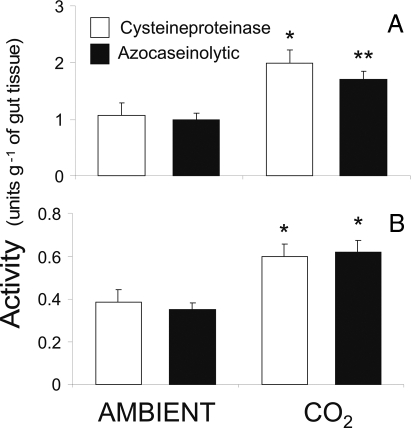
Fig. 4.
Total proteinase and cysteine proteinase activities in the gut of beetles. (A and B) JB (A) or WCR (B) fed for 3 days on soybean leaves grown under ambient or elevated CO2. Values represent the average of four independent samples (one replicate per FACE plot). Azocaseinolytic and cysteine proteinase activities are represented in different units. Asterisks indicate the level of significant difference between ambient and elevated CO2 treatments (*, P < 0.05; **, P < 0.001; ***, P < 0.0001).


